BJRS
RADIATION SCIENCES
03-1A (2015) 01-06Mapping of the radiation field of a mammography
equipment using molybdenum and rhodium filters
J. S. Barreira
a; V. Vivolo
aa Gerência de Metrologia das Radiações/Laboratório de Calibração de Instrumentos, Instituto de Pesquisas
Energéticas e Nucleares, 05508-000, São Paulo-SP, Brasil jacsales@usp.br
ABSTRACT
The use of X rays for diagnostic radiology is very common and important to Medicine, including mammographic diagnosis focusing decreasing of the doses applied to the patients and preserving high quality of the diagnostic image. A quality control program of the irradiation systems it is very necessary. The Instruments Calibration Laboratory (LCI) of IPEN perform calibration in dosemeters used in radiation dosimetry (in diagnostic radiology) for many years. The objective of that paper is determining the point of greatest intensity of the beam issued by the mammograph equipment. Exposures were made with filters Rhodium and Molybdenum. That mapping is important before applied a routine quality control program of the mammograph equipment and the calibration of instruments in the diagnosis.
Keywords: X-ray; Mammography; Radiation beam
1.
INTRODUCTION
Breast cancer accounts for nearly 25% of all cases and is the most common type among women in the world. Estimates for 2014 indicate 57,000 new cases of breast cancer in Brazil, the third highest incidence, behind melanoma and prostate cancer.
The World Health Organization (WHO) estimates 27 million new cancer cases for 2030 worldwide, and 17 million deaths from the disease. Developing countries will be most affected, including Brazil. [1]
Given this scenario, it becomes essential mammography in screening and detection of breast cancer. But to obtain a suitable image, it is necessary that the X-ray emitter equipment is properly calibrated.
The objective of that paper is determining the point of greatest intensity of the beam of radiation. Using an electrometer PTW Unidos E coupled to the ionization chamber PTW 31013, with a sensitive volume of 0.3 cm ³, with measurement on the greatness of picocoulombs (pC), varied with the position of the chamber every 1 cm both vertical and horizontal plate that supports the breast during examination. Exposures were made with filters Rhodium and Molybdenum.
Exposures were made with filters Rhodium and Molybdenum. That mapping is important before applied a routine quality control program of the mammograph and the calibration of instruments in the diagnosis.
2.
MATERIALS AND METHODS
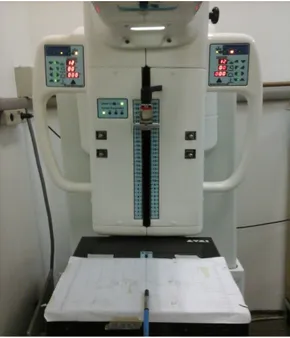
In this study were used the VMI Graph Mammo AF Phillips, who operates in the range 20 to 35 kilovolts (kV), has target of Molybdenum (Mo) and inherent filter Rhodium (Rh) and Molybdenum.
To perform the measurements, were used the electrometer PTW Unidos E, coupled to the ionization chamber PTW 31013, with a sensitive volume of 0.3 cm ³, with measurement on the greatness of picocoulombs (pC).
Were also used the meter Luft Opus 20, to monitor the temperature in degrees Celsius, relative humidity in %, and Hectopascal pressure (hPa) lab.Were selected 28 kV since this value is reported in various standards and calibration tests [2], and 200 mAs, because a shorter exposure time difficult reading in charge by electrometer.
The ionization chamber was placed on the breast support at the point of maximum beam previously determined by Correa et al [3] to be at 50mm from the outer edge of the breast support in the center thereof.
The ionization chamber was placed on the breast support at the point of maximum beam previously determined by Correa et al [3] to be at 50mm from the outer edge of the breast support in the center thereof (figure 1).
Figure 1: Ionization chamber and mammography equipment
The ionization chamber was placed on the breast support at the point of maximum beam Were performed five exposures always with the same kV and mAs, at the same point, first with the Rh filter and then with Mo filter.
Each of the readings obtained were recorded together with the temperature, pressure and humidity in the laboratory during the test, as seen in the table 1 and table 2.
This procedure was repeated every 1 cm along the X axis, 1, 2, 3, 4, 5 and 6 cm beginning with the nearest edge of the trunk where the patient is positioned, then, the Y axis is mapped each 2 cm from the left edge to the right edge.
Finally, we measure the load on all the intersections of the XY right to left, for example, the ionization chamber was placed 1 cm from the outer edge of the breast support and 2 cm left relative to the central axis of the support, then 4, 6 and so on until you reach 12 cm.
The same was done for the right side. Following the same procedure 2 cm from the outer edge of the breast support, and so on until you get to 6 cm from the edge of the support.
Table 1: Charge collected with Mo filter Molybdenum Filter Charge (pC) Time (s) Temperature (°C) Pressure (hPa) Current Corrected Lecture (pC) 171,2 10 23,2 922,3 789,0 222,251 170,7 10 23,2 922,3 789,0 221,601 171,1 10 23,2 922,3 789,0 222,121 171 10 23,2 922,3 789,0 221,991 171 10 23,2 922,3 789,0 221,991
Data collected at point 4 cm from the x axis of the compressor breast, 5 exposures for Mo filter. Were noted the time, temperature, pressure, charge and the corrected charge.
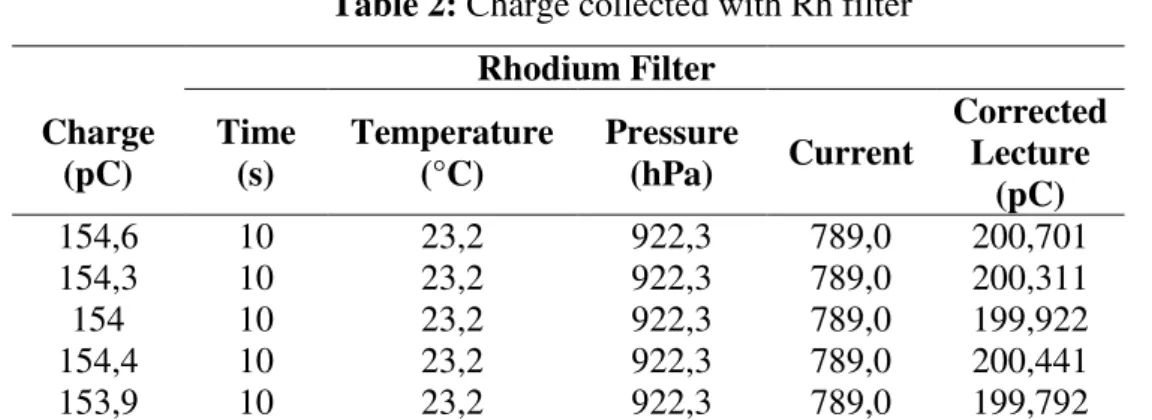
Table 2: Charge collected with Rh filter Rhodium Filter Charge (pC) Time (s) Temperature (°C) Pressure (hPa) Current Corrected Lecture (pC) 154,6 10 23,2 922,3 789,0 200,701 154,3 10 23,2 922,3 789,0 200,311 154 10 23,2 922,3 789,0 199,922 154,4 10 23,2 922,3 789,0 200,441 153,9 10 23,2 922,3 789,0 199,792
Data collected at point 4 cm from the x axis of the compressor breast, 5 exposures for Rh filter. Were noted the time, temperature, pressure, charge and the corrected charge.
3.
RESULTS AND DISCUSSION
In reading done on the X axis, there was a peak load in region 4 cm from the edge of the breast support, other than ourselves at work Correa et. al. found that the peak at 5 cm.
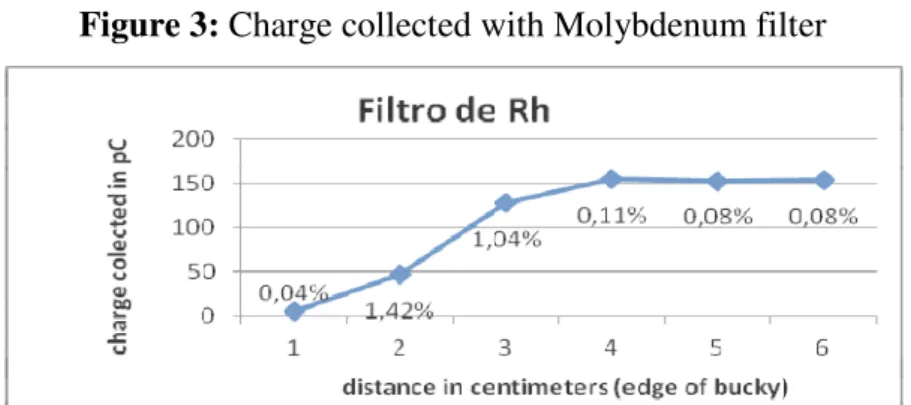
This result was observed in exposure performed with the two filters, however in the Rh filter, the beam is more intense in regions 4, 5 and 6, whereas in the regions 2 and 3 there is a significant drop, reaching a nearly reading 0-1 cm from the edge of the breast receiver, which can be observed in figure 3. With the filter Mo, we observed that the high beam is shown in all positions of the X axis, with its well-defined peak in the region of 4 cm, as seen in figure 2.
Figure 2: Charge collected with Molybdenum filter
The vertical column indicates the reading load pC, and the horizontal region in cm where the ionization chamber was placed. Demonstrates that the region where there was the highest
reading load was 4 cm.
Figure 3: Charge collected with Molybdenum filter
Graphic of measurements made using Rh filter. The region where there was the highest reading load was also 4 cm.
4.
CONCLUSIONS
The radiation beam emitted by mammography has used in this study show differences in behavior with changes in filter, but this beam is homogenous in its extent for each filter, making it suitable for performing calibration of detectors used in mammography, such as have a small sensitive volume, which can easily be positioned in the region where the beam is more intense.
REFERENCES
1. INCA - Instituto Nacional Do Câncer. Estimativa | 2012 - Incidência de Câncer no Brasil. Rio de Janeiro, RJ - 2011.
2. IAEA - Internacional Atomic Energy Agency - Dosimetry in Diagnostic Radiology: an
International Code of Practice. TRS 457, (2007)
3. CORRÊA, E. de L. Metodologia de controle de qualidade e implantação de campos padrões
de radiação X, nível mamografia, seguindo a norma IEC 61267. São Paulo, São Paulo, Brazil.
Available at: <http://www.teses.usp.br/teses/disponiveis/85/85131/tde-01082011-095103/>. Last accessed: 10 March 2014