Empirical study of Chinese small and medium enterprises
Finance
Master's thesis Dong Wang 2013
Department of Finance Aalto University
School of Business
Powered by TCPDF (www.tcpdf.org)
Ownership structure and corporate diversification:
Empirical study of Chinese small and medium enterprises
Master’s Thesis Dong Wang Fall 2013
Master in Finance
Approved in the Department of Finance __ / __20__ and awarded the grade _______________________________________________________________________
Author Dong Wang
Title of thesis Ownership structure and corporate diversification: Empirical study of Chinese small and medium enterprises
Degree Master in Science Degree programme Finance Thesis advisor(s) Vesa Puttonen
Year of approval 2013 Number of pages 65 Language English Abstract
Purpose
Substantial previous researches find that corporate diversification lead to value erosion. Agency theory was an often-cited explanation to rationale decision maker’s motivations toward diversification. With 144 Chinese public companies from the Small and Medium board in Shenzhen Stock Exchange, I explain how agency problems motivate Chinese public firms to diversify.
Data and methodology
Sample firms used in my analysis are selected from Small and Medium board in Shenzhen Stock Exchange.
I collect data on the number of business segments in which the listed firm operates in, segment sales data, and some financial figures from Worldscope database. Owner identity and shareholdings of ultimate controller are manually collected from sample firms’ annual reports. Managerial and institutional ownership are collected from Wind database. Several OLS regression was executed to analyze their impacts on the diversification level.
Findings
Firstly, I find a significant negative relation exists between managerial ownership and diversification level.
This indicates that as the shareholdings of management increase, interests between manager’s and shareholder become more aligned, and thus managers are less likely to adopt value-reducing diversification.
Second, cash-flow right which proxy the equity stakes of ultimate controller are negatively between cash-flow right of ultimate controller’s and diversification level for my sample firms. This provide the evidence on the align effects of interests between ultimate controller and minority shareholders. Third, I document a positive relation between the divergence between the cash-flow right and voting right of ultimate controller’s and diversification level. When block holders hold much more voting power than their claims to the cash-flows, they tend to expropriate minority interest via diversification.
Keywords diversification, agency problem, managerial ownership, ultimate controller identity, cash-flow right, separation
Table of Contents
1. Introduction...1
1.1. Background information...1
1.2. The goal of the study...2
1.3. Summary of the findings...3
2. Ownership Structure and corporate diversification in China...4
2.1. China’s rapid growth economy and capital market...4
2.1.1. Description of the Shanghai and Shenzhen Stock Exchanges...4
2.1.2. The SME Board on the Shenzhen Stock Exchange...6
2.2. Ownership structure...8
2.2.1. Classification of owner identity...8
2.2.2. Concentration of shareholdings in China...9
3. Literature review...10
3.1. Reasons for corporate diversification...11
3.2. Company performance and diversification...12
3.3. Agency problems between manager and shareholder cause corporate diversification...13
3.3.1. Reduction of personal risk...14
3.3.2. Gains of self-benefits...14
3.4. Agency problems between block holder and minority shareholder cause corporate diversification...15
3.4.1. Positive effect on corporate governance of the widespread block holders...15
3.4.2. Controlling shareholder’s incentives to diversification...16
3.4.3. Cash-flow right, separation between cash-flow right and voting right and diversification...18
3.5. Owner identity and diversification...18
3.5.1. Family controlled firm and diversification...19
3.5.2. Financial-institutional controlled firm and diversification...20
3.5.3. State controlled firm and diversification...20
4. Previous findings on corporate diversification in China...21
4.1. Corporate diversification in China...21
4.2. Firm performance and corporate diversification in China...21
4.3. Owner identity, shareholding concentration and corporate diversification...22
5. Research hypothesis...23
5.1. Management ownership and level of diversification...23
5.2. Owner identity and the level of diversification...24
5.2.1. State...24
5.2.2. Family...25
5.3. Cash-flow right, separation of control-rights and cash-flow right and level of diversification 25 6. Data and definition of variables...26
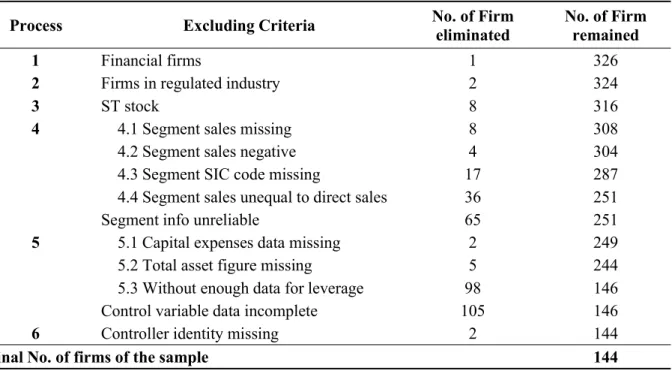
6.1. Data source and screening process...26
6.2. Definition of variables...28
6.2.1. Dependent variable---Diversification level...28
6.2.2. Independent variable---ownership variables...29
6.2.3. Firm-level control variables...34
7. Methodology...37
8. Empirical results and discussion...38
8.1. Descriptive results...38
8.1.1. Diversification level...38
8.1.2. Managerial ownership...40
8.1.3. Ultimate owner identity, ownership and diversification...41
8.2. Regression Results and discussion...43
8.2.1. Managerial ownership and diversification...43
8.2.2. Ultimate owner identity and diversification level...46
8.2.3. Cash-flow rights, separation between voting rights and cash-flow rights and diversification...47
8.3. Additional test...52
9. Limitations and Conclusion...52
9.1. Conclusion...52
9.2. Limitations...53
References...54
Appendix...61
Table List
TABLE1: MARKETCAPITALIZATION OFDOMESTIC-LISTEDCOMPANIES BY30 DEC, 2012 (INUS $
MILLION)...5
TABLE2: SUMMARY OF THECHINESESTOCKMARKET(1992-2011)... 6
TABLE3: SHAREHOLDINGSTRUCTURE OFLISTEDFIRMS INCHINA(AS THE END OF2011)...10
TABLE4: SELECTION PROCESS OF THE SAMPLE FIRMS... 27
TABLE5: SUMMARY OFVARIABLES...36
TABLE6: STATISTICAL SUMMARY ON THE OTHER VARIABLES FOR ALL FIRMS...39
TABLE7: DESCRIPTIVE STATISTICS OF THE DIVERSIFICATION SITUATION FOR TOTAL SAMPLE COMPANIES...40
TABLE8: DESCRIPTIVESTATISTICS OF SHAREHOLDINGS OF MANAGEMENT AND DIVERSIFICATION INDEX... 41
TABLE9: OWNER IDENTITY AND SEPARATION BETWEEN VOTING RIGHTS AND CONTROL RIGHTS OF ALL SAMPLE FIRMS... 42
TABLE10: REGRESSION FOR THE RELATIONS BETWEEN LEVEL OF DIVERSIFICATION AND MANAGERIAL OWNERSHIP...45
TABLE11: REGRESSION FOR THE RELATIONS BETWEEN OWNER IDENTITY AND CORPORATE DIVERSIFICATION FOR ALL SAMPLE FIRMS(10%THRESHOLD)... 47
TABLE12: REGRESSION FOR THE RELATIONS BETWEEN ULTIMATE CONTROLLER'S CASH-FLOW RIGHTS AND CORPORATE DIVERSIFICATION(10%THRESHOLD)...48
TABLE13: REGRESSION FOR THE RELATIONS BETWEENSEPARATION BETWEEN VOTING RIGHT AND CASH-FLOW RIGHT AND CORPORATE DIVERSIFICATION(10%THRESHOLD)... 50
TABLE14: REGRESSION FOR THE RELATIONS BETWEEN CASH-FLOW RIGHT,SEPARATION BETWEEN CASH-FLOW RIGHT AND VOTING RIGHT AND CORPORATE DIVERSIFICATION(10%THRESHOLD).. 51
Figure List
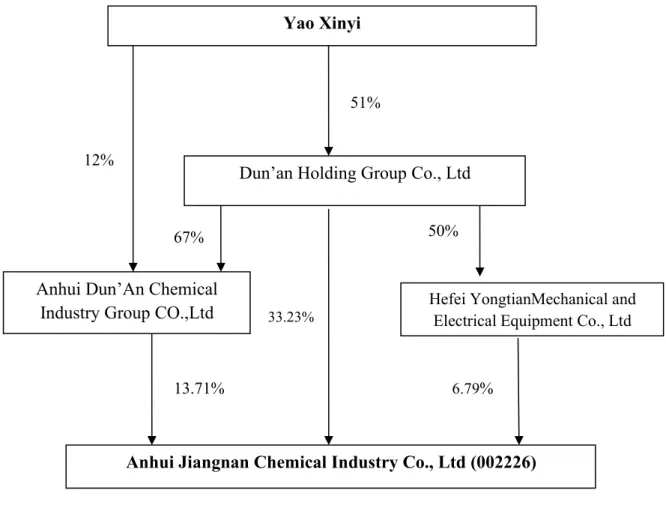
TABLE1: IPOS NUMBER AND CAPITAL ROSE EACH YEAR FROM2004TO2011... 7FIGURE2: CONTROLLING STRUCTURE OFANHUIJIANGNANCHEMICALINDUSTRYCO., LTD(002226) ... 32
FIGURE3: CONTROLLING STRUCTURE OFXINJIANGGUOTONGPIPELINECO., LTD(002205)...33
FIGURE4: CONTROLLING STRUCTURE OFZHEJIANGJINGXINGPAPERJOINTSTOCKCO., LTD(002067) ... 33
1. Introduction
1.1. Background information
Corporate diversification is the process a company expands from its core business into other industry or product lines (Chandler, 1962; Andrews, 1980).Ever since it was firstly defined by Ansoff in 1950s, diversification has been as an alternative strategy for company growth.
Many researches reveal that firms implementing diversification strategy can benefit from several ways, such as enabling the firm obtaining new growth opportunities via investing in more profitable and promising business (Mueller, 1972), reducing the asymmetric of information and allocating resources more efficiently by creating an internal market (Meyers and Majluf, 1984), decreasing cash flow volatility and expanding debt and tax shield capacity (Lewellen, 1971; Shleifer andVishny, 1992). Diversification became very common among the large corporations from 1950s to 1970s.Rumelt (1974) analyzed the Fortune 500 firms by the year 1974, finding that 14 percent of those firms operated as single business and the rest 86 percent were diversified companies.
From 1990s on, Chinese firms started to diversify their business at very low cost. Many company expansions into related or unrelated business areas from core business are realized through mergers, acquisitions, or new investment. A number of large corporate conglomerates were established as a result. For example, Hair Group, by leveraging its strength and resources in brand, culture, capital etc., entered into air-conditioner, washing machines industries from a purely fridge maker. Wuliangye Group, by acquiring the selected companies, now competes in bio-engineering, pharmaceutical industry, printing, electronics, logistics and transports, which are unrelated with its core alcohol business. Both of the two firms increased size and profits via diversification.
However, just as in any economic activity, costs are also associated with diversification beside the benefits introduced above. A lot of diversified companies did not achieve the expected profits and some even went to bankruptcy rather and success. Many scholars examined diversification’s impacts on company performance, and recorded a negative relation between diversification level and company performance. Basing on the widely dispersed ownership structure, several analyses find that diversified American firms are traded at a discount from otherwise similar single-business firms (see, for example, Berger
and Ofek, 1995; Lang and Stulz, 1994). Comment and Jarrell (1995), John and Ofek (1995) documented an increased corporate focus of US firms during the 1980s and reported that the increase in focus is associated with positive stock price performance on the capital market.
With more than 1000 firms from 7 emerging markets as the sample, Lins and Seavaes (2002) finds that diversified firms are valued at 7% discount on average than the otherwise single business companies.
1.2. The goal of the study
If diversification is associated with value-reducing phenomenon or bad company performance, why so many firms are still found involved in different business lines? Agency theory was believed to provide the rationale behind of implementation of diversification strategy (see, e.g., Amihud and Lev, 1981;Lins and Servaes, 1999) Misalignment of interests between agent/manger and principal/owner in dispersedly held firms, and between controlling shareholder and minorities in public companies with concentrated ownership are cited to the driver for diversification.
China is going through a transition from a planned economy to a socio-market oriented one.
Although the state-owned enterprises (SOEs) still dominate China’s economy1, the government enacts a series of laws and regulations to encourage the development of small- and medium-sized enterprises. Anderson et al. (2003) find that the rapid economic growth of China goes with a relative decline of large state-owned enterprise and an explosive increase of small enterprises. The Small and Medium Enterprise board (SME board) was established to encourage and facilitate the development of Chinese small and medium sized enterprises which may not satisfy the standard to be listed on the main board of Shanghai and Shenzhen Stock Exchanges.
This provides a unique sample to study the governance of Chinese companies, which are different from those listed on the main board. What’s more, most previous studies on diversification strategy of the Chinese listed firms focused on investigating the association between company performance and diversification level, with very limited attention given to how the ownership structure impacts the diversification level. In previous studies, the sales data used for calculating diversification index is often manually collected, and definition of
1 For example, Fan and Wong (2004) shows that percentage of companies with the government as the ultimate controller reaches 76% in their sample.
business segments and classification of those figures are more subjective. Data used in my paper are mostly directly retrieved from Worldscope database, making it more consistent with those studies of western companies. Basing on the assumption of agency theory, I try to answer the following questions:
a) How managerial ownership is related company diversification level?
b) Do different types of ultimate controller identity have any implication on diversification level?
c) What are the relations between shareholdings of ultimate controller’s and diversification level?
1.3. Summary of the findings
I provide evidence on the agency cost explanation for the diversification of Chinese public firms on the SME board. Followings are my main findings:
First, I find significant a negative relation exists between managerial ownership and diversification level. This indicates that as the shareholdings of management increase, interests between manager’s and shareholder become more aligned, and thus managers are less likely to adopt value-reducing diversification. Second, cash-flow right which proxy the equity stakes of ultimate controller are negatively between cash-flow right of ultimate controller’s and diversification level for my sample firms. This provide the evidence on the align effects of interests between ultimate controller and minority shareholders. Third, I document a positive relation between the divergence between the cash-flow right and voting right of ultimate controller’s and diversification level. When block holders hold much more voting power than their claims to the cash-flows, they tend to expropriate minority interest via diversification.
The rest of the paper is arranged as follow: section 2 provides some background information of Chinese stock market; theoretical framework and research objectives are portrayed in section 3; section 4 present previous findings regarding diversification within the Chinese corporate governance; section 5 describes the data set; I develop the hypotheses in section 5 and describes the data and define the variables in section 6; section 7 presents methodology
used in this paper, and in section 8, empirical results are provide and analyzed ; section 9 conclude the paper and point out future potential study opportunities.
2. Ownership Structure and corporate diversification in China
In this part, I discuss the relation between ownership structure and corporate diversification strategy within the context of China. I firstly give background information about Chinese rapidly growing economy, with focusing on the inception and development of Chinese stock market. Then background information regarding the ownership structure in China is provided.
After that I review previous findings on the corporate diversification among Chinese listed firms. After that, I clearly define the owner identity from ultimate controlling perspective.
2.1. China’s rapid growth economy and capital market
The economy development of People’s Republic of China experienced two stages: planned economy (from1949 to1979) and continuous development of market-oriented economy (from 1979 until now). In order to build the market economy, the Chinese government started to implement the Open and Reform policy in late 1970s. Open policy enables China attract more foreign investors and investment to participate in the construction of the modern Chinese economy; reform policy enable the original state-owned Chinese companies try to seek a way to develop their own modern company systems. Ever since then, the Chinese economy experienced continuous rapid growth for more than three decades. Meanwhile, Chinese companies grow rapidly in size, so do their needs for capital. As one of the most important ways to create more wide financing sources, the Shanghai Stock Exchange and Shenzhen Stock Exchange were established in 1990 and 1991 respectively.
2.1.1. Description of the Shanghai and Shenzhen Stock Exchanges
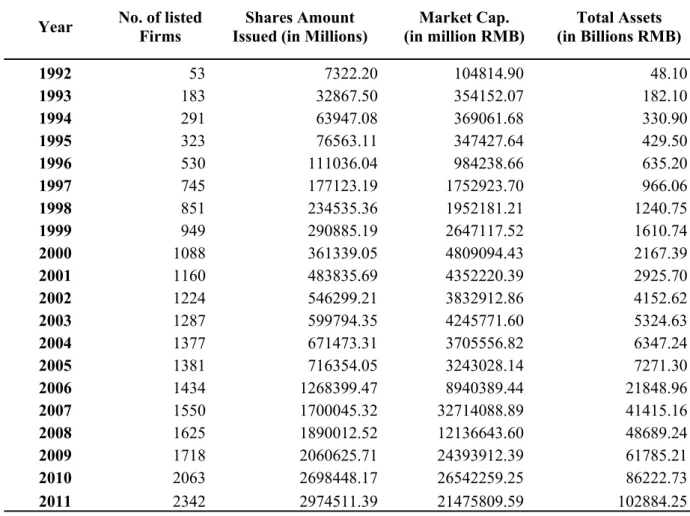
Synchronized with the booming of Chinese economy during the past two decade, the Chinese stock market undergoes tremendous growth as well. The number of the publicly traded enterprises, trading volume, and total market capitalization has increase dramatically since the opening of the two stock exchanges. Listed companies in SSE and SZSE increases from the initial 13 to 2342 in 2011, with a total markets capitalization $1.37 trillion (see table 1).
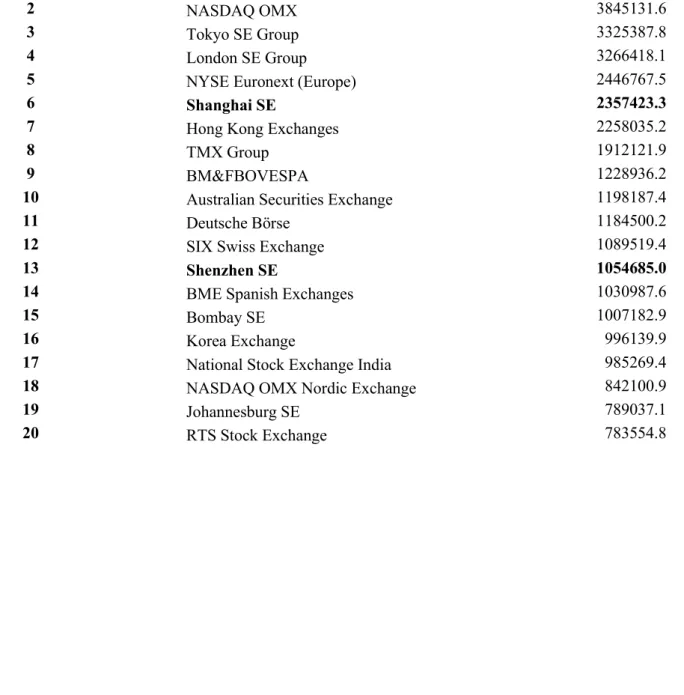
The statistical numbers of World Federation of Exchanges (WFE) reveals that China ranks third only to the U.S and Japan based on the market capitalization of domestic listed-firms (see table 2).
Table 1: Market Capitalization of Domestic-listed Companies by 30 Dec, 2012 (in US $ million)
1 NYSE Euronext (US) 11795575.5
2 NASDAQ OMX 3845131.6
3 Tokyo SE Group 3325387.8
4 London SE Group 3266418.1
5 NYSE Euronext (Europe) 2446767.5
6 Shanghai SE 2357423.3
7 Hong Kong Exchanges 2258035.2
8 TMX Group 1912121.9
9 BM&FBOVESPA 1228936.2
10 Australian Securities Exchange 1198187.4
11 Deutsche Börse 1184500.2
12 SIX Swiss Exchange 1089519.4
13 Shenzhen SE 1054685.0
14 BME Spanish Exchanges 1030987.6
15 Bombay SE 1007182.9
16 Korea Exchange 996139.9
17 National Stock Exchange India 985269.4
18 NASDAQ OMX Nordic Exchange 842100.9
19 Johannesburg SE 789037.1
20 RTS Stock Exchange 783554.8
Table 2: Summary of the Chinese Stock Market (1992-2011)
Year No. of listed Firms
Shares Amount Issued (in Millions)
Market Cap.
(in million RMB)
Total Assets (in Billions RMB)
1992 53 7322.20 104814.90 48.10
1993 183 32867.50 354152.07 182.10
1994 291 63947.08 369061.68 330.90
1995 323 76563.11 347427.64 429.50
1996 530 111036.04 984238.66 635.20
1997 745 177123.19 1752923.70 966.06
1998 851 234535.36 1952181.21 1240.75
1999 949 290885.19 2647117.52 1610.74
2000 1088 361339.05 4809094.43 2167.39
2001 1160 483835.69 4352220.39 2925.70
2002 1224 546299.21 3832912.86 4152.62
2003 1287 599794.35 4245771.60 5324.63
2004 1377 671473.31 3705556.82 6347.24
2005 1381 716354.05 3243028.14 7271.30
2006 1434 1268399.47 8940389.44 21848.96
2007 1550 1700045.32 32714088.89 41415.16
2008 1625 1890012.52 12136643.60 48689.24
2009 1718 2060625.71 24393912.39 61785.21
2010 2063 2698448.17 26542259.25 86222.73
2011 2342 2974511.39 21475809.59 102884.25
2.1.2. The SME Board on the Shenzhen Stock Exchange
In line with its aim of continued development and perfection of the market economy, Chinese government also enacts series of laws and rules to encourage and facilitate the development of small and medium sized enterprises (SMEs). SMEs experienced golden period of booming development. Take the industrial companies for example. 30-year after implementation of Open and Reform policy, the number of SMEs above Designated Size2 reaches 449 000 and provide jobs to 70 560 000 people in 2010, 99.3% and 77.9% of that of all industrial
2 Companies above Designated Size are those whose total assets, number of employees, main business income etc. satisfy certain measures. These measures vary according to the industry type and are set by National Bureau of Statistics of China. For example, the measure is all state-owned industrial companies and non-state-owned industrial companies whose annual main business income is larger than 5 million RMB.
companies above Designated Size.3 However, getting external finance for expansion or future development of these SMEs has been always very difficult. Some nonofficial estimates shows that, production from non-state owned section has contributed more than 60% of the whole GDP of China. Contrast to the great contributions, less than 30 percent of the whole loans issued by Chinese financial departments go to the private part.
Small and Medium Enterprise Board (SME Board) was launched in June, 2004. It is a major step toward the establishment of a multi-tier capital market system and paved the way for a second boar market. After seven year’s innovation and development, the SME board has become a unique, indispensable and independent segment in China’s multi-tier capital market system. It is also the great efforts that SZSE has been making continuously to support independent innovation. Although firms are allowed to issue relatively small securities via this platform, listed enterprises have to satisfy same listing requirements and obey the same rules and regulations with those on the main board. By the end of 2011, 646 companies issue stocks through this platform, with a total market capitalization US $ 428.6 billion. Total proceeds from these firms’ IPO reached US $ 88.7 billion.
Table 1: IPOs number and capital rose each year from 2004 to 2011
Sources: Based on Shenzhen Stock Exchange Fact Book 2011
3From the 12th“Five-year” Planning for SMEs. Source: Ministry of Industry and Information Technology of the People’s Republic of China.
2.2. Ownership structure
2.2.1. Classification of owner identity
Ever since China Security Regulatory Commission (CSRC) made modifications to regulations regarding the disclosure of company information in 2002, all publicly traded companies are required to disclose the ownership information in the annual report. Detailed information, including the name and types of the ultimate controller, structure of the ownership, names and types of top 10 shareholders, individual or legal entity with ownership larger than 10%, has to be disclosed.
A large portion of previous study on the ownership structure of Chinese public companies are basing on the official classification of share types. According to official classification, regardless of which exchanges (Shanghai or Shenzhen Stock exchanges) it is on, a typical listed company has five different types of shares: state shares, legal person shares, employee shares, tradable A-share and B-share (see, e.g., Xu and Wang 1997). The state shares are, directly or indirectly, held by central government, local government, state asset management bureau, or solely state-owned enterprise; with the ultimate owner as the State Council of China and not tradable. Legal person shares are owned by non-individual legal entity or institutions. In the context of China, legal person could be joint-stock companies, industrial enterprises, non-bank financial institutions (such as securities companies, trust and investment companies, foundations and funds etc.), and SOEs that have at least one non-state owners4. Legal person shares are non-tradable and transfer of such shares need to gain the approval of CSRC before 2005. After the implementation of Measures for the Administration of the Share-trading Reform of Listed Companies in year 2005, part of the original non-tradable state shares and legal person shares are transferable on the market step by step.
For those permitted to be listed, a proportion is still not listed. Tradable A-shares are held and traded mostly by individual and some by domestic institutions. Employee shares are offered to workers and managers of listed SOEs during the process of their ownership structure reform, or issued to by the private-owned enterprise to its workers as an incentive
4 According to ‘Law of the People’s Republic of China on Commercial Banks’, Chinese merchant bank is not allowed to own equity of firms directly.
measure. Nowadays, the proportion of the employee shares are pretty small, less than.
B-share is issued and traded in different foreign currencies: in SSE in US dollar and in SZSE in Hong Kong dollar. The introduction of B-share in mainland China is to attract foreign capital to China’s capital market, so it is not available to Chinese investors. Now 53 listed firm in SSE and 54 public enterprises have B-share. In addition, companies may also choose to list its share in Hong Kong stock exchange or other oversea exchanges. So it’s possible for some Chinese corporations have H-share or S-share, etc.
2.2.2. Concentration of shareholdings in China
According to the official classification of share types, a large number of previous empirical studies explored characteristics of Chinese public firm’s ownership structure (see, e.g., Xu and Wang, 1999; Wu, 2004; Watanabe, 2010). Xu and Wang (1999) claim that a typical Chinese listed firm has a mixed ownership structure, with three predominant groups of owners---state, legal person and individual. Wu (2004) find that each of the three types of owners holds about 30% of the shareholdings. Watanabe (2010) find that concentrated ownership structure is common among Chinese public companies, with the largest owner holding 35% of the total outstanding shares on average. He also documented that 60% to 80%
of listed firms are controlled by the state during 1997 to 2007.
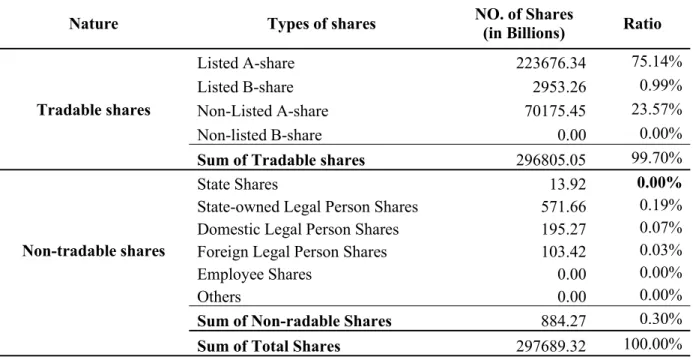
Table 3 presents the shareholding structures of the listed Chinese firms as the end of year 2011. Thanks to the ownership structure reform initiated in 2005, the state and legal person shares become transferable gradually, and the original non-tradable shares decreased substantially, accounting less than 0.3% of outstanding shares in 2011. Compared with finding by Xu and Wang (1999) and Wu (2004), it’s easy to find that great changes have taken place in the Chinese capital market. Analyzing the ownership structure according to the official standard might not be reliable anymore. After a careful examination of the ultimate owner identity of various types of shares, Liu & Sun (2005) find that classification of owner identity according to types of shares is ambiguous and far away from accurately revealing the real owner of Chinese firms’ stocks. Specifically, the legal person shares can be held by the state-owned legal person, domestic independent legal person and foreign legal person.
Therefore, when the largest shareholder is state-owned legal person, the state, rather than the nominal legal person have the ultimate decision right on the firms’ strategies, such as diversification. Similarly, individual or family directly or indirectly have significant impacts
on firms’ policies when they are in block holding positions. Thus, it is inappropriate to group the legal person as an independent category which is parallel to the state and individual.
Table 3: Shareholding Structure of Listed Firms in China (as the end of 2011)
Nature Types of shares NO. of Shares
(in Billions) Ratio
Tradable shares
Listed A-share 223676.34 75.14%
Listed B-share 2953.26 0.99%
Non-Listed A-share 70175.45 23.57%
Non-listed B-share 0.00 0.00%
Sum of Tradable shares 296805.05 99.70%
Non-tradable shares
State Shares 13.92 0.00%
State-owned Legal Person Shares 571.66 0.19%
Domestic Legal Person Shares 195.27 0.07%
Foreign Legal Person Shares 103.42 0.03%
Employee Shares 0.00 0.00%
Others 0.00 0.00%
Sum of Non-radable Shares 884.27 0.30%
Sum of Total Shares 297689.32 100.00%
In this paper, I follow the sprite of ultimate ownership principle to portrait the ownership structures, avoiding the ambiguity caused by using the official classification. Following the principle of ultimate controlling structure, I find ultimate owners, on average, control 43.77%
of total shares in my sample, indicating a highly concentrated ownership of public firms on the SME board. Around 78% percent of the sample firms are ultimately controlled by family, with state controlling the rest 22.22%. Thus, families constitute the dominating controlling group on the SME board. Such a great different situation from Watanabe (2010)’s findings, shows the great variance of ownership structure within the Chinese stock market.
3. Literature review
A few scholars applauding for diversification believe it can better a company from several ways. However, substantial empirical analysis failed to find evidence from the real economic
life to support that. Lins and Servaes (1999) find that, cost associated with diversification outweighs the benefits. In this section, I combine the literature regarding diversification from the following perspective: reasons for diversification, company performance and diversification, and motivations to diversify---agency cost angel.
3.1. Reasons for corporate diversification
Theoretical arguments claiming that diversification is beneficial to the firm under question usually explained the logic from three perspectives: growth opportunities, internal capital market, and increased interest tax shield.
Ansoff defined diversification as one way for a company to seek future growth opportunities.
Mueller (1972) contend that firms enjoy different growth opportunities during its life cycle:
in the young and growing age, the business has plenty of profitable opportunities to reinvest earning; but in as the firm matures and such opportunities become scares, mangers will seek ways to invest accumulated profits in more promising industries to maintain the existence of the company. According to Rumelt (1974), diversification strategy enables firm to avoid the uncertainty of its future cash flows. Beatty and Zajac (1994) find that several tobacco and cigarette companies are forced to diversify to avoid the possible uncertainty during 1990s
‘No Smoking’ movement. Firms competing in declining industry, for example, in textile and mechanical industry, must diversify to survive over the long run (Wu, 2004).
Myers and Majluf (1984) illustrate that when the cost to raising external finance for positive NPV project is higher than the cost to issue shares at a bargain price, managers acting in the interest of the existing passive shareholders may choose to forgo those projects. Under this circumstance, diversified firm with a large internal capital is less likely to miss those opportunities. Gartner et al. (1994) claimed that such internal financing can also effectively reduce the asymmetric of information and make the monitoring more easily. According to Williamson (1975), manager with more firm-specific knowledge have information advantage over the outside investor. Thus, less information asymmetry ensures the excessive capital of diversified firm will be invested more efficiently.
Both Lewellen (1971) and Shleifer and Vishny (1992) argue that imperfectly correlated earning streams of different divisions of a diversified firm can constrain the volatility of cash flows. In turn, the decreased volatility gives more credentials to the firm regarding its debt capacity. Thus diversified firm can benefits from increased interest tax shield.
3.2. Company performance and diversification
Despite the above mentioned advantages that may be gained from firm diversification, with a focus on the developed market, extensive academic studies investigating the impact of diversification on company performance have found a negative link between the two items ( see, e.g., Agrawal et al., 1992; Lang and Stulz, 1994; Berger and Ofek, 1995; Lins and Servaes, 1999). According to Lang and Stulz (1994), Tobin’s q of diversified US firms was significantly smaller than that of their undiversified peers. Berger and Ofek (1995) provide evidence that compared with public firms operating in single business lines, diversified American firms are traded at discount of 13 to 15 percent. They also noticed that diversification discount appears to be smaller for related than for unrelated diversification.
Morck et al. (1990) investigate whether the internal capital market created via diversification is efficient in allocating corporate resources or not. And they find, during 1980s, acquisitions of new business decrease shareholder wealth. Rajan et al. (1997) report that diversification cause misallocation of funds, resulting decrease in firm profitability.
Several scholars also examined the value-reducing effect of diversification in emerging markets. Young (1995) studies diversification strategies of East Asian companies and find that diversification is related to lower profitability. He argues that as firms diversify into more unrelated business, they may need more time to adapt to new technology. Factors beyond firms’ control also detriment the firm from realizing the expected profitable stage of learning. With more than 1000 firms from 7 emerging markets as the sample, Lins and Seavaes (2002) finds that diversified firms are valued at 7% discount on average than the otherwise single business companies.
If, on average, corporate diversification is related to poor company performance and value erosion, why it is widely adopted by companies around the world?
Agency theory might be an explanation. It opens a different angel to understand the motivation of diversification---the cost-driven. There are extensive empirical studies examined the motivation for diversification with focus on the agency cost hypothesis. With different assumptions toward the concentration of ownership, agency problems are generally found, in dispersedly held public firms, between manager and shareholders, and in concentrated companies, between controlling shareholders and minority owners. From the
two perspectives, I will illustrate how agency problems cause the deployment of diversification strategy.
3.3. Agency problems between manager and shareholder cause corporate diversification
Berle and Mean (1932) for the first time argued that in the modern business world, shareholders who legally have ownership over companies have been separated from control of those firms. According to Jansen and Meckling (1976), agency theory proposes that both agent and principle are opportunist and selfish actors who will bear any efforts to achieve their own utility maximization. Whenever the manager owns less than 100 percent of a firm, he is likely to pursue self-interest that is inconsistent with that of owners, bearing only a fraction of cost resulting from his firm value-reducing behaviors. They define the agency cost as the sum of the monitoring and bonding cost plus any residual loss that occurs because of the necessity of the contractual relation. A few scholars claim that principle can limit the divergence between principal and agent by evaluating a manager’s performance and determine his opportunity wage, or by creating other approaches, such as incentive arrangement (see, e.g. Beatty and Zajac, 1994;Agrawal and Knoeber, 1996). However, such behavior or policies will induce cost themselves, and thus resulting inefficiency in alleviating agency problems.
Shleifer and Vishny (1997) claim that the dispersed shareholders, who own only small fraction of shares in the company also suffered from asymmetric of information, have little incentive to monitor behaviors of managers. According to Hoskisson and Turk (1990), diffuse ownership encourages free riding on monitoring the performance of managers, because potential losses accrued to atomic owners due to poor management are relatively small, thus rational minority stockholders would not contribute any efforts to supervising behaviors of managers. Meanwhile, managers hired by shareholders may dominate the board and could have significant impacts on company strategies. In such firms, agency problem between the manager and owner might be even more severe. Without efficient mechanisms to alleviate it, manager might tend to adopt strategies or policies, such as value-reducing diversification, which may enrich their own utilities at the expenses of shareholders (see, for example, Jansen, 1986; Morck et al., 1988). Generally, benefits managers enjoyed from deployment of value-reducing diversification can be classified into two categories: reduction of personal risk and gains of self-interests.
3.3.1. Reduction of personal risk
Amihud and Lev (1981) try to explain the motivation of conglomerate mergers and find that managers can decrease their largely diversifiable employment risk. The assumption of their analysis is that the labor market is not efficient, managers are not well-monitored and punishment for manager’s bad behavior is not perfectly effective. Since manager’s income from employment constitutes a major portion of the
ir total income, and it is closely related to the firm’s performance, firm’s failure to achieve predetermined performance targets can result a great loss to their revenue, an even seriously destroy their reputation and potential employment opportunities. Unlike the normal shareholders, who can efficiently lower risks by diversifying their personal portfolio in the capital market, managers cannot diversify their employment risk efficiently. The risk-averse managers might diversify their employment risky by engaging their firms in conglomerate mergers. May (1995) claim that managers will consider personal risk when making decisions that affect firm’s risk. Her empirical study shows a positive relation between ownership stakes and level of diversification.
3.3.2. Gains of self-benefits
Denis et al. (1997) argue that, although on average, diversification is associated with reduction in firm value; managers still diversify the firm under their control, because the managers’ private benefits exceed cost incurred to them. Theoretically, they enjoy various interests only at the cost to the fraction of shares stakes in the company. Firstly, both Jansen (1986) and Stulz (1990) contend that diversification can benefit managers with the power and prestige of running a larger company. And managerial compensation tends to be higher as the size of company increases (Jansen and Murphy, 1990). The experience of having run some giant diversified company add more credentials to the professional manager when they pursue better positions in the future(Gibbons and Murphy, 1992).Secondly, managers might direct a firm’s strategy in a way that increases the firm’s demands for his or her particular skill, thus making them indispensable to the firm (Shleifer and Vishny, 1989).
In a nutshell, company diversifications can benefits manager in two ways. On the one hand, diversifying the firm can effectively lower manager’s wealth risk vested in the company; on
the other hand, manager can enjoy more self-interest from a more diversified corporation than a focused one.
3.4. Agency problems between block holder and minority shareholder cause corporate diversification
3.4.1. Positive effect on corporate governance of the widespread block holders
Since 1990s, increasing number of scholars noticed the existence of ownership concentration.
La Porta et al. (1999) claim that, other than most of American public firms which are owned by many small and dispersed stockholders, corporations controlled by one or a few large shareholders are very common around the world. They collected data on ownership structure of the 20 largest companies from 27 wealthy economies, and traced ultimate controllers of those firms at 20% threshold. Their results showed that most of those firms are controlled by families or state, with relative few are widely held or controlled by financial institutions.
Claessens et al. (2000) studied the ownership structure of public firms in East Asia, and Faccio and Lang (2002) did similar analysis to Western European listed firm. Both of them found that more than 50 percent of public corporations have one ultimate owner. Berglof and Pajuste (2003) document the average shareholding of largest owner is 51.2% in Middle and Eastern European transition economies.
In diffusely held firm, misalignment of interests between manager and owners may distort managers’ choices toward value-creating corporate strategies. Theoretically, large investors can help alleviate agency problems because they have both interest in getting their money back and the power to demand it. Agrawala and Knoebera (1996) contend that introduction of more concentrated outsider (institutions and block holders) could be one of the potential mechanisms to reduce agency problem. They claim that increased monitoring by those outsiders would help improve performance by a firm’s own manager. Hill and Snell (1989) argue that larger shareholder has enough motivation and the power to collect information, thus high ownership concentration can reduce information asymmetric between principles and agent. Bennedsen and Wolfenzon (2000) contend that large owners normally have the opportunity to control the management by taking positions or having their representation in the board, or closely monitor the performance of managers. According to Boeker (1992), firms with concentrated ownership have few owners, making coordination between shareholders more feasible and at lower cost. Shleifer and Vishny (1986) argue that the
presence of large majority shareholders provides a partial solution to free-rider problem, reducing the agency cost when manager’s interest is not consistent with that of shareholders.
3.4.2. Controlling shareholder’s incentives to diversification
If the argumentation in 3.4.1 always holds, block holder and minority stockholder would focus on maximizing the firm value, and thus no conflicts of interest between them will emerge. However, according to Dyck and Zingales (2004), existence of controlling shareholder does not only confer benefits, and sometimes costs goes with it as well. Some scholars also reported that conflicts of interests between controlling shareholder and minorities happens quite often, and controlling shareholder are motivated to gain extra economic benefits at the expenses of the other shareholders in the company (see, e.g., La Porta et al., 1999; Bebchuk et al., 2000; Claessens et al., 2000; Faccio et al., 2001).
According to Claessens et al. (1999a), risk reduction incentive can explain part of ultimate controller’s motivation toward diversification. With 2000 sample companies from nine East Asia economies, they analyzed the role of ultimate ownership on corporate diversification level. Consistent with their expectation, in the less-developed economies, group-affiliated firms are more likely to diversify thank independent firm. They document larger diversification discount for the group-affiliated firms than independent firms, which can be partly explained by the internal market theory. In their later argumentation, the risk reduction and expropriation of minority interests are examined to explain some firms’ diversification discount.
3.4.2.1. Risk reduction via diversification
Ultimate controllers usually invest large proportion of their wealth in some specific company and thus not able to diversify their portfolios efficiently as individual investors do in the capital market. Diversification is a mean for block holder to reduce the excessive risks associated with the firm-specific investment. Conflicts of interest between block holders and minorities would emerge. For example, large shareholders would forgo projects with positive net-present-value (NPV) if such projects are overly risky for them to bear. And some negative NPV projects could be choose for only they are less risky. Claessens et al (1999a) contend that such diversification strategies would be adopted to reduce their risks even though they might be essentially harmful to minority shareholders’ wealth.
3.4.2.2. Expropriation of minority interest via diversification
In companies with concentrated ownership, controlling shareholders have incentives to expropriate minority shareholders. Shleifer and Vishny (1997) claim that large investors’
interests need not coincide with the interests of other investors; and large owners prefer to generate private benefits of control that are not shared by minority shareholders, especially when they gain nearly full control of the company. According to Barclay (1999), in an imperfect market, controllers can dominate the board or general shareholder meeting, passing the decision that allow the transfer of wealth from the public firm to themselves; however, they only need to take the lost to the proportion of shares they own in the firm. Johnson et al.
(2000) argue that controller can transfer resources from the firm for his own benefits through
‘tunneling’, such as self-dealing transactions and financial transactions that detriment shareholder wealth. Fan and Wong (2005) contend that, with effective control over the corporation, controlling owner might deprive the cash flows that are entitled to minority shareholder corresponding to their share investment.
Bozec and Laurin (2008) summarize the reason why expropriation of minority interest exists.
Firstly, large stock holders are able to impose their preferences however such preferences might be different from those of minorities (Shleifer and Vishny, 1997). Secondly, controlling shareholders have incentive to increase the socio-political influence via mergers and acquisitions. But suboptimal investment might accompany with such expansions, resulting in erosion of wealth of minority shareholders (Johnson et al., 2000). Third, block holder might take the top management position by themselves or have their own representatives in such positions or on the board. And they need not to be the most capable managers (Caselli and Gennaioli, 2003). Fourth, controlling shareholders have motivation to transfer money or other resource (for instance, business opportunities) from the public firm to other firms controlled by them (Johnson et al., 2000).
Corporate diversification might also be used by block holder to obtain private benefits.
Claessens et al. (1999a) show that controlling shareholder’s preference for diversification can be explained by expropriation of minority interest. According to their expropriation arguments, self-interested ultimate controllers have incentives to expropriate minorities by making investment that benefit themselves at the expense of minority shareholder. For example, controlling owner can channel corporate resources to projects that could generate more utility for them but little benefits to minorities. They also provide evidence for the claim
that expropriation incentive become stronger when there is divergence between cash-flow right and control right of ultimate controller’s.
3.4.3. Cash-flow right, separation between cash-flow right and voting right and diversification
Theoretically, ultimate controllers possessing block shareholdings are capable of expropriating minority interests. However, La Porta et al (2002) argue that, similar to incentive effect of managerial ownership emphasized by Jansen and Meckling (1976), ultimate controller with big shares of equity would avoid shouldering the large proportion of cost resulting from their expropriation behaviors. Their findings suggest that equity or cash-flow ownership can serve as a moderating factor for block holder’s incentive to expropriate outside investors. Thus, as the ownership stake of ultimate controller’s increases, they are less likely to adopt value-reducing diversification.
However, in situations in which ultimate controllers control the public firms via pyramid structure, they realize control with limited cash investment. There is divergence between cash-flow right and voting right of ultimate controllers. Friedman et al. (2003) argue that higher voting right can enhance controller’s incentive to expropriate other shareholders’
interest, but higher cash-flow right can offset it. Claessens et al. (1999a) contend that the incentive effects of equity holding would be impaired. The divergence provides ultimate owns more incentive to diversify to reap private benefit, because they can obtain private benefits but bear little of the consequences of reduction in firm value. They document larger divergence between control and cash-flow right is associated with more diversification.
Thus, controlling owners can exert strong influence on managers’ decision-making process, with their voting rights or their representation in the management team or on the board.
Diversification could be adopted by controlling shareholders to reduce their less-diversified risks and/or expropriate minorities, resulting agency cost. So, in companies with concentrated ownership, agency problems not only exist between managers and stockholder, but also emerge between controlling shareholder and minority investors.
3.5. Owner identity and diversification
Owner can take numerous identities such as government, institutional investors, individual, family, management, employees and so on. By assuming the large shareholders have
identical objective and motivations, many researchers explained why firms diversify with agency theory. However, a few studies show that owner identity has significant implications for corporate strategy (see, for example, Miller et al., 2010; Hautz et al., 2011).According to Hautz et al. (2011), shareholders differ mainly on three dimensions: motivation, capabilities and control. Differences in the three dimensions are attributed to the variation of company’s strategy toward diversification.
3.5.1. Family controlled firm and diversification
Anderson and Reeb (2003) find, between 1993 and 1999, founding family owners represent an important class of controlling block holders among the S&P 500 industrial companies.
According to Casson (1999) and Chami (1999), public firms founded by family owners are viewed as asset that would be passed to other family members or offspring, thus survival of the firm is extremely important. The nature of family holdings as of committed, long-term and concentrated, and desire for survival strengthen family owners’ incentive to mitigate firm risk level via corporate diversification. Faccio and Stolin (2006) record corporate diversification can reduce volatility in earnings which can increase the chance of firm survival. Miller et al. (2010) document that family-owned firms tend to reduce their undiversified wealth portfolio via diversified acquisition. Similarly, Hautz et al. (2011) analyzes family owner’s risk aversion preference and suggests that level product diversification is positively associated with family ownership.
However, a steward-perspective argues that family owners may function as the driving factors for company value-maximizing. The substantial negative effects on shareholder value of corporate diversification may lead the family owners, who committed a large, concentrated equity position in the company, to forgo such strategies, because they would suffer severe penalties for failure (Anderson and Reeb, 2003). Stein (1988) demonstrates that shareholders with long investment horizons can mitigate managers’ incentive for myopic investment decisions. He found that founding families would avoid diversification deliberately if the family lack of the firm-specific knowledge of an acquisition or new industry. Diversification beyond the family firms’ knowledge might increase the uncertainty, thus family ownership may lead to less corporate diversification.
3.5.2. Financial-institutional controlled firm and diversification
According to David et al. (1998), financial institutions are a diverse set of organizations, including bank, public and private pension funds, mutual funds and insurance companies.
Compared with other owner identities, especially family owner, financial institutions are expected to care more about the economic effectiveness (Thomsen and Pedersen, 2000).
David et al. (1998) contend that financial investors essentially investor ‘other people’s money’, and thus bearing the legal obligation to protect their investment from value erosion.
Hautz et al. (2011) argue that financial institutions’ nature as investor determined that they are more diversified than the general investors, so they have less need to reduce risks associated with certain investment via diversifying that investment target. What’s more, Jansen (1986) and Pound (1988) believes that financial institutions possessing the analytical skills sand information advantages, which can effectively make monitoring of managers more easier. Thus several previous studies record a negative relation between financial institutional ownership and level of diversification. Within the Indian contexts, Ramaswamy et al. (2002) find that ownership by financial institutions and unrelated diversification. They found that Indian banks tend to support managers, even though sometimes, corporate strategies implemented by managers can be detrimental to shareholder wealth. However, except banks, they document financial institutional shareholdings are negatively related to level of unrelated diversification among Indian industrial firms. Hautz et al. (2011) by analyzing the relation between ownership of different owner identities and corporate diversification, reveal that financial institutional holdings are negatively associated with product diversification.
3.5.3. State controlled firm and diversification
According to Shleifer and Vishny (1984), the inefficiency of state-owned public firms is the result of political pressures from politician who control them. In their later study, Shleifer and Vishny (1994) contend that, different from families, state ownership is primarily driven by political and social goals. Boycko et al. (1995) explain that social benefits are important for it can affect politician’s pursuit for personal election. As a result, government tends to favor low output prices, higher employment and positive externalities, which are found to be related to weak performance and value erosion in firm value (Thomson and Pederson, 2003) Andrews and Dowling (1998) claim that the arm’s length nature of government ownership provides state-owned institutions less incentive to closely track the performance of their
investments. Zhao (2010) claim that reduction of diversification level of the Chinese business groups will lead to a reduction in head count.
4. Previous findings on corporate diversification in China
4.1. Corporate diversification in China
Ever since late 1980s, the Chinese central government encourages the integration of giant companies via merger and acquisitions of small and low-efficient SOEs. As the result, several conglomerates are established and it gradually becomes are popular practice for Chinese firms to grow rapidly. Diversification becomes common among the Chinese companies.
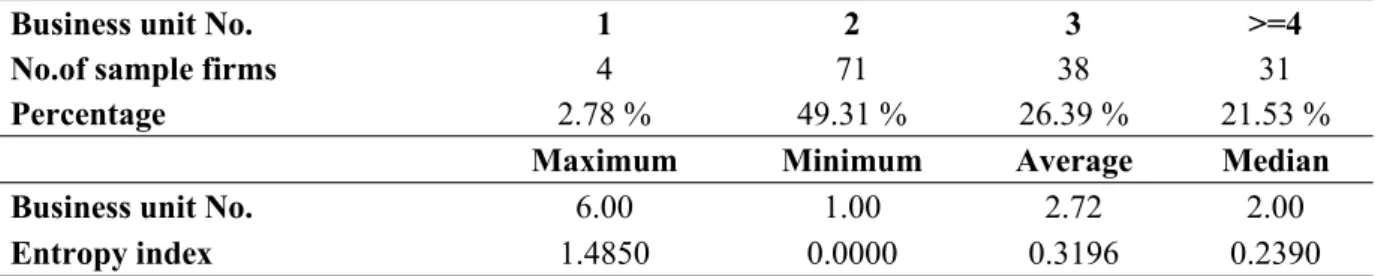
Wu (2004) point out that, competing in such an under-developed and changing environment, Chinese firms diversify to survive or defend their market position. Fan et al. (2007a) compared the business segment number of Chinese firms with those of other firms in nine economies from 2001 to 2005. They find Chinese firms compete in 2.81 business units on average in 2005, and are the most diversified in their sample. With the same Chinese sample firms, Fan et al. (2007b) find that more than 70% of those firms are diversified.
4.2. Firm performance and corporate diversification in China
Although China has experienced rapid growth during the past three decades, the economy is still on the transition to a market-oriented one. According to Khanna and Palepu (1997), China is under-developed in product market, capital market and labor market when compared to the developed countries. McMillan (1996) also points out that capital market discipline is weak and capital allocation was seriously distorted in China. Wu (2004) argue that in such institutional environment that has high risks and uncertainties, diversification can be an alternative to substitute the absence of markets. Firms are able to benefit from internal capital market created via diversification, since it’s an efficient way to reduce the high transaction cost from the external market. Based on this explanation, some scholars find a positive relationship between firm diversification and firm performance within the context of China.
Su (2005) study 1026 corporations that went to public before 1999 and document a positive relation between the diversification level and company performance. His study shows that
diversified firms are related to higher market-to-book value, Tobin’s q and excessive value.
He argues that the changing macroeconomic policies, poor credit system and under-developed regulation systems cause inefficiency in allocation of resources by external market, pushing up the cost if a firm only operates in single business. Internal market can effectively resolve such problems, reduce the transaction cost and relieve the operating risk faced by single-business firms. Lu and Yao (2006) provide evidence that group control mechanism via pyramid ownership structure enable the ultimate controller to expropriate minorities or tunnel corporate resources for its own interest. They find that, in less diversified affiliated companies, cash flow right is positive related to company performance and in the general group control right is negatively related to corporate performance. Chen (2007) document diversification premium with balanced-panel data constructed from a sample of Chinese stock market. She also finds that diversification premium in public firms ultimately controlled by central government are much higher than those controlled by local government.
However, no significant diversification discount or premium was found among non-state controlled firms.
On the contrary, some Chinese scholars found the phenomenon of diversification discount.
Zhang et al. (2005) analyzed 1032 non-financial Chinese listed firms, and found that diversified firms tend to have lower earnings per shares and are much more likely to experience financial distress. Li and Zhu (2006) show that valuation of firms acquiring unrelated companies would decrease by 6.5% to 9.6% within 1 to 3 years. Zhang et al. (2002) evaluated the performance of 72 diversified Chinese companies, and find the negative association between diversification level and company performance.
4.3. Owner identity, shareholding concentration and corporate diversification
Studies on the relations between ownership structure and diversification level are relatively limited. Yu et al. (2005) find U-shaped relation between diversification levels and management shareholdings of Chinese firms. The turning point of managerial ownership is 52.94 percent. Delios and Wu (2005) investigate how the concentration of legal person shareholdings influences firm’s strategy and performance. They document legal person ownership at high level of concentration can reduce firm diversification and increase performance. They explained that, the less developed external capital market, short of legal protection and less informativeness make diversification a profitable strategy rather than value-reducing. Rao et al. (2004) document that the relation between shareholding of the
largest owner and corporate diversification is an inverse U-shape. Similar links are also found between state ownership and diversification, and between legal person shares and level of diversification. They also report that state-controlled firms are more diversified than non-state controlled corporation.
Liu and Sun (2005) examined the impact of ultimate controllers’ identity on Chinese listed firms’ performance. They argue that downstream firms controlled by state via pyramid structure are least efficient when compared with firms controlled by other owner identities.
Zhang et al. (2005) recorded a U-shape relation between diversification level and state shares in state controlled public firms, and no relation is found in non-state controlled companies.
Zhao (2010) shows that compared to other ownership structures, government-owned business groups tend to be more diversified, and ownership concentration is related to lower levels of diversification. Zhang and Li (2006) demonstrate that state-owned firms are more likely to implement value-reducing diversification strategies. Dun and Xue (2007) found that diversification strategy was implemented by the ultimate controllers of Chinese private firm to expropriate the interests of other shareholders. Their study also showed that the diversification level increases as the divergence between voting rights and cash-flow rights becomes bigger.
5. Research hypothesis
5.1. Management ownership and level of diversification
Theoretical arguments suggest that, on average, diversification is associated with reduction in firm value. If so, why so many firms remain diversified? Agency theory and convergence-of-interest hypothesis might provide part of the reasons. On the one hand, based on the assumption of widely dispersed ownership, the agency problem between managers and shareholders could explain some diversification. Berle and Mean (1932) for the first time argued that in the modern business world, shareholders who legally have ownership over companies have been separated from control of those firms. The difficulties in coordinating behaviors among the dispersed shareholders and other costs that could be induced from effective monitoring of management behaviors left the firm actually under the control of managers. Misalignment of interests between managers and shareholders provides managers