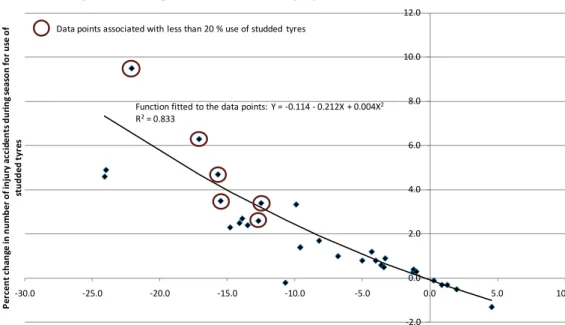
The effects on accidents of a reduced use of studded tires in five Norwegian cities have been evaluated. Relation between percentage change in studded tire use and percentage change in injury crashes - model estimates.
Background
Recent studies of safety aspects of studded tyres
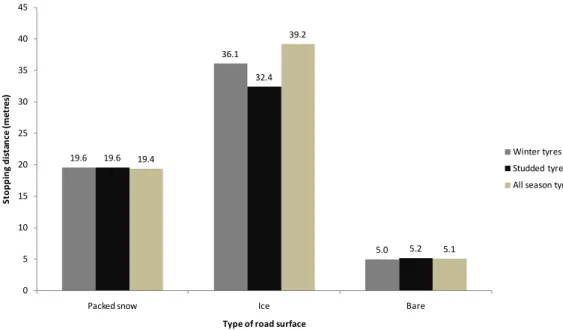
The safety effects of reducing the use of studded tires to 50% or 20% were evaluated. On icy roads, a 50% reduction in the use of studded tires was associated with a 9% increase in crashes.
Research problem
Replication of earlier study
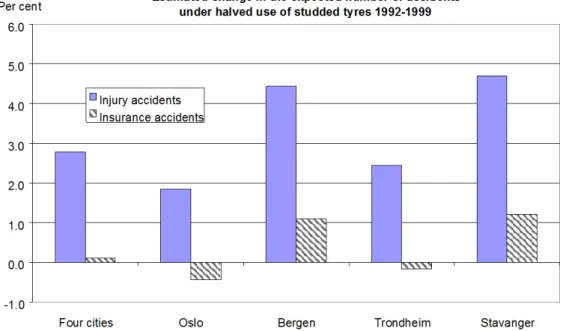
As can be seen, halving the use of studded tires was estimated to lead to a small increase in the number of injury crashes in all four cities. The estimated effects on insurance-reported accidents (more than 90% of which are property damage-only accidents) were less consistent but significantly smaller than the effects on injury accidents.
Sample of cities and variables included in the study
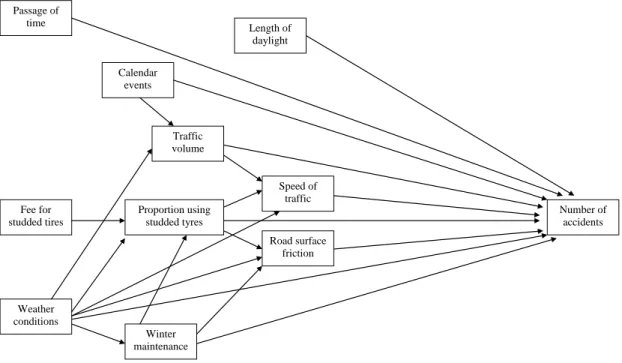
It was therefore not possible to estimate the use of studded tires in the last months of 2009. Confounding variables that describe important factors that can affect road safety in addition to the use of studded tires. The independent variable of main interest in the study is the use of studded tires.
It is one of the variables through which the use of studded tires affects the number of accidents.
Sources of data
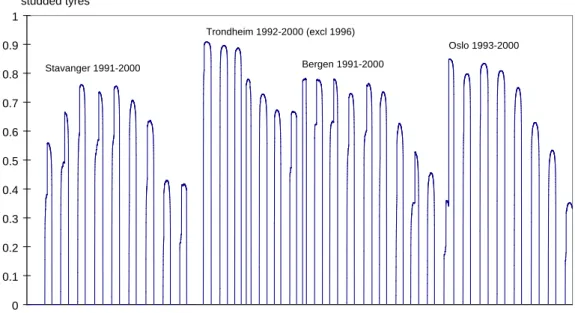
Estimation of the use of studded tyres
If there is no snow the following week, usage increases to 50% of the peak level. If no snow falls in the first week after November 1st, studded tire usage will increase to 50% of the peak level for that week. If there is no snow in the first week after Easter, the use of studded tires drops linearly from 100% of the peak level to 0.
If snow falls in the first week after Easter, the removal of studded tires is pushed back by a week.
Variable transformations
The rationale for this assumption is that there are probably very few car owners who change tires throughout the season, once studded tires are installed. If it snows again the following week, usage increases to 90% of the peak level. Since March 24 is close to the end of the season, it was assumed that no one had put on stud bands.
The variable will then assume the value zero when the percentage use of studded tires is zero.
Treatment of missing data
Rainfall is normally recorded around 7am and refers to the last 24 hours. This assumption is reasonable because only a small fraction of all traffic occurs between midnight and 7 am. It was deemed impossible for the temperature to exceed freezing in the months of June, July and August.
In November 2002, precipitation in the form of both rain and snow was recorded for nine days.
Approach to accident modelling
It was discovered that between 2004 and 2008 during the month of November in Drammen, zero was exceeded for between 5 and 13 days. When dual-state models were first introduced, it was in the form of zero-inflated models (Shankar et al. 1997). In the analyzes presented in this report, the number of accidents is the dependent variable.
The reason for using these variables is the same as explained in the report published in 2000: "Through this specification we aim to avoid or minimize omitted variable bias due to the possible correlation between the use of bumper tires and any variable what a clear seasonal pattern of variation.
Models fitted
The model explains the variation in the average speed of traffic, not the speed choice made by each individual driver. However, the choices made by each individual driver will be reflected in the average speed of the traffic to the extent that all drivers adapt their behavior in the same way. The most important independent variable in this model was the existence of a charge for the use of studded tires.
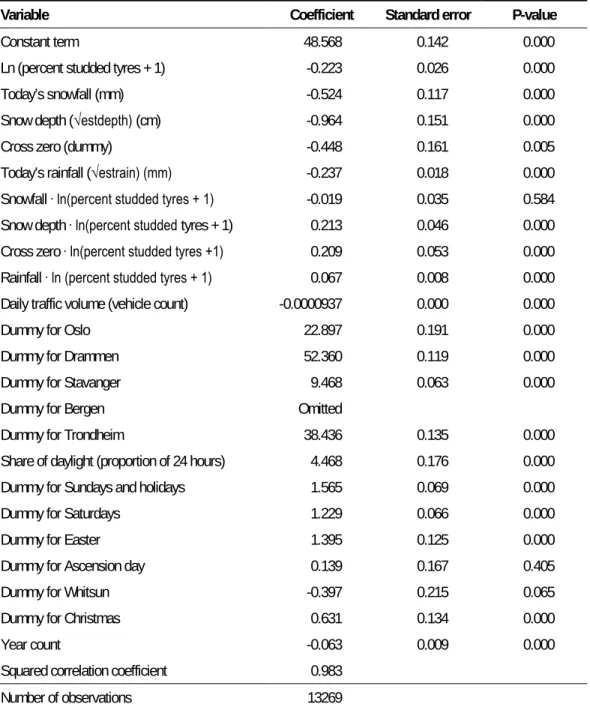
A linear regression model was fitted with the percentage of spiked tire use as the dependent variable.
Estimating effects on accidents by means of the sample enumeration
What would have been the number of accidents if the use of stud tires had remained unchanged at the level observed in 2002 in the years after 2002. Substituting the actual use of stud tires each year by the use in 2002, the number of accidents was estimated to be 7146.3. Therefore, if the reduction in stud tire use had not occurred, there would have been slightly fewer accidents than the number estimated given the reduction in stud tire use.
The statistical significance of the estimated differences in the number of accidents was assessed by applying the adjusted standard error.
Description of the data
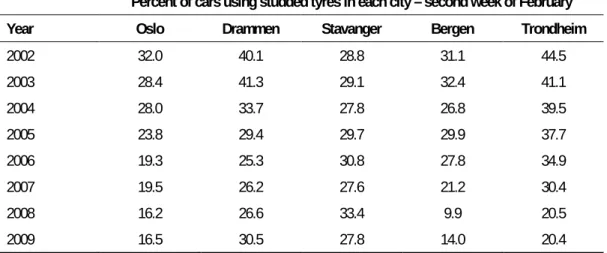
- Use of studded tyres
- Number of accidents
- Traffic volume
- Temperature
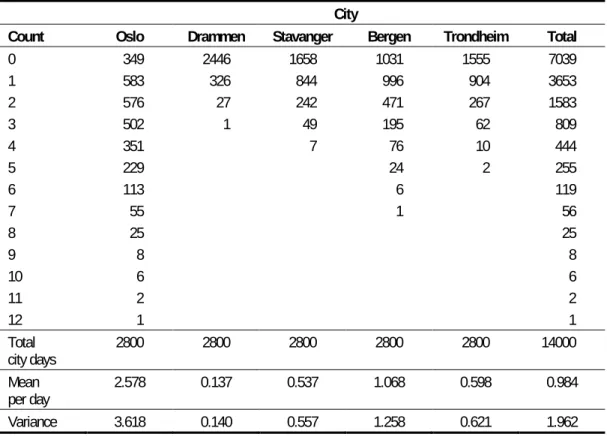
The number of injury accidents in each city and in total is presented in Table 3. For the full sample, the mean number of injury accidents per day is 0.984 and the variance is 1.962. This shows that 49.8% of the change in the number of accidents in the city per day is systematic, 50.2% is random.
On average, the number of accidents reported by insurance is about 15 times greater than the number of accidents with injuries.

Exploratory analyses
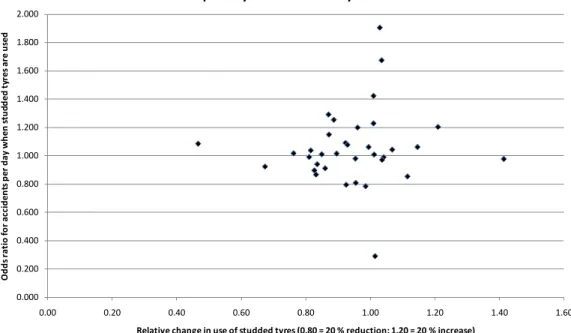
Baga gara waancaa addunyaa FIFA bara 2017 100000000000000000 baga nagaan dhuftan hunda keessan arguuf baay'een gammada Maaloo kolfaa 2 kolfaa hiriyyaa isheef baga nagaan dhufte kan bara 2017 waancaa addunyaa 2016 2016 01 01 10101 101010101010101010101010101010101010101010101010101010101010101010101010101010101010101010101010101010101010101010101010101. giddu galeessaan lakkoofsi balaa guyyaatti Oslo keessatti bara 2002 guyyoota itti fayyadamni gommaa stud dhibbeentaa zeeroo ol ture 2,196 ture. Walumaagalatti tilmaamni 35 reeshiyoo odds fi jijjiirama walgitu itti fayyadama gommaa stud (magaalota 5 dachaa jijjiirama 7 waggaa tokko irraa gara isa itti aanutti) qophaa’eera. Hariiroo jijjiirama itti fayyadama harness fi odds ratio balaa miidhaan guyyaa tokkotti yeroo harness fayyadaman gidduu jiru.
A weighted regression analysis found no association between changes in the use of studded tires and changes in the average number of crashes on days when studded tires are used.
Effects on accidents of reduced use of studded tyres
- Negative binomial regression model
- Estimated effect on accidents of changes in use of studded tyres
- Dose-response pattern in changes in the number of injury accidents
- Changes in the distribution of accidents between different types of
Estimated changes in the number of accidents during the season for the use of studded tires by city - all years. When there is a reduction in the use of studded tires, the number of accidents will increase. When there is an increase in the use of studded tires, the number of accidents will decrease.
The greater the changes in the use of studded tires, the greater the changes in the number of accidents.

Behavioural adaptation to adverse weather
We can see that less use of studded tires is associated with a slightly higher average speed. Effect of studded tire percentage, amount of snow and depth of snow on average speed (km/h) - data for Oslo. Still, it's not entirely improbable that the average traffic speed may increase slightly if fewer cars use studded tires.
The use of studded tires greatly contributes to the spread of dirty splash water on wet road surfaces.
Effects on accidents of daylight
It should also not be forgotten that the studies cited above are both quite old, and the differences between studded tires and non-studded winter tires have become smaller over time. The noise produced by studded tires can enhance the impression of speed and may cause drivers to slow down to keep the noise less annoying, at least when driving on bare road surfaces. However, the additional effect of snow depth on speed is significantly smaller than the effect of falling snow.
Speed is reduced when on the ground now, even when it's not snowing.
Effects on accidents of weather
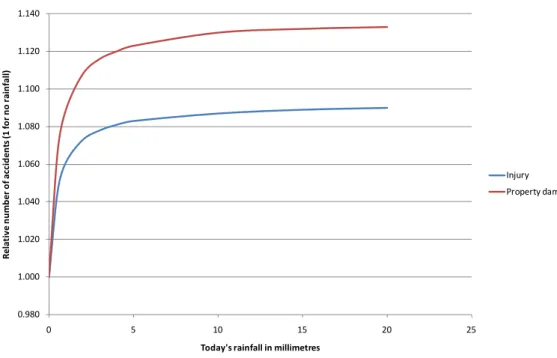
Snow increases the number of injury accidents by up to about 30% and the number of property damage accidents by about 40. Precipitation in the form of rain is associated with lower speed, but the behavioral adjustment is not sufficient to prevent the number of accidents from increasing. Rain has a small effect on the number of injury accidents, but is found to have a somewhat larger effect on the number of property damage accidents.
The relationship between snow depth and the number of accidents is shown in Figure 18.
Effects on accidents of calendar events
Factors influencing the use of studded tyres
Discussion of findings
Adverse selection of drivers
When the use of studded tires is reduced to 15 percent, the respective crash rates can be 2.4 and 1.0. Simple model estimates show that if the distribution of crash rates in the population of drivers is stable, the fact that some drivers stop using studded tires will not be associated with changes in the total number of crashes. A change in the number of accidents would only occur if drivers who stop using studded tires experience an increase in the accident rate.
But in that case, the basic assumption of no difference in accident rates between different types of tires would be wrong, and it would be correct to say that reduced use of studded tires leads to an increase in the number of accidents.
Studs wearing down snow or ice
So one can imagine that when 30 percent of drivers use seat belts, those who do have a relative crash rate of about 1.5 when the crash rate for drivers who don't use seat belts is set at 1.0. Managers maintain their level of risk but simply move from one group to another. Based on this reasoning, it is concluded that the mere fact that drivers self-select into one group using studded tires and one group not doing so will not in itself cause changes in the number of accidents over time, unless driver accident rates affected when managers change from one group to another.
Other things being equal, crash rates can only be affected if one type of tire is safer than another—in which case causal inference applies—or if road conditions worsen due to less use of studded tires, which affects the crash rates of all drivers. regardless of the type of tires they use.
Winter maintenance of roads
The growth in expenditure on road maintenance far outstrips the overall growth in expenditure on municipal employee salaries in all cities except Trondheim. Thus, all cities except Trondheim appear to have spent more in real terms on the operation and maintenance of municipal roads in 2009 than in 2002. The increase in road maintenance levels may have partially offset the impact of reduced use of studded tires on accidents. , but the data available for this study do not allow an assessment of this effect.
However, in all cities that had a lower use of studded tires in all or most years after 2002 than in 2002 (ie in all cities except Stavanger), the number of injury accidents increased.
Conclusions
The use of stud bands is reduced when a tax is introduced for the use of stud bands. The crash effects of seat belts and laws prohibiting their use: a meta-analysis of evaluation studies. Investigate the effects of low sample mean values and small sample size on the estimation of the fixed distribution parameter.
The effects of studded tires on passenger car fatalities and the benefits of electronic stability control (ESC) during driving in Swedish winters.