Reduce marine plastics and plastic pollution in Latin American and Caribbean cities through a circular economy approach
Part I: Project Information GEF ID
10547 Project Type FSP
Type of Trust Fund GET
CBIT/NGI CBIT No NGI No Project Title
Reduce marine plastics and plastic pollution in Latin American and Caribbean cities through a circular economy approach
Countries
Regional, Colombia, Jamaica, Panama Agency(ies)
UNEP
Other Executing Partner(s) Cartagena Convention Secretariat Executing Partner Type Others
GEF Focal Area Multi Focal Area Taxonomy
International Waters, Focal Areas, Deploy innovative financial instruments, Influencing models, Gender Equality, Adaptive management, Learning, Theory of change, Knowledge Exchange, Capacity, Knowledge and Research, Workshop, Knowledge Generation, Large Marine Ecosystems, SIDS : Small Island Dev States, Pollution, Persistent toxic substances, Plastics, Coastal, Chemicals and Waste, Emissions, Persistent Organic Pollutants, Uninentional Persistent Organic Pollutants, New Persistent Organic Pollutants, Green Chemistry, Waste Management, Hazardous Waste Management, Best Available Technology / Best Environmental Practices, Transform policy and regulatory environments, Demonstrate innovative approache, Convene multi- stakeholder alliances, Strengthen institutional capacity and decision-making, Stakeholders, Local
Communities, Civil Society, Academia, Non-Governmental Organization, Community Based Organization, Private Sector, Individuals/Entrepreneurs, SMEs, Financial intermediaries and market facilitators, Large corporations, Communications, Public Campaigns, Behavior change, Education, Awareness Raising, Type of Engagement, Information Dissemination, Consultation, Participation, Partnership, Gender results areas, Capacity Development, Participation and leadership, Knowledge Generation and Exchange, Gender Mainstreaming, Sex-disaggregated indicators, Beneficiaries, Indicators to measure change, Peer-to-Peer, South-South, Field Visit, Conference, Enabling Activities, Innovation
Rio Markers
Climate Change Mitigation Climate Change Mitigation 1 Climate Change Adaptation Climate Change Adaptation 0
Submission Date 12/3/2021
Expected Implementation Start 7/1/2022
Expected Completion Date 6/30/2026
Duration 48In Months Agency Fee($) 665,000.00
A. FOCAL/NON-FOCAL AREA ELEMENTS Objectives/Programs Focal Area
Outcomes Trust
Fund GEF
Amount($) Co-Fin Amount($)
IW-1-3 Strengthen blue
economy opportunities by addressing pollution reduction in marine environments
GET 3,500,000.00 18,203,874.00
CCM-1-1 Strengthen the sound
management of
industrial chemicals and their waste through better control, and reduction and/or elimination
GET 3,500,000.00 18,203,874.00
Total Project Cost($) 7,000,000.00 36,407,748.00
B. Project description summary
Project Objective
Reducing regional marine plastics and plastic pollution by facilitating governments and businesses at the city-level, to accelerate the transition to a circular economy thereby responding to national, regional and global marine litter and plastics-related action plans, resolutions and commitments.
Project Componen t
Financin
g Type Expected
Outcomes Expected
Outputs Trus
t Fun d
GEF Project Financing($
)
Confirmed Co- Financing($)
1. City Led Promotion of Circular Economy Policies to Reduce Marine Plastics and Plastic Pollution in Targeted Cities
Technical
Assistance Outcome 1 Circular economy policies developed or adopted by city- level government s to reduce marine plastics and plastic pollution in targeted cities
Output 1.1 Policy action plans developed by municipalities to promote circular economy approaches for plastics Output 1.2 Targeted policy interventions carried out to improve circularity Output 1.3 Implementatio n plans for financial instruments developed to facilitate responsible plastics management
GET 1,920,000.0
0 4,925,789.70
Project Componen t
Financin g Type
Expected Outcomes
Expected Outputs
Trus t Fun d
GEF Project Financing($
)
Confirmed Co- Financing($)
2. Private Sector Led Promotion of Circular Economy Actions to Reduce Marine Plastics and Plastic Pollution in Targeted Cities
Technical
Assistance Outcome 2 Circular economy innovations and practices adopted by the private sector to reduce marine plastics and plastic pollution in targeted cities
Output 2.1 Approaches developed and tested to facilitate more circular design, production, and
consumption of plastics
Output 2.2 Approaches developed and tested to improve collection and recycling of plastic waste Output 2.3 Industry roundtable on plastic circular economy established and roundtable meetings organized
GET 2,355,000.0 0
16,186,842.0 0
3. Inter-City Network on Marine Plastics and Plastic Circular Economy
Technical Assistance
Outcome 3 Increased capacity and cooperation among LAC cities through the LAC Inter- city Network on marine plastics and plastic circular economy
Output 3.1 Inter-city network operationalized Output 3.2 Inter-city network expanded with more
participating cities
GET 814,584.00 3,742,021.50
Project Componen t
Financin g Type
Expected Outcomes
Expected Outputs
Trus t Fun d
GEF Project Financing($
)
Confirmed Co- Financing($)
4. Capacity development and
knowledge management
Technical
Assistance Outcome 4 Improved regional awareness and capacity in applying circular economy approaches to reduce marine plastics and plastic pollution
Output 4.1 Information, Education and Communicatio n (IEC) strategy for the project developed and implemented using IW:
LEARN platform , GGKP and GPML platforms Output 4.2 Targeted capacity building activities conducted Output 4.3 Long-term monitoring conducted by cities on the implementatio n of circular economy approaches and associated reduction in plastic pollution
GET 1,269,583.0 0
10,028,280.0 0
M&E Technical
Assistance GET 307,500.00 800,538.88
Sub Total ($) 6,666,667.0
0 35,683,472.0 8
Project Management Cost (PMC)
Project Management Cost (PMC)
GET 333,333.00 724,275.92
Sub Total($) 333,333.00 724,275.92
Total Project Cost($) 7,000,000.00 36,407,748.00
C. Sources of Co-financing for the Project by name and by type Sources of
Co-financing Name of Co-financier Type of Co- financing
Investment
Mobilized Amount($)
GEF Agency UNEP In-kind Recurrent
expenditures
3,163,860.00
GEF Agency UNEP Grant Investment
mobilized 8,546,201.00
Recipient Country Government
Mayor of Cartagena In-kind Recurrent
expenditures 1,643,840.00
Recipient Country Government
Mayor of Barranquilla In-kind Recurrent
expenditures 262,734.00
Recipient Country Government
EPA Cartagena (urban environmental authority)
In-kind Recurrent
expenditures
1,151,405.00
Recipient Country Government
SENA Regional Bolivar In-kind Recurrent expenditures
12,900.00
Private Sector XICLO In-kind Recurrent
expenditures 1,400,000.00
Private Sector XICLO Grant Investment
mobilized 2,100,000.00
Private Sector Trashforma In-kind Recurrent
expenditures
400,000.00
Private Sector Trashforma Grant Investment
mobilized 810,000.00
Private Sector Bliss Earth Recycling
Panam? In-kind Recurrent
expenditures
570,000.00
Private Sector Bliss Earth Recycling
Panam? Grant Investment
mobilized 500,000.00
Sources of Co-financing
Name of Co-financier Type of Co- financing
Investment Mobilized
Amount($)
Private Sector Algramo In-kind Recurrent
expenditures
640,730.00
Private Sector Algramo Grant Investment
mobilized 2,475,000.00
Private Sector Pepsi Cola Grant Investment
mobilized
1,000.00
Private Sector LeafSync In-kind Recurrent
expenditures 268,000.00
Private Sector LeafSync Grant Investment
mobilized 100,000.00
Other Alliance to End Plastic Waste
Grant Investment
mobilized
4,100,000.00
Other GPAP Grant Investment
mobilized 835,000.00
Other GPAP In-kind Recurrent
expenditures
83,500.00
Other Acoplasticos Grant Investment
mobilized 16,890.00
Other CEMPRE In-kind Recurrent
expenditures 34,014.00
Other CEMPRE Grant Investment
mobilized
114,703.00
Other EcoComputo In-kind Recurrent
expenditures 90,000.00
Other EcoComputo Grant Investment
mobilized
30,000.00
Other INVEMAR In-kind Recurrent
expenditures 605,603.00
Sources of Co-financing
Name of Co-financier Type of Co- financing
Investment Mobilized
Amount($)
Other INVEMAR Grant Investment
mobilized
200,000.00
Other Fundacion de Accion
Social por Panama Grant Investment
mobilized 105,368.00
Other Botellas de amor In-kind Recurrent
expenditures
138,500.00
Other Botellas de amor Grant Investment
mobilized 138,500.00
Recipient Country Government
Waste Agency of Panama (Autoridad de Aseo)
In-kind Recurrent
expenditures 4,000,000.00
Other Recycling Partners
Jamaica In-kind Recurrent
expenditures
560,000.00
Other Recycling Partners
Jamaica Grant Investment
mobilized 1,310,000.00
Total Co-Financing($) 36,407,748.00 Describe how any "Investment Mobilized" was identified
Ecocomputo will improve material sorting, treatment, recovery and the environmental sound disposal of plastic in electronics. It will also establish conditions conducive to supporting collection and recycling in order to increase recovery rates of plastic in electronic equipment, specifically those containing POPs (HBCS, PBDE, SCCP) (including informatics, entertaining, office equipment, electronic cables, etc.).
GPAP will invest in the development and deployment of a modelling tool for plastic flow assessment and scenario building; the development and utilization of the UpLink platform; the development of a Reuse portal and scaling reuse work; financing innovation work by the dissemination of GPAP and its partners?
insights; and support for convening and capacity building across 6 cities and the wider network of Latin American cities. Acoplasticos? investment mobilized includes training, information collection, statistical analysis, and attendance of the project?s closing session to strengthen ties with businesses. Fundacion de Accion Social por Panama will further implement its recovery programme of recyclable solid waste and invest in the transformation of thermoplastics waste (mainly PET, HDPE and PP). Recycling partners of Jamaica will fund the mobilization infrastructure by parish and transportation and logistical requirements to support a deposit refund system for plastics (PET 1 and HDPE 2) in Jamaica. It will also fund the necessary capacity building and educational activities needed to support this system. They will also fund
the development of marketing and public education efforts to spread awareness among general public and schools in Jamaica on the why, how, where and what to recycle. XICLO will invest in the development and implementation of the ?Pilot Project in Bogota City?, the development and implementation of XICLO system service in all the restaurants of Grupo Takami, the expansion of XICLO system service to other food & drink service business in Bogota City, and the expansion of XICLO system services to other cities in Colombia, (including Cartagena and Barranquilla). INVEMAR will contribute through different work that is being developed on marine litter, plastics and microplastics, in coordination with environmental authorities, the Ministry of Environment and Sustainable Development and other sources of funding. This work includes monitoring of marine litter pollution; awareness raising; assessing the impact of macro and microplastics in mangroves, beaches and other coastal ecosystems; capacity building activities; and prevention and protection strategies for marine litter. Algramo will set up innovative refill solutions that transform the consumer industry, reduce waste and benefit consumers in Colombian cities. It will also share key findings on supply chain optimization and consumer behaviour change so government and other key stakeholders possess key knowledge to help make refill systems successful and scalable across Latin America. Botellas de amor will develop a recycling plant and set-up collection points in Panama. Leafsinc will finance the opening of recycling centers; recycling projects in institutions companies and residentials;
and the education in the area of recycling materials with the scope of reducing plastic waste though their initiatives in Panama. Pepsi will contribute to its beach clean-up and recycling initiative where employees of the organization volunteer the time and efforts to assist with these initiatives in Jamaica. Bliss Earth Recycling will contribute to the development, implementation and creation of products from discarded plastics. CEMPRE will use its grant co-financing for technical, operational and formalization strengthening of the recyclers' organization; implementation of their DONDE RECICLO app; and awareness and
education, with the message of separation at the source and dissemination of the DONDE RECICLO app.
UNEP has mobilized investment through the Cartagena Convention Secretariat, the Resources and Markets Branch (Economy Division), the Marine and Freshwater Branch (Ecosystems Division), and through the Regional Office for Latin America and the Caribbean. This investment includes different projects (e.g., Prevention of Marine Litter in the Caribbean Sea project, NFL 2020 Plastic Hotspotting project,
Dominican Republic under IKI tourism project and NFL/SIDA 2021 dumpsite project), capacity building, the implementation of Extended Producer Responsibility, an LCA study, the GPML platform, and a Plastics flow model focusing on the Wider Caribbean Sea region, among others. Trashforma will continue their recycling services and routes with their existing clients and future ones; participate and sponsor cultural and educational events and initiatives promoting recycling and sustainable solutions to plastic; and develop a new project of making plastic wood and products. The Alliance to End Plastic Waste will invest in two projects. The GIRO Rethinking Recycling project, is implemented by Delterra in Olavarria, Argentina and includes the development of a materials recovery facility, increasing the efficiency of collection through community engagement and source segregation, and identification of economic solutions for recyclables. The project with Instituto Recicleiros in Brazil will include the development of community-based plastic waste aggregation, sorting, and recycling systems across 60 mid-sized cities in Brazil that will be supported by community education activities to promote participation and proper segregation of waste.
D. Trust Fund Resources Requested by Agency(ies), Country(ies), Focal Area and the Programming of Funds Agenc
y Trust
Fund Country Focal
Area Programmin
g of Funds Amount($) Fee($)
UNEP GET Colombia International
Waters
International Waters
1,000,000 95,000
UNEP GET Panama International
Waters International
Waters 1,000,000 95,000
UNEP GET Jamaica International
Waters International Waters
1,000,000 95,000
UNEP GET Colombia Chemicals
and Waste POPs 1,000,000 95,000
UNEP GET Panama Chemicals
and Waste POPs 1,000,000 95,000
UNEP GET Jamaica Chemicals
and Waste
POPs 1,000,000 95,000
UNEP GET Regional International
Waters International
Waters 500,000 47,500
UNEP GET Regional Chemicals
and Waste POPs 500,000 47,500
Total Grant Resources($) 7,000,000.00 665,000.00
E. Non Grant Instrument
NON-GRANT INSTRUMENT at CEO Endorsement
Includes Non grant instruments? No Includes reflow to GEF? No
F. Project Preparation Grant (PPG) PPG Required true
PPG Amount ($) 200,000
PPG Agency Fee ($) 19,000
Agenc
y Trust
Fund Country Focal
Area Programmin
g of Funds Amount($) Fee($)
UNEP GET Regional International
Waters International
Waters 100,000 9,500
UNEP GET Regional Chemicals
and Waste
POPs 100,000 9,500
Total Project Costs($) 200,000.00 19,000.00
Core Indicators
Indicator 5 Area of marine habitat under improved practices to benefit biodiversity (excluding protected areas)
Ha (Expected at PIF)
Ha (Expected at CEO
Endorsement) Ha (Achieved at
MTR) Ha (Achieved at
TE)
Indicator 5.1 Number of fisheries that meet national or international third party certification that incorporates biodiversity considerations
Number
(Expected at PIF)
Number
(Expected at CEO Endorsement)
Number (Achieved at MTR)
Number
(Achieved at TE) Type/name of the third-party certification
Indicator 5.2 Number of Large Marine Ecosystems (LMEs) with reduced pollutions and hypoxia
Number
(Expected at PIF)
Number
(Expected at CEO
Endorsement) Number (achieved
at MTR) Number (achieved at TE)
0 0 0 0
LME at PIF LME at CEO
Endorsement LME at MTR LME at TE
Indicator 5.3 Amount of Marine Litter Avoided Metric Tons
(expected at
PIF) Metric Tons (expected at CEO Endorsement)
Metric Tons (Achieved at MTR)
Metric Tons (Achieved at TE)
5,000.00 5,065.00
Indicator 6 Greenhouse Gas Emissions Mitigated Total Target Benefit (At
PIF) (At CEO
Endorsement) (Achieved
at MTR) (Achieved at TE)
Total Target Benefit
(At PIF)
(At CEO Endorsement)
(Achieved at MTR)
(Achieved at TE) Expected metric tons of
CO?e (direct)
0 0 0 0
Expected metric tons of CO?e (indirect)
3000 9382 0 0
Indicator 6.1 Carbon Sequestered or Emissions Avoided in the AFOLU (Agriculture, Forestry and Other Land Use) sector
Total Target Benefit (At
PIF) (At CEO
Endorsement) (Achieved
at MTR) (Achieved at TE) Expected metric tons of
CO?e (direct)
Expected metric tons of CO?e (indirect)
Anticipated start year of accounting
Duration of accounting
Indicator 6.2 Emissions Avoided Outside AFOLU (Agriculture, Forestry and Other Land Use) Sector Total Target Benefit (At
PIF) (At CEO
Endorsement) (Achieved
at MTR) (Achieved at TE) Expected metric tons of
CO?e (direct)
Expected metric tons of CO?e (indirect)
3,00 0
9,382 Anticipated start year of
accounting
2021 2022 Duration of accounting 4 4
Indicator 6.3 Energy Saved (Use this sub-indicator in addition to the sub-indicator 6.2 if applicable)
Total Target Benefit
Energy (MJ) (At PIF)
Energy (MJ) (At CEO
Endorsement)
Energy (MJ) (Achieved at MTR)
Energy (MJ) (Achieved at TE)
Target Energy Saved (MJ)
Indicator 6.4 Increase in Installed Renewable Energy Capacity per Technology (Use this sub-indicator in addition to the sub-indicator 6.2 if applicable)
Technolog y
Capacity (MW)
(Expected at PIF)
Capacity (MW) (Expected at CEO Endorsement)
Capacity (MW)
(Achieved at MTR)
Capacity (MW) (Achieved at TE)
Indicator 7 Number of shared water ecosystems (fresh or marine) under new or improved cooperative management
Number
(Expected at PIF)
Number
(Expected at CEO Endorsement)
Number (Achieved at MTR)
Number (Achieved at TE) Shared
water Ecosystem
Caribbean sea, Pacific Central American Coastal
Caribbean sea, Pacific Central American Coastal
Count 2 2 0 0
Indicator 7.1 Level of Transboundary Diagonostic Analysis and Strategic Action Program (TDA/SAP) formulation and implementation (scale of 1 to 4; see Guidance)
Shared Water Ecosystem
Rating (Expected
at PIF) Rating (Expected at CEO Endorsement)
Rating (Achieved at MTR)
Rating (Achieved at TE) Indicator 7.2 Level of Regional Legal Agreements and Regional management institution(s) (RMI) to support its implementation (scale of 1 to 4; see Guidance)
Shared Water Ecosystem
Rating (Expected
at PIF) Rating (Expected at CEO Endorsement)
Rating (Achieved at MTR)
Rating (Achieved at TE) Indicator 7.3 Level of National/Local reforms and active participation of Inter-Ministeral Committees (IMC; scale 1 to 4; See Guidance)
Shared Water Ecosystem
Rating (Expected at PIF)
Rating (Expected at CEO
Endorsement)
Rating (Achieved at MTR)
Rating (Achieved at TE) Caribbean sea
Select SWE
2 2
Pacific Central American Coastal
Select SWE
2 2
Indicator 7.4 Level of engagement in IWLEARN throgh participation and delivery of key products(scale 1 to 4; see Guidance)
Shared Water Ecosystem
Rating (Expected at PIF)
Rating (Expected at CEO
Endorsement)
Rating (Achieved at MTR)
Rating (Achieved at TE) Caribbean sea
Select SWE
2 2
Shared Water Ecosystem
Rating (Expected at PIF)
Rating (Expected at CEO
Endorsement)
Rating (Achieved at MTR)
Rating (Achieved at TE) Pacific Central
American Coastal
Select SWE
2 2
Indicator 9 Reduction, disposal/destruction, phase out, elimination and avoidance of chemicals of global concern and their waste in the environment and in processes, materials and products (metric tons of toxic chemicals reduced)
Metric Tons (Expected at
PIF) Metric Tons (Expected at CEO Endorsement)
Metric Tons (Achieved at MTR)
Metric Tons (Achieved at TE)
0.00 54.90 0.00 0.00
Indicator 9.1 Solid and liquid Persistent Organic Pollutants (POPs) removed or disposed (POPs type)
POPs type
Metric Tons (Expected at PIF)
Metric Tons (Expected at CEO
Endorsement)
Metric Tons (Achieved at MTR)
Metric Tons (Achieved at TE) SelectHexabromocyclodo
decane (HBCDD) 14.00
SelectDecabromodiphenyl
ether (commercial mixture, c-decaBDE)
40.90
Indicator 9.2 Quantity of mercury reduced (metric tons) Metric Tons
(Expected at PIF)
Metric Tons (Expected at CEO Endorsement)
Metric Tons (Achieved at MTR)
Metric Tons (Achieved at TE)
Indicator 9.3 Hydrochloroflurocarbons (HCFC) Reduced/Phased out (metric tons) Metric Tons
(Expected at
PIF) Metric Tons (Expected at CEO Endorsement)
Metric Tons (Achieved at MTR)
Metric Tons (Achieved at TE)
Indicator 9.4 Number of countries with legislation and policy implemented to control chemicals and waste (Use this sub-indicator in addition to one of the sub-indicators 9.1, 9.2 and 9.3 if applicable)
Number (Expected at
PIF) Number (Expected at CEO Endorsement)
Number (Achieved at MTR)
Number (Achieved at TE)
Number (Expected at
PIF) Number (Expected at CEO Endorsement)
Number (Achieved at MTR)
Number (Achieved at TE)
Indicator 9.5 Number of low-chemical/non-chemical systems implemented, particularly in food production, manufacturing and cities (Use this sub-indicator in addition to one of the sub-indicators 9.1, 9.2 and 9.3 if applicable)
Number (Expected at PIF)
Number (Expected at CEO Endorsement)
Number (Achieved at MTR)
Number (Achieved at TE)
Indicator 9.6 Quantity of POPs/Mercury containing materials and products directly avoided Metric Tons
(Expected at
PIF) Metric Tons (Expected at CEO Endorsement)
Metric Tons (Achieved at MTR)
Metric Tons (Achieved at TE)
1,200.00
Indicator 10 Reduction, avoidance of emissions of POP to air from point and non-point sources (grams of toxic equivalent gTEQ)
Grams of toxic equivalent gTEQ (Expected at PIF)
Grams of toxic equivalent gTEQ (Expected at CEO Endorsement)
Grams of toxic equivalent gTEQ (Achieved at MTR)
Grams of toxic equivalent gTEQ (Achieved at TE)
1.16
Indicator 10.1 Number of countries with legislation and policy implemented to control emissions of POPs to air (Use this sub-indicator in addition to Core Indicator 10 if applicable)
Number (Expected at PIF)
Number (Expected at CEO Endorsement)
Number (Achieved at MTR)
Number (Achieved at TE)
Indicator 10.2 Number of emission control technologies/practices implemented (Use this sub-indicator in addition to Core Indicator 10 if applicable)
Number (Expected at
PIF) Number (Expected at CEO Endorsement)
Number (Achieved at MTR)
Number (Achieved at TE)
Indicator 11 Number of direct beneficiaries disaggregated by gender as co-benefit of GEF investment
Number (Expected at
PIF) Number (Expected at CEO Endorsement)
Number (Achieved at MTR)
Number (Achieved at TE)
Female 513,834 559,306
Male 342,556 430,856
Total 856390 990162 0 0
Provide additional explanation on targets, other methodologies used, and other focal area specifics (i.e., Aichi targets in BD) including justification where core indicator targets are not provided
Part II. Project Justification
1a. Project Description
1. DESCRIBE ANY CHANGES IN ALIGNMENT WITH THE PROJECT DESIGN WITH THE ORIGINAL PIF
The overall project structure presented in this document is consistent with the one presented in the PIF, albeit limited updates in the four components and associated budgets. The project design and activities were adapted to ensure cohesion in line with feedback received during PPG consultations with the Ministries of Environment, analysis of the policy and baseline situation in six project cities and two stakeholder workshops led by UNEP, as outline in Table 1 below.
Table 1. Changes between PIF and PPG versions
PIF CEO endorsement Comment
Component 1: Municipalities led governance and policy development to enact circular economy approaches in selected cities, for improved circularity and reduced marine plastics and plastic pollution
Budget: 2,650,000
Component 1: City Led Promotion of Circular Economy Policies to Reduce Marine Plastics and Plastic Pollution in Targeted Cities
Budget: 1,920,000
Changes to the outputs are made by merging policies targeting both the upstream and downstream of the plastic value chain to improve coherence.
The budget is reduced as the key knowledge products to distil the learnings from the Component 1 will be delivered under component 4 which covers knowledge management.
The pilot tests of business solutions under
component 2 will also contribute to the delivery of component 1, by helping cities to understand better what policies will be needed to facilitate the uptake of relevant business solutions. But the resources for those relevant outputs is allocated under component 2.
Outcome 1 was changed from ?policies adopted?
by city-level governments in the PIF to ?policies developed or adopted?, considering that policy adoption is usually a long process which may not be completed within the 4- year project
implementation phase.
Component 2: Private sector led interventions to strengthen markets for investments in innovative, scalable upstream actions, waste management and recycling solutions to reduce marine plastics and plastic pollution.
Budget: 2,650,000
Component 2: Private Sector Led Promotion of Circular Economy Actions to Reduce Marine Plastics and Plastic Pollution in Targeted Cities
Budget: 2,355,000
Changes to the outputs are made by merging two outputs on business solutions targeting both the production and consumption stages to improve coherence.
The budget is reduced as the key knowledge products to distil the learnings from the Component 2 will be delivered under component 4 which covers knowledge management.
Component 3. Inter-city marine plastics and plastics circular economy engagement network Budget: 745,000
Component 3: Inter-City Network on Marine Plastics and Plastic Circular Economy Budget: 814,584
The component is strengthened, and additional resources are allocated to allow the inter-city network to cover more cities in the region.
Output 3.1 was rephrased as ?Inter-city network operationalized? to better reflect the nature of this output, Under this output, a framework document to define the clear,
governance and goals of the Inter-city network as indicated in the PIF will be developed.
Component 4: Capacity development, visibility improvement, knowledge management and dissemination, and communications.
Budget: 621,667
Component 4: Capacity development and knowledge management
Budget: 1,269,583
Allocation of more resources is made to accommodate the importance of the component for learning, training, analysis, dialogue, awareness, and interaction, within and beyond the project cities.
Monitoring and Evaluation was integrated in project component, and not singled out in the PIF.
Monitoring and
Evaluation is singled out in the CEO endorsement.
Budget: 307,500
Monitoring and Evaluation cost is listed out separately in the CEO endorsement.
A. PROJECT DESCRIPTION
1)
GLOBAL ENVIRONMENTAL AND/OR
ADAPTATION PROBLEMS, ROOT CAUSES AND BARRIERS THAT NEED TO BE
ADDRESSED
1.1 Problems on Marine Plastics and Plastic Pollution
1.1.1
The problems with plastics
Plastic pollution is one of the most pressing and visible environmental issues. About 388 million tonnes of plastics were produced in 2015 with 99.5% from petrol-based sources.[1]1 Despite all efforts to rethink, refuse, reduce, reuse, and recycle, around 7.0 billion tonnes out of the 9.2 billion tonnes of global cumulative plastic production became plastic waste between 1950 ? 2017.[2]2 With global plastic recycling rate as low as 9%, [3]3 and growing global plastic production rate by an average of 9%
per year,[4]4 a far bigger problem is unfolding with devastating consequences on oceans and coastlines worldwide. Under a business-as-usual scenario, the amount of plastics entering aquatic ecosystems could nearly triple from approximately 9-14 million tonnes per year in 2016 to a projected 23-37 million tonnes per year by 2040.[5]5
While the impact on oceans is vast and rapidly growing, the threat on land is of equal significance considering that 32% of plastic waste finds its way into soils or freshwater [6]6. Hotspots of microplastics were documented in the vicinity of cities, beaches, and dams,[7]7 while usage and disposal of plastics continue to raise concerns over excessive accumulation of plastics in landfills and natural habitat, ingestion, or entanglement in wildlife, and above all leaching of toxic chemicals. [8]8 The problem with plastics is multi-dimensional, with far-reaching implications on ecosystems and societies. Some highlights include:
- Plastic leakage in the environment results in ecological, eco-toxicological and economic effects, where plastics and plastic products travel long distances, transport invasive species, and severely impact marine ecosystems through entanglement, ingestion, and starvation of marine
animals[9]9. Plastics degrade extremely slowly in the environment, and its fragments during degradation can be digested by organisms which transfer these materials across the food value chain back to humans.
- Plastic pollution has reduced marine ecosystem services (including fisheries, aquaculture, climate regulation, pest and disease control, heritage values, and recreation) by at least 1-5%, with an annual loss of US$500-2,500 billion value of marine natural capital to society (which amounts to between US$3,300 and $33,000 per tonne of marine plastic pollution). [10]10
- Some polymers are of high toxicological concerns such as polystyrene (PS), polyvinyl chloride (PVC) and those incorporating flame-retardant chemicals, some of which are POPs. These polymers are primarily used in electronics, transport, and building and construction products.
Although some of these products are not prevalent in marine plastics, their potential presence is of concern due to their high toxicity. Lack of information and evidence about the content and breakdown of the various polymers used to make plastics, including biodegradable plastics, is of serious concern to many experts because these products often do not meet expectations and can lead to less effective recycling and waste disposal.[11]11
- Some plastics contain property enhancing additives that are classified as POPs, which are hazardous if not adequately managed at their end of life[12]12. Chemical impacts may occur due to POPs exposure, which persist for long periods of time in the environment and can accumulate and pass from one species to the next through the food chain, in a process known as biomagnification. From the POPs listed in the Stockholm Convention, Hexabromocyclododecane (HBCD), Polybrominated diphenyl ethers (PBDEs, including Penta-BDE, Octa-BDE and Deca- BDE), short chain chlorinated paraffins (SCCPs), Perfluorooctanoic acid (PFOA), and Perfluoro octane sulfonic acid (PFOS) and its salts, Perfluoro octane sulfonyl fluoride (PFOSF) are relevant to plastic products. Moreover, Polychlorinated naphthalene?s (PCNs) were formerly used in plastics and cables. Plastics can also absorb POPs such as PVB, DDT and dioxins, which are frequently detected in marine plastic litter.[13]13 Table 2 below summarizes some of the key applications of these chemical additives in plastics which are listed in the annex in the Stockholm convention.
- Some plastic products contain halogens (e.g., Polyvinyl chloride as plastic coating on electrical cables and pipes), when these are combusted at low temperatures without off-gas treatment in substandard recycling facilities (e.g., with deliberate or unintentional burning), it can lead to the formation of unintentional POPs (uPOPs) including dioxin and furans, which can cause cancer.[14]14
- The level of greenhouse gas (GHG) emissions associated with the global life cycle of all conventional fossil fuel-based plastics could grow from 1.7 gigatons of carbon dioxide equivalent (GtCO2eq) in 2016 to approximately 6.5 GtCO2e by 2050.[15]15
- Recycling of materials containing Polybrominated diphenyl ethers (PBDEs) prolongs the exposure via new products. In 2018 the global amounts of PBDE were estimated to be 425kt in use, and 113kt for the waste stocks. More than 70% of PBDE emissions from production and use occurred in industrialized regions, while more than 70% of the emissions during waste disposal occurred in the less industrialized regions. A total of 70 kt was recycled within products since 1970. As recycling rates are expected to increase under the circular economy, an additional 45 kt of PBDEs will reappear in new products through recycling unless taken out of the loop. [16]16
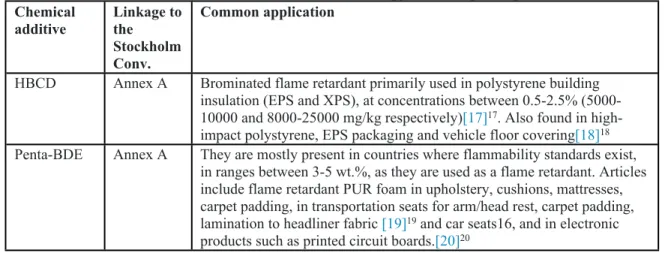
Table 2. Chemical additives and their common application in plastic products Chemical
additive Linkage to the Stockholm Conv.
Common application
HBCD Annex A Brominated flame retardant primarily used in polystyrene building insulation (EPS and XPS), at concentrations between 0.5-2.5% (5000- 10000 and 8000-25000 mg/kg respectively)[17]17. Also found in high- impact polystyrene, EPS packaging and vehicle floor covering[18]18 Penta-BDE Annex A They are mostly present in countries where flammability standards exist,
in ranges between 3-5 wt.%, as they are used as a flame retardant. Articles include flame retardant PUR foam in upholstery, cushions, mattresses, carpet padding, in transportation seats for arm/head rest, carpet padding, lamination to headliner fabric [19]19 and car seats16, and in electronic products such as printed circuit boards.[20]20
Octa-BDE Annex A Used as a flame retardant with a wt.% between 12-18%, octa-BDEs are mainly found in plastic casings for electronics, including CRT monitor casings, flat screen TVs (LCD), ABS casings, HIPS casings; parts in EEE (computer & TV casings, office equipment), HIPS cold-resistant layers in refrigerators, polybutylene-terephthalate (PBT) casings for electronic appliances, PBT connectors in vehicles, PBT in household irons. Are also found in polyamide pipes & plastic foils.
Deca-BDE Annex A Ranging almost up to 5 kg per tonne, deca-BDE is present in products as a flame retardant, including rail vehicles as UP resin, as plastic fraction of cooling / freezing appliances & washing machines, heating appliances, household appliances, ICT equipment (w/o monitors), flat screen TVs (LCD)16, and polyurethane foam vehicle seats with 3.4 mg/kg.18 SCCP Annex A SCCP can be found in PVC (cables and consumer goods), EVA foams,
and natural synthetic rubber, in concentrations ranging up to 170,000 mg/kg.[21]21
Consumer products (no further materials specified) in which SCCP were found, mainly as a plasticizer or flame retardant, include sports equipment, toys, pillows, electronics, (power chords, cables, mobile phone cases, household appliances), all-purpose mats, rain covers, bathmats, shower curtains, artificial leather products (e.g., wallets, handbags, purses, toiletry bags, pencil cases)17. SCCP is also used in transmission belts, rubber conveyor belts, adhesives, and plasticizers as a specific exemption under the Stockholm Convention.[22]22
PFOA/PFOS Annex A/B PFOS and PFOA are used in sports shoes, matrasses, textiles, children?s clothes, PVC floors, photographic and electronic equipment, building materials, and food packaging as a dispersing agent. PFOA has been found in food packaging in concentrations up to 44 ?g of PFOA/dm2.[23]23 From 2002-2007, 4,442.1 kg of PFOS was used in artificial or synthetic fabric rugs and mats manufactured locally in Colombia.[24]24
Dioxin &
furans (uPOPs)
Annex C These are released upon incineration of wide range of plastic products (including cables, agricultural plastics such as PVC, electric wire tube, scrap tires, municipal waste) different concentration volumes ranging from 12,000 to 40 ?g TEQ/t material from highest to lowest.[25]25
1.1.2
The problem in LAC cities
Latin America and the Caribbean shares 4% of total plastics production and 8% of total plastics consumption worldwide[26]26. With over 600 million inhabitants, plastic waste within the municipal waste stream is significant. Yet, existing waste management systems are limited and characterized by inadequate practices and the need for improvements. Despite waste collection coverage reaching 89.9%
(higher than the global average of 73.6%), [27]27 one third of the waste generated in LAC (equivalent
to 145,000 tonnes per day) continue to end up in open dumpsites, including 17,000 tonnes/day of plastic waste. [28]28 Visible plastics and plastic products are frequently found along LAC coasts and marine environments, owing to intensive anthropogenic activities and poor management systems.
[29]29
Recycling and composting systems are still emerging across the region. Recycling rate is well below 4.5%, [30]30 which is in part due to the absence of comprehensive recycling programs at the region, state, and municipal levels, and the informal nature of existing recycling practices (informal sector typically recovers only the valuable fraction and their efforts are not included in official statistics). As a consequence, wastes that end up in landfills or improperly disposed in an unprotected dump sites contain enormous volumes of reusable and recyclable materials.
Colombia, Panam?, and Jamaica are coping with similar challenges posed by ever increasing volumes of plastic wastes. Marine litter within the three countries is adversely affecting the coastal waters and impacting key sectors from tourism to fisheries. Insufficient waste management capacities and practices affect millions of inhabitants whose livelihoods are based on fragile coastal marine areas.
Furthermore, there is a larger context of excessive waste generation, knowledge gaps, and ineffective/absent policy and regulatory frameworks. Some highlights include:
- Costal lines are plagued by macro- and micro-plastic pollution in the three countries. A plastic pollution assessment found that the microplastics densities ranged from 3 to 1387 items per m-2 in 43 Colombian sandy beaches on the Caribbean and Pacific coasts.[31]31 Similarly, Panamanian beaches recorded high concentration of microplastics of 353 items/m2 and 87 items/m2 at the Caribbean and Pacific coasts respectively. [32]32 This was also confirmed in Jamaica by a study that documented microplastic pollution in the Kingston Harbour ranging from (0-5.73
particles/m3.[33]33 While the anthropogenic activities are the main influencer behind the increase in microplastic contents, country specific factors should be also noteworthy (e.g., Panam? Canal, natural phenomena, ocean currents).
- Single use plastics continue to dominate marine litter accumulated in the costal lines in the region, including the three countries. The majority of macroplastic marine litter has a lifetime less than1 year, as documented in costal lines of Colombia. Similar case exists in Jamaica confirmed by a study that documented marine litter to be mainly composed of plastic beverage bottles (32%), followed by plastic bottle caps (11%), and foam food containers (2.7%). Laws restricting
single-use plastics are slowly emerging in the region as in the case of Panam? and Jamaica. Yet, there remain challenges related to law enforcement and expansion to more product categories.
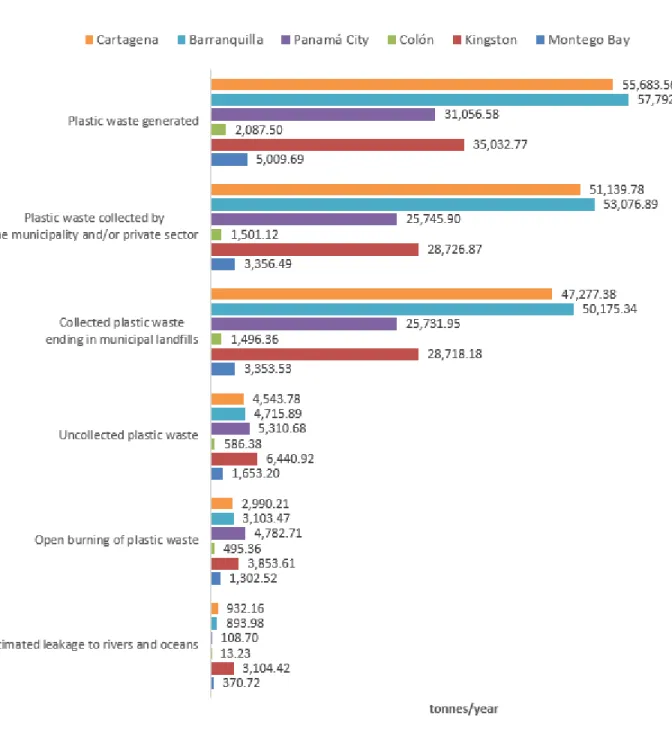
- Urban environments are responsible for an estimated 60% of marine plastics[34]34, and polluted waterways continuously carry plastic pollution to oceans. Floating waste captured in the Matias Hernandez river basin in Panam? is primarily plastic material.[35]35 Around 8% of the waste generated in Barranquilla, Colombia is uncollected and eventually leaks into the ocean and waterways. There is a similar case in Jamaica, where 370 tonnes of plastics were estimated to be leaked to the ocean from Kingston in 2018, corresponding to 3.33 kg/capita/year. Furthermore. It was observed that the most polluted beaches were found in the urban Caribbean and the rural Pacific areas.26 This can be explained due to larger population, higher waste generation, deficiencies in basic sanitation and poor waste management systems.
- The economic dimension is becoming more salient, as the effects of plastic pollution accumulate. A study estimated that clean-up costs of plastic waste in LAC range from $196 to
$401 million USD, while revenue loss accounts for between $23 to $276 million USD.[36]36
- Regulatory and legislative frameworks are riddled with gaps and implementation challenges.
Laws restricting single-use plastics (targeting plastic consumption) are promising steps but do not substitute the need for holistic sustainable plastic life-cycle management, which is absent in the LAC region. Product stewardship initiatives (targeting the plastic industry), including extended producer responsibility, are nascent and yet to mature.
- Emissions of uPOPs is common in the region due to mismanagement of waste and resources.
According to Stockholm Convention National Implementation Plans, 57.6% of Jamaica?s Dioxins and Furans releases come from open burning. Similar readings are shared with Panam?
(~23.2 gTEQ/year), and Colombia (~243.47g EQT/y) constituting 41.74% of country?s emission.
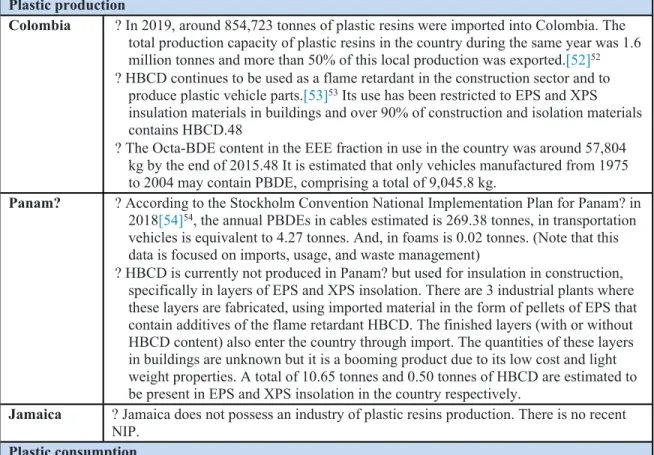
- There exist regional knowledge gaps in mainstreaming the management of harmful chemicals and waste, and inclusion of POPs into certain institutions and policies. For instance, Colombia?s vehicle disintegration and scrapping programmes do not consider vehicle polyurethane foams as
hazardous wastes. To date, HBCD continues to be used as a flame retardant in construction and plastic vehicle parts. Similarly, for Panam?, where products in the form of EPS layers with HBCD content are continuously imported. Awareness about certain chemicals, specifically plastic chemical additives containing POPs, is limited, and by extension preparedness for the sound management of later phases such as end-of-life
- LAC cities are attracting rural residents in droves, which is part of the global trend driving 3 million people to urban centers every week. As cities continue to grow, the consumption patterns and consumer behavior need to be influenced. Behavioral instruments (utilising people?s social preferences and/or cognitive limitations to influence behaviour in favour of lower plastic
pollution) [37]37 had proven effective in other regions and are currently absent in the LAC region.
Cross-learning and exchange of knowledge in this field is needed.
As discussed, cities are engines of economic growth. They are central drivers of unsustainable patterns of consumption, with urban consumers particularly accustomed to the convenience of on-the-go and home-delivery lifestyle. Cities need to be at the forefront of rethinking the consumption
landscape.[38]38 A detailed analysis of key problems is included in the baseline section, where national and city specific contexts are covered.
1.2 Root causes and barriers
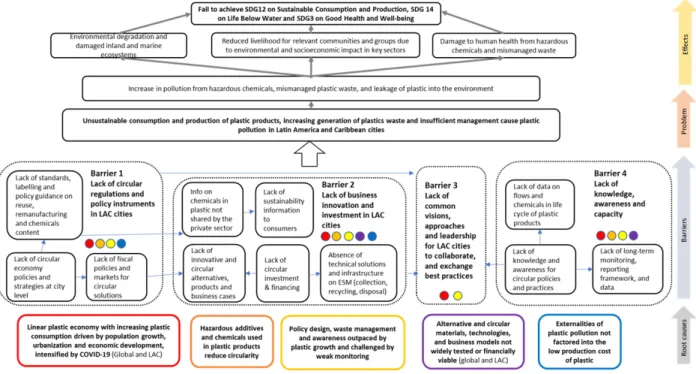
As presented in Figure 1, the analysis of the problematic situation of increased pollution from hazardous chemicals, mismanaged plastic waste, and leakage of plastic into the environment has identified six root causes that lead up to the key problem. Each root cause underpins specific barriers which must be addressed to reduce regional marine plastics and plastic pollution and to accelerate the transition to a circular economy. These barriers sustain the environmental problem identified in the section above (section 1.1): the unsustainable consumption and production of plastic products, increasing generation of plastics waste and insufficient management that causes plastic pollution in Latin America and Caribbean cities. This has led to the impacts at environmental, social and economic dimensions, which eventually slow down or prevent the achievement of the Sustainable Development Goals and its relevant targets by 2030. Increased circularity of plastic value chains would reduce the pollution from hazardous chemicals and mismanaged waste, and leakage into the environment.
The project is structured around the mitigation of these root causes and barriers (see section 3 on the alternative scenario).
1.2.1
Root causes
The root causes leading to the unsustainable consumption and production of plastic products, increasing generation of plastics waste and insufficient management that causes plastic pollution in Latin America and Caribbean cities are the following:
1- Linear plastics economy with increasing plastic consumption driven by population growth, urbanization, and economic development, while further intensified by COVID-19: The fundamental cause of the plastic pollution is the linear ?take-make-dispose? pattern of the current plastics economy paired with low oil prices, making the production of virgin plastics much cheaper and economically more attractive than using recycled content or other alternative materials.
Demand for single-use plastic products has further increased due to COVID-19, as disposable plastic products (such as PPE and cutleries) provide affordable solutions to consumers to meet their sanitary and health requirements.[39]39 This needs for PPE due to COVID-19 has also increased the production and consumption of plastics specifically in the LAC region. For example, Colombia estimated an increase in the monthly manufacture of face masks (from 2 to 8?10 million), of N95 medical masks (from 60,000 to 100,000), and it imported over 2 million pairs of gloves.[40]40 Furthermore, urban areas continue to grow in LAC which drives the consumption of plastic products. Urban population increased by more than 35 million people between 2010 and 2015 and is expected to climb to a total of 567 million persons by 2025.[41]41
2- Hazardous additives and chemicals used in plastic products reduce circularity: Additives (such as brominated flame retardants) and chemicals are used in large volumes of plastics. The presence of additives is potentially a serious constraint on the recycling of plastics and the move to a circular economy.
3- Policy design, waste management and awareness are outpaced by plastic growth and challenged by weak monitoring: Plastic waste is being generated at such a pace that far exceeds the ability of existing policies, infrastructure, and awareness raising campaigns to deal with.
Existing waste reporting and monitoring systems are inadequate to bring optimal analysis of waste generation and leakages. Up to 50% of all recycling in the LAC region is undertaken by
approximately two million informal recycling workers,[42]42, which is rarely reported on and captured by existing surveys. Therefore, LAC has as the lowest reported average recycle rate (for all waste types) across all regions at 4.5%.
4- Alternative materials, technologies, and business models needed for a more circular plastic economy are not widely tested or financially viable. Identifying alternative materials based on life cycle assessment can be a challenge itself. Findings from the LCA are usually context-specific, as the environmental impact of products is dependent on the sources that their raw materials come from and where the products are manufactured, which may differ over the years.[43]43 Many reuse
solutions, which might perform well in pilots, still need to test their operational and economic viability at scale. In terms of technologies, chemical recycling technologies are not yet widespread and/or not yet economically viable for most common packaging plastics. In the context of the pandemic, reduced economic activity has seen sharp falls in global oil prices. In turn, this has made it significantly cheaper for manufacturers to produce plastic goods from virgin, fossil-based materials than to use recycled plastic materials. The economic viability of global plastics recycling market is presently under significant pressure.[44]44
5- Externalities of plastic pollution are not factored into the low production cost of plastics in the region. The production cost of recycled plastics is often still higher than that of virgin plastics as the externalities of plastic pollution (see sections 1.1.1 and 1.1.2) are not factored into the costs[45]45. In the LAC region, national economies have been heavily dependent on natural resources and commodities exports with macroeconomic vulnerabilities, thus, some countries have not been able to develop appropriate circular policies that incentive plastics recycling. There is thus a high dependence on the linear plastic economy in the region partially due to its industrial structure. The largest consumer and producer markets of plastics are Mexico and Brazil, while Colombia, Peru and Chile are the fastest growing ones.[46]46
1.2.2
Barriers to be addressed
The problem of marine plastics and plastic pollution is transboundary, cross-cutting as well as regionally specific, and there are notable barriers in various aspects to solve the problem. In this context, the barriers of fully implementing a circular economy approach for plastics in LAC cities include:
1- Lack of regulations and policy instruments from governments to incentivize sustainable consumption and production for circular plastic products and pollution reduction at city level. This is linked to Root Causes 1, 2, 3, and 5.
? Globally and nationally, agreements policies and action plans to support implementation of upstream solutions (such as eco-design and product lifetime extension), improve recyclability, incentivize demand for recycled plastics, and streamline downstream waste management, are uncoordinated.
? Existing city level policy usually focuses more on the collection, recycling, and disposal of plastic waste, while lacking a comprehensive strategy and concrete targets on waste minimization and reduction, reuse and refurbishment.
? There is a lack of standards, labelling and policy incentives on reuse and remanufacturing of products and components, as well as on the chemical content in relevant plastic products.
? There lacks policy and enforcement to set up environmentally sound management system for plastics, considering the presence of the informal sector and prevalence of open dumpsites.
2- Lack of innovations and investment from the private sector to tackle the plastic pollution from a systemic and value chain perspective at city level. This is linked to all Root Causes.
? Technology is a bottleneck for further improvements in linking product design, value chain management and industrial symbiosis for circularity of plastic products, and there is in general low R&D investment within businesses and in new businesses enterprises. There are no sufficient alternatives and solutions that have been proven to replace single-use and unnecessary plastic products and polymers, that are appropriate, effective, and do not result in other environmental and human health impacts.
? Most plastic wastes are sent to dumpsites and technical solutions and infrastructure to support more efficient reuse, remanufacturing and recycling, are absent.
? There is a lack of market, economic incentives, added value and competitiveness for product reuse and recycled materials for adopting circularity. Upcycling plastic is currently not profitable in most of the cases. The public-private partnership working on the circular solution such as financing, investment and infrastructure is usually weak.
? The information on the chemicals of concern (CoCs) and substances in plastic products are not assessed and shared by the private sector, and the pollution from substandard recycling is not properly evaluated either.
? The presence of the informal sector and mismanaged waste systems make formal recycling less competitive and attractive. There is a lack of tailored approaches for developing circularity strategy to match with the local reality of waste handling.
? There is a lack of appropriate business cases to encourage the private sector to invest in circular products and service. Small and medium-sized businesses lack budget, personnel, or time to devote to
researching issues around waste and circularity.
? Coordinated systems standardizing materials for reuse and recycling are lacking, along with challenges for more efficient collection, sorting, recycling, and recovery of plastics. There is no sufficient
coordinated financing, incentives, and awareness, to support upstream solutions to plastic pollution and to prevent the leakage of plastics into the environment (especially the financing of waste management).
3- Lack of a common vision, approaches, and leadership for LAC cities to act collectively under an aligned regional strategy for circular economy of plastics at the regional level. This is linked to Roots Causes 1 and 3.
? There is no common vision and strategies for cities in LAC to work collectively on the circularity agenda of plastics.
? There is no platform and initiative to support the exchange of experience and best practices for LAC cities.
? There is a lack of knowledge, resources, and capacity to implement existing strategies, policies, and business plans, as well as mechanisms to upscale the influence in all LAC cities.
4- Lack of knowledge, awareness, and capacity to enable governments, businesses and other stakeholders to learn and adopt best practices at city, national and regional levels in LAC. This is linked to Root causes 1, 2, 3, and 4.
? There is a lack of harmonized monitoring for marine litter and plastic pollution at city, national and regional levels in LAC. In addition, there are no sufficient quality data, databases and information management systems on e.g., numerous types of polymers and plastics applications along the value
chain; chemical content of plastic products; stocks, flows, pathways and fates of macro- and microplastics into the environment including the oceans; consumer behavior and cultural drivers of plastics consumption; the magnitudes of environmental and socio-economic impacts of marine plastics and plastic pollution; and quantitative evaluation on the impacts of different solutions and
interventions, to support the monitoring.
? It is difficult to obtain information and track the quantity and impacts of hazardous additives and chemicals throughout the life cycle of plastics, thus making reduction of chemicals of concerns and waste difficult.
? There is a lack of institutional capacity in the governments at city level, to address plastic pollution in a systemic way. Regulations and policies at national level face implementation challenges at municipal level sufficiently due to lack of technical expertise and resources.
? At the business and company level, circular design and solutions are usually not well evaluated, communicated, and applied in strategic planning.
? There is a lack of capacity to learn and adopt the latest success experience and best practices for circularity of plastics at city, national and regional levels.
Figure 1. Problem Tree of the Project
2) THE BASELINE SCENARIOS AND ANY ASSOCIATED BASELINE PROJECTS 2.1 Global and Regional Baseline Scenario
A number of existing Multilateral Environmental Agreements (MEA) and global instruments, of both legally binding and voluntary nature, are relevant to plastics, the chemicals of concern in plastics and plastic pollution. These include:
- The Basel Convention on the Control of Transboundary Movements of Hazardous Wastes and their Disposal (including the BAN Amendment and the Plastic wastes amendments).[47]47
- Rotterdam Convention on the Prior Informed Consent Procedure for Certain Hazardous Chemicals and Pesticides in International Trade and the Stockholm Convention on persistent organic pollutants (POPs).[48]48
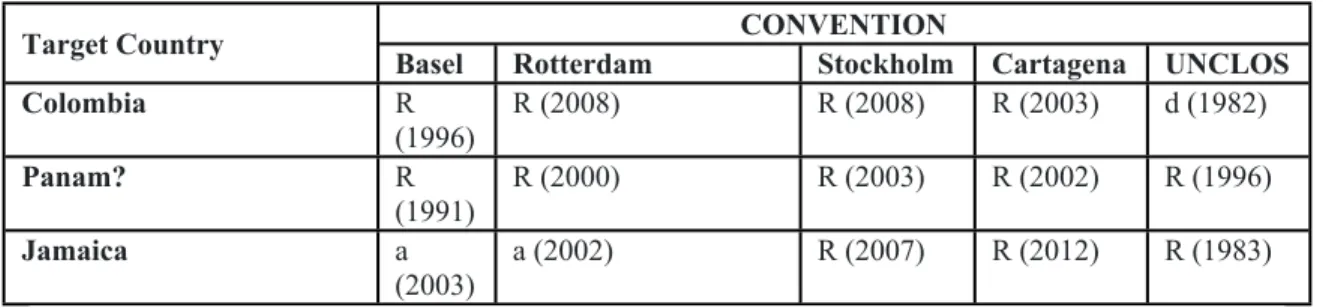
Table 3 presents an overview on the status of ratifying plastics related conventions in Colombia, Panam?, and Jamaica.
The United Nations Convention on the Law of the Sea (UNCLOS) is the only binding policy that requires nations to minimize pollution from both marine and land-based sources that may enter the marine environment. The Regional Seas Conventions and Action Plans are of direct relevance to reducing marine plastic pollution. The action plans target key activities and sources of plastic waste in 18 separate regions and set binding and non-binding obligations to reduce pollution from these sources.
Furthermore, the Global Partnership on Marine Litter (GPML), a voluntary, multi-stakeholder platform with more than 400 members from over 70 countries, fosters collaboration on a range of activities, including building the knowledge base and facilitating the development of regional nodes as well as regional and national strategies and action plans to tackle marine litter and plastic pollution. It is also developing a digital platform aiming to integrate data and information, connecting stakeholders, and facilitating coordination on an ad hoc or regular basis.
Table 3. Status of Ratification of the relevant Conventions in three project countries CONVENTION
Target Country
Basel Rotterdam Stockholm Cartagena UNCLOS
Colombia R
(1996) R (2008) R (2008) R (2003) d (1982)
Panam? R
(1991)
R (2000) R (2003) R (2002) R (1996)
Jamaica a
(2003) a (2002) R (2007) R (2012) R (1983)
Key: (a) = accession; (R) = ratification; (d)=Signature, Succession to signature; N.S. = not signatory Marine plastic pollution has been the subject of resolutions at United Nations Environment Assembly (UNEA)-1, -2, -3 and -4. In recent years, many countries have highlighted the need for a global agreement to address the issue.
Many governments are taking actions. Five of the Group of Seven (G7) nations have agreed to an Ocean Plastics Charter that commits them to act towards ?a resource-efficient lifecycle management approach to plastics in the economy?. The European Strategy for Plastics in a Circular Economy is a forerunner in describing the vision for a revised and sustainable plastics economy. It includes aspects on improving the economics and quality of recycling, preventing waste and littering, increasing investment and innovation in circular solutions, and increasing global action.
More than 60 countries have introduced measures to curb single-use plastic waste, and the number of governments, industry and consumer led actions continues to rise. Bans on single-use plastic bags have been especially evident in developing countries, particularly Africa and Asia, with restrictions and other disincentives (taxes or levies) motivated primarily by waste management and littering concerns.
Most European Union member countries have adopted economic instruments and public-private agreements rather than directly banning single-use plastic products. There are also a number of voluntary initiatives to address plastic pollution. For instance, the New Plastics Economy Global Commitment has united more than 500 organizations, including 20 governments and more than 250 businesses across all stages of the plastic packaging value chain, representing more than 20% of all plastic packaging used globally. The Clean Seas Campaign was launched by UNEP in 2017 and now has commitments by 63 signatory countries (20 from the LAC region) which cover more than 60 per cent of the world?s coastlines. Moreover, more than 111,000 people have signed the pledge worldwide.
Government policies across LAC have been taking measures to address marine plastics and plastic pollution, but efforts to introduce resource efficient production and consumption practices, that can help tackle this pollution problem, are still lacking. Also, given that the region?s economies and industries are characterized by an intensive use of natural resources. In at least 27 out of 33 LAC countries, national and/or local legislation towards the reduction, prohibition, and/or elimination of single-use plastic products have been issued.[49]49 Fiscal policies (including taxation, incentives and subsidy removal) are applied together with other policies to tackle plastic pollution. Product lifetime extension and circular design are a step further in the direction of the circular economy but are currently not present in the region.
Existing actions on reducing marine plastics and plastic pollution at the LAC regional level include:
1- The Cartagena Convention is the only legally binding agreement in the region for the protection of the Caribbean Sea. Through the Convention and specifically the Land-Based Sources of Marine Pollution Protocol, governments receive support to control, reduce and prevent marine pollution from all sources. The UNEP Caribbean Environment Programme (CEP), which is also the Secretariat of the Cartagena Convention, promotes best practices and shares experiences about the management of solid waste, marine litter, and plastics through various platforms such as the Caribbean Regional Node of the GPML. These include participation at regional and international conferences.
2- The South-East Pacific Action Plan was adopted in 1981 together with the Convention for the Protection of the Marine Environment and Coastal Zones of the South-East Pacific (Lima Convention) and its associated protocols. The Protocol for the Protection of the South-East Pacific Against Pollution from Land- Based Sources; along with the framework programme for marine litter management (2007) form the basis for the support provided to countries in the region.
3- The Caribbean Regional Action Plan for Marine Litter (RAPMaLi) serves as a
comprehensive toolkit to assist countries of the WCR to adopt a range of practices for reducing the negative impacts of solid waste, marine litter, and plastics. A Regional Marine Litter Strategy completed in 2021 through the GPML-Caribe complement this plan.[50]50