Building human well-being and resilience in Amazonian forests by enhancing the value of biodiversity for food security and bio-businesses, in a context of climate change
Part I: Project Information Name of Parent Program
Amazon Sustainable Landscapes Program - Phase II GEF ID
10248 Project Type FSP
Type of Trust Fund GET
CBIT/NGI CBIT NGI Project Title
Building human well-being and resilience in Amazonian forests by enhancing the value of biodiversity for food security and bio-businesses, in a context of climate change
Countries Peru Agency(ies)
FAO, UNIDO, IFAD Other Executing Partner(s) Ministry of Environment Executing Partner Type Government
GEF Focal Area
Multi Focal Area Taxonomy
Deploy innovative financial instruments, Convene multi-stakeholder alliances, Influencing models, Strengthen institutional capacity and decision-making, Indigenous Peoples, Stakeholders, Local Communities, Public Campaigns, Communications, Behavior change, Education, Awareness Raising, Non-Governmental Organization, Civil Society, Academia, Community Based Organization, Individuals/Entrepreneurs, Private Sector, Financial intermediaries and market facilitators, Information Dissemination, Type of Engagement, Consultation, Partnership, Participation, Beneficiaries, Enabling Activities, Capacity, Knowledge and Research, Adaptive management, Learning, Theory of change, Indicators to measure change, Capacity Development, Innovation, Knowledge Generation and Exchange, Gender results areas, Gender Equality, Access and control over natural resources, Participation and leadership, Access to benefits and services, Sex- disaggregated indicators, Gender Mainstreaming, Gender-sensitive indicators, Women groups, Sustainable Commodities Production, Commodity Supply Chains, Integrated Programs, High Carbon Stocks Forests, Deforestion-free Sourcing, High Conservation Value Forests, Nationally Determined Contribution, United Nations Framework Convention on Climate Change, Climate Change, Focal Areas, Financing, Climate Change Mitigation, Agriculture, Forestry, and Other Land Use, Ecosystem-based Adaptation, Climate Change Adaptation, Climate resilience, Forest and Landscape Restoration, Forest, REDD - REDD+, Amazon, Food Security, Land Degradation, Restoration and Rehabilitation of Degraded Lands, Sustainable Land
Management, Tourism, Mainstreaming, Biodiversity, Forestry - Including HCVF and REDD+, Tropical Rain Forests, Biomes, Rivers, Wetlands, Community Based Natural Resource Mngt, Protected Areas and
Landscapes, Terrestrial Protected Areas, Productive Landscapes, Transform policy and regulatory environments
Rio Markers
Climate Change Mitigation Climate Change Mitigation 2 Climate Change Adaptation Climate Change Adaptation 2
Submission Date 12/13/2020
Expected Implementation Start 7/31/2021
Expected Completion Date 7/31/2026
Duration
60In Months Agency Fee($) 1,403,917.00
A. FOCAL/NON-FOCAL AREA ELEMENTS Objectives/Programs Focal Area
Outcomes Trust
Fund GEF
Amount($) Co-Fin Amount($)
IP SFM Amazon Integrated
conservation and sustainable development of the Peruvian Amazon.
GET 15,599,083.00 124,561,476.4 6
Total Project Cost($) 15,599,083.00 124,561,476.4 6
B. Project description summary
Project Objective
To advance the conservation of healthy and functional forests and wetlands resilient to climate change, maintaining carbon stocks, preventing GHG emissions, and generating sustainable and resilient local livelihoods[1]. [1] The Project will deploy field interventions in and around protected areas (PA) and indigenous territories (IT); supported by regional, national and international actions. All interventions will adopt adaptive, gender, and intercultural approaches, and respond to Peru?s NDC for climate change mitigation and adaptation.
Project Compone nt
Financin
g Type Expected
Outcomes Expected
Outputs Tru
st Fun d
GEF Project Financing($
)
Confirmed Co- Financing($)
Project Compone nt
Financin g Type
Expected Outcomes
Expected Outputs
Tru st Fun d
GEF Project Financing($
)
Confirmed Co- Financing($)
1.-
Collaborativ e, coherent and synergistic governance among State sectors and levels for the sustainable developmen t of the Amazon.
Technical Assistanc e
1.1. Enabling conditions (plans, guidelines and instruments), and
strengthened capacities for sustainable soil and water management by different sectors through land use planning and integrated management, emphasizing the local level.
1.2.
Opportunities and
administrative incentives designed and strengthened for
collaborative decision- making on Amazonian sustainability.
1.3.
Information system and social and environmental monitoring and evaluation tools designed and consolidated for decision- making.
1.1.1. Land use planning instruments developed, articulated and
strengthened in the Project intervention landscapes.
1.1.2.
Instruments developed for the
sustainable management of Amazon ecosystems (permits, concessions, etc.)
1.1.3.
Financial and economic mechanisms and incentives for
sustainable management.
1.2.1.
Strengthened institutional capacities of national, regional, and local governments in land use planning and natural resource integrated management with different sectors in a context of climate change.
1.2.2.
Strengthened capacities of local stakeholders (organized producers, native communities, indigenous organisations, etc.) for land use planning, taking into account the development of native communities through their life plans.
1.3.1.
Dialogue platforms work effectively, improving decision- making and multi-sector coordination, using monitoring systems and promoting community monitoring in order to achieve sustainable ecosystem management.
Output 1.3.2 Strengthened information tools to formulate investment projects.
GET 1,351,158.0 0
13,227,903.0 0
Project Compone nt
Financin g Type
Expected Outcomes
Expected Outputs
Tru st Fun d
GEF Project Financing($
)
Confirmed Co- Financing($)
2.
Strengtheni ng of Amazonian connectivity through landscape managed as mosaics of conservation and
sustainable use, in the areas of influence of protected areas (PAs)
Investmen
t 2.1. Integrated
management of the territory strengthened on the basis of PAs, according to life plans and community development plans.
2.2. PA financial sustainability models developed and implemented
2.3 New PAs identified and created, including other effective area- based conservation measures (OECMs) such as indigenous reserves for people in isolation.
2.4 Landscape restoration plans and pilots implemented
2.1.1.
Strengthened capacities of national, regional and local stakeholders for the integrated management of the territory based on the PAs.
2.1.2. PA management plans, life plans, and development plans
coordinated in order to ensure integrated management of the territory based on the PAs and local expectations.
2.1.3. PAs and OECMs improve their management capacities for landscape connectivity, within a comprehensiv e territorial management approach.
2.2.1 Financial sustainability model for prioritised landscapes and fundraising strategy have been
developed.
2.2.2 Pilots of financial sustainability models implemented for PAs.
2.3.1. New PAs created in accordance with IUCN standards, including guidelines for other
effective area- based conservation measures (OECMs).
2.4.1 Landscape restoration plans (wetlands, deforested areas) development, including the recovery and valuation of ancestral restoration practices and use of degraded areas.
2.4.2
Strengthened apacities of local stakeholders to improve or innovate their restoration practices.
2.4.3 Landscape restoration pilots implemented.
GET 4,550,000.0 0
38,936,319.0 0
Project Compone nt
Financin g Type
Expected Outcomes
Expected Outputs
Tru st Fun d
GEF Project Financing($
)
Confirmed Co- Financing($)
3.-
Sustainable production practices for enhancing the value of biodiversity under sustainable protocols.
Investmen
t 3.1. Products
and services derived from the sustainable use of forests have added value, are integrated into value chains, have access to the market with quality and sustainability criteria and generate socioeconomic and
environmental benefits for local populations.
3.2.
Communities, support organizations, private sector and the government with strengthened technical, business and managerial capacities to develop sustainable companies and Biocommerce, based on the sustainable use of biodiversity products and services.
3.1.1 An innovative economic model developed, applied and promoted for sustainable products from ecosystems, taking into account the unique ecological, economic, and cultural features of the landscapes of origin.
3.1.2.
Products and services derived from biodiversity have added value, with duly strengthened value chains and increased processing capacity, and have access to the market under quality and
sustainability criteria within the new economic model.
3.1.3.
Sustainable biodiversity and
environment- friendly production systems incorporating good
practices are supported.
3.1.4.
Commercial strategy associated with the development of an umbrella brand for sustainable biodiversity products duly incorporated into value chains, under criteria of quality, sustainability and gender mainstreamin g, with emphasis on domestic and international preferential markets.
3.1.5.
Partnerships among producers, public and private sectors (4P), to leverage investments linked to zero deforestation value chains and local development.
3.1.6 Pilots to improve capacities of local
producers and entrepreneurs to deliver biodiversity products and services with added value and included in
ecobusiness value chains.
3.2.1.
Strengthened marketing and business planning capacities of communities and
stakeholders engaged in value chains.
3.2.2.
Improved policies and procedures related to the licensing and promotion of eco-
businesses based on sustainable forest products are improved.
3.2.3 Local and regional governments develop and implement ecobusiness investment projects in their multi- annual institutional operational plans.
3.2.4.
Targeted communicatio n strategy for consumer awareness and the promotion of Amazon ecobusinesses based on sustainable natural inputs is developed.
GET 7,879,615.0 0
54,527,683.0 0
Project Compone nt
Financin g Type
Expected Outcomes
Expected Outputs
Tru st Fun d
GEF Project Financing($
)
Confirmed Co- Financing($)
4.
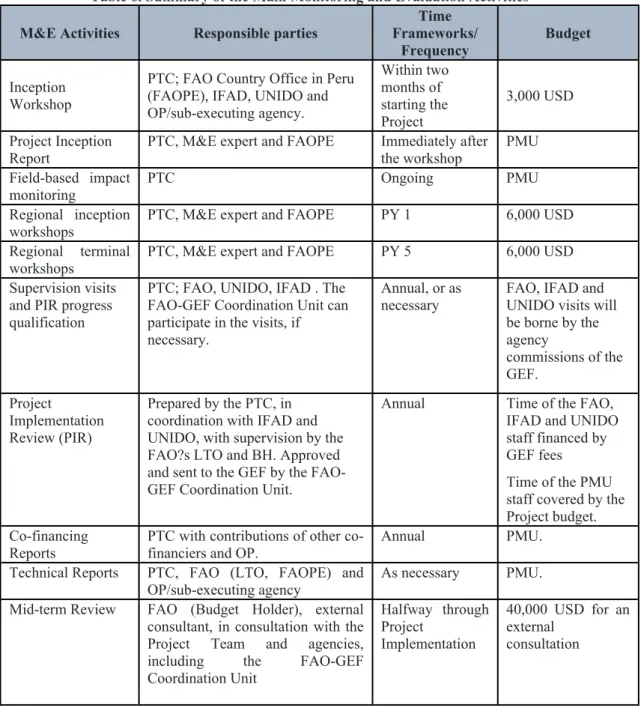
Knowledge management and
programme and project M&E.
Technical Assistanc e
4.1. Knowledge Management and
Communicatio ns.
4.2. Project follow-up and monitoring, and coordination and
management.
4.1.1.
Communicati on and awareness strategies on the value of Amazon biodiversity and the impact of the sectors driving deforestation (transport, agriculture, mining, etc.).
4.1.2.
Systematizati on and dissemination of
experiences and lessons learned from the Project strategy.
4.1.3.
Participation in alliances and cooperation agreements to exchange ASL2 programme experiences.
4.2.1. Project Monitoring Reports.
4.2.2 Mid- term Review (MTR) and final evaluation.
GET 1,075,497.0 0
11,938,073.0 0
Project Compone nt
Financin g Type
Expected Outcomes
Expected Outputs
Tru st Fun d
GEF Project Financing($
)
Confirmed Co- Financing($)
Sub Total ($) 14,856,270.
00
118,629,978.
00
Project Management Cost (PMC)
GET 742,813.00 5,931,498.46
Sub Total($) 742,813.00 5,931,498.46
Total Project Cost($) 15,599,083.00 124,561,476.46
C. Sources of Co-financing for the Project by name and by type Sources
of Co- financing
Name of Co-financier Type of Co- financing
Investment
Mobilized Amount($)
Recipient Country Government
Ministry of the Environment ? Research Institue of the Peruvian Amazon (IIAP)
Public
Investment Investment mobilized
5,172,565.00
Recipient Country Government
Ministry of the Environment ? National Service of Natural Areas Protected by the State (SERNANP)
Public Investment
Investment mobilized
6,844,937.00
Recipient Country Government
Ministry of the Environment ? Forest Conservation National Program (PNCB)
Public
Investment Investment mobilized
39,709,535.66
Recipient Country Government
Ministry of the Environment ? Environmental Assessment and Control Agency (OEFA)
Public Investment
Investment mobilized
418,789.00
Recipient Country Government
Technological Institute of Production ? Ministry of Production
Public
Investment Investment
mobilized 278,632.00
Recipient Country Government
Technological Institute of Production ? Ministry of Production
In-kind Recurrent
expenditures 2,047,103.00
Recipient Country Government
Peru Promotion Commission
for Export and Tourism In-kind Recurrent
expenditures 910,813.00
Recipient Country Government
Regional Government of
Ucayali Public
Investment Investment
mobilized 10,610,742.00
Recipient Country Government
Regional Government of
Ucayali In-kind Recurrent
expenditures
5,535,538.00
Recipient Country Government
Regional Government of Jun?n Public Investment
Investment mobilized
9,608,728.00
Sources of Co- financing
Name of Co-financier Type of Co- financing
Investment Mobilized
Amount($)
Recipient Country Government
Regional Government of Jun?n In-kind Recurrent expenditures
874,243.00
Recipient Country Government
Regional Government of Loreto Public
Investment Investment
mobilized 26,090,745.00
Recipient Country Government
Regional Government of Loreto In-kind Recurrent
expenditures 6,768,765.00
GEF
Agency FAO Grant Investment
mobilized 172,171.00
GEF Agency
FAO In-kind Recurrent
expenditures
702,540.00
GEF
Agency UNIDO Grant Investment
mobilized 113,000.00
GEF
Agency UNIDO In-kind Recurrent
expenditures 846,000.00 Private
Sector
AMARUMAYU ? AJE Group In-kind Recurrent
expenditures
2,200,000.00
Private
Sector National Society of Industries ?
SNI In-kind Recurrent
expenditures 324,844.00 Private
Sector
Association of Exporters ? ADEX
In-kind Recurrent expenditures
46,148.00
Recipient Country Government
Ministry of Agriculture and
Irrigation Public
Investment Investment
mobilized 3,555,829.00
Recipient Country Government
Ministry of Agriculture and
Irrigation In-kind Recurrent
expenditures 288,795.00
Sources of Co- financing
Name of Co-financier Type of Co- financing
Investment Mobilized
Amount($)
Recipient Country Government
Ministry of Environment MINAM
In-kind Recurrent expenditures
262,480.80
Recipient Country Government
Ministry of the Environment ? National Service of Natural Areas Protected by the State (SERNANP)
In-kind Recurrent
expenditures 1,178,533.00
Total Co-Financing($) 124,561,476.4 6 Describe how any "Investment Mobilized" was identified
Government: The Ministry of the Environment will implement a public investment projects that aim to strengthen forest landscape planning and governance, conservation and sustainable use in Atalaya, Ucayali and Loreto landscapes. Regional and local governments are expected to mobilize significant investments in target areas focus on land rights, governance, bio-business promotion and forest monitoring. The Ministry of Agriculture and Irrigation will implement public investments to recover degraded lands. FAO: FAO presents three ongoing projects for the sustainable management of forests and the inclusion of rural women in production programmes. The FAO and European Union (EU) Forest Law Enforcement, Governance, and Trade (FAO-EU FLEGT) Programme seeks to reduce illegal timber and improve forest governance.
Likewise, the "Reducing the Vulnerability of Rural Women in the Context of Climate Change" project seeks to strengthen the role of women in Amazon areas in order to promote their bio-businesses as well as to strengthen national and regional public policies in favour of women in the agricultural sector.
D. Trust Fund Resources Requested by Agency(ies), Country(ies), Focal Area and the Programming of Funds Agenc
y Trust
Fund Country Focal
Area Programmin
g of Funds Amount($) Fee($)
FAO GET Peru Biodiversity BD STAR
Allocation
5,302,797 477,251
IFAD GET Peru Biodiversity BD STAR
Allocation 1,320,684 118,861
UNIDO GET Peru Biodiversity BD STAR
Allocation
2,285,453 205,691
UNIDO GET Peru Climate
Change CC STAR
Allocation 900,120 81,011
FAO GET Peru Land
Degradation LD STAR
Allocation 900,120 81,011
UNIDO GET Peru Multi Focal
Area
IP SFM Amazon Set- Aside
1,979,110 178,120
FAO GET Peru Multi Focal
Area IP SFM
Amazon Set- Aside
1,516,551 136,490
IFAD GET Peru Multi Focal
Area IP SFM
Amazon Set- Aside
1,394,248 125,482
Total Grant Resources($) 15,599,083.00 1,403,917.00
E. Non Grant Instrument
NON-GRANT INSTRUMENT at CEO Endorsement
Includes Non grant instruments? No Includes reflow to GEF? No
F. Project Preparation Grant (PPG) PPG Required
PPG Amount ($) 300,000
PPG Agency Fee ($) 27,000
Agenc
y Trust
Fund Country Focal
Area Programmin
g of Funds Amount($) Fee($)
FAO GET Peru Biodiversity BD STAR
Allocation
140,110 12,610
IFAD GET Peru Biodiversity BD STAR
Allocation 49,268 4,434
UNIDO GET Peru Biodiversity BD STAR
Allocation 76,000 6,840
UNIDO GET Peru Climate
Change
CC STAR Allocation
17,311 1,558
FAO GET Peru Land
Degradation LD STAR
Allocation 17,311 1,558
Total Project Costs($) 300,000.00 27,000.00
Core Indicators
Indicator 1 Terrestrial protected areas created or under improved management for conservation and sustainable use
Ha (Expected at PIF)
Ha (Expected at CEO
Endorsement) Ha (Achieved at
MTR) Ha (Achieved at
TE)
0.00 7,909,260.00 0.00 0.00
Indicator 1.1 Terrestrial Protected Areas Newly created
Ha (Expected at PIF)
Ha (Expected at CEO
Endorsement)
Total Ha (Achieved at MTR)
Total Ha
(Achieved at TE)
0.00 0.00 0.00 0.00
Name of the Protecte d Area
WDP A ID
IUCN Category
Total Ha (Expected at PIF)
Total Ha (Expected at CEO
Endorsement)
Total Ha (Achieved at MTR)
Total Ha (Achieved at TE) Indicator 1.2 Terrestrial Protected Areas Under improved Management effectiveness
Ha (Expected at PIF)
Ha (Expected at CEO
Endorsement)
Total Ha (Achieved at MTR)
Total Ha
(Achieved at TE)
0.00 7,909,260.00 0.00 0.00
Nam e of the Prot ecte d Area
WDP A ID
IUCN Cate gory
Ha (Exp ecte d at PIF)
Ha (Expect ed at CEO Endors ement)
Total Ha (Achi eved at MTR)
Total Ha (Achi eved at TE)
METT score (Baseli ne at CEO Endors ement)
MET T scor e (Achi eved at MTR)
MET T scor e (Achi eved at TE)
Nam e of the Prot ecte d
Area WDP
A ID
IUCN Cate gory
Ha (Exp ecte d at PIF)
Ha (Expect ed at CEO Endors ement)
Total Ha (Achi eved at MTR)
Total Ha (Achi eved at TE)
METT score (Baseli ne at CEO Endors ement)
MET T scor e (Achi eved at MTR)
MET T scor e (Achi eved at TE) Akula
Natio nal Park Alto Nana y - Pintuy acu Cham bira
12568 9 55555 5657
Selec tOthe rs
954,635.
00
Akula Natio nal Park Alto Purus
12568 9 30331 6
Selec tNatio nal Park
2,510,69 4.00
75.00
Akula Natio nal Park Ashan inka
12568 9 30331 8
Selec tOthe rs
184,468.
00
61.00
Akula Natio nal Park El Sira
12568 9 30332 1
Selec tOthe rs
616,413.
00
66.00
Akula Natio nal Park Otishi
12568 9 30332 3
Selec tNatio nal Park
305,973.
00
60.00
Nam e of the Prot ecte d
Area WDP
A ID
IUCN Cate gory
Ha (Exp ecte d at PIF)
Ha (Expect ed at CEO Endors ement)
Total Ha (Achi eved at MTR)
Total Ha (Achi eved at TE)
METT score (Baseli ne at CEO Endors ement)
MET T scor e (Achi eved at MTR)
MET T scor e (Achi eved at TE) Akula
Natio nal Park Pacay a Samiri a
12568
9 249 Selec tProte cted area with sustai nable use of natur al resou rces
2,080,00 0.00
75.00
Akula Natio nal Park Pucac uro
12568 9 98228
Selec tProte cted area with sustai nable use of natur al resou rces
637,954.
00
72.00
Akula Natio nal Park Reser va Ind?g ena Murun ahua
12568
9 Selec
tOthe rs
470,305.
00
Akula Natio nal Park San Matia s San Carlo s
12568 9 20182
Selec tOthe rs
148,818.
00
59.00
Indicator 3 Area of land restored
Ha (Expected at PIF)
Ha (Expected at CEO
Endorsement) Ha (Achieved at
MTR) Ha (Achieved at
TE)
0.00 7900.00 0.00 0.00
Indicator 3.1 Area of degraded agricultural land restored
Ha (Expected at PIF)
Ha (Expected at CEO
Endorsement)
Ha (Achieved at MTR)
Ha (Achieved at TE)
4,810.00
Indicator 3.2 Area of Forest and Forest Land restored
Ha (Expected at PIF)
Ha (Expected at CEO
Endorsement) Ha (Achieved at
MTR) Ha (Achieved at
TE) 2,000.00
Indicator 3.3 Area of natural grass and shrublands restored
Ha (Expected at PIF)
Ha (Expected at CEO
Endorsement)
Ha (Achieved at MTR)
Ha (Achieved at TE)
Indicator 3.4 Area of wetlands (incl. estuaries, mangroves) restored
Ha (Expected at PIF)
Ha (Expected at CEO
Endorsement) Ha (Achieved at
MTR) Ha (Achieved at
TE) 1,090.00
Indicator 4 Area of landscapes under improved practices (hectares; excluding protected areas)
Ha (Expected at PIF)
Ha (Expected at CEO
Endorsement) Ha (Achieved at
MTR) Ha (Achieved at
TE)
0.00 15000.00 0.00 0.00
Indicator 4.1 Area of landscapes under improved management to benefit biodiversity (hectares, qualitative assessment, non-certified)
Ha (Expected at PIF)
Ha (Expected at CEO
Endorsement)
Ha (Achieved at MTR)
Ha (Achieved at TE)
Ha (Expected at PIF)
Ha (Expected at CEO
Endorsement) Ha (Achieved at
MTR) Ha (Achieved at
TE)
Indicator 4.2 Area of landscapes that meets national or international third party certification that incorporates biodiversity considerations (hectares)
Ha (Expected at PIF)
Ha (Expected at CEO
Endorsement) Ha (Achieved at
MTR) Ha (Achieved at
TE)
Type/Name of Third Party Certification
Indicator 4.3 Area of landscapes under sustainable land management in production systems
Ha (Expected at PIF)
Ha (Expected at CEO
Endorsement) Ha (Achieved at
MTR) Ha (Achieved at
TE) 15,000.00
Indicator 4.4 Area of High Conservation Value Forest (HCVF) loss avoided
Ha (Expected at PIF)
Ha (Expected at CEO
Endorsement) Ha (Achieved at
MTR) Ha (Achieved at
TE)
Documents (Please upload document(s) that justifies the HCVF)
Title Submitted
Indicator 6 Greenhouse Gas Emissions Mitigated Total Target Benefit (At
PIF) (At CEO
Endorsement) (Achieved
at MTR) (Achieved at TE) Expected metric tons of
CO?e (direct) 0 10641554 0 0
Expected metric tons of
CO?e (indirect) 0 0 0 0
Indicator 6.1 Carbon Sequestered or Emissions Avoided in the AFOLU (Agriculture, Forestry and Other Land Use) sector
Total Target Benefit
(At PIF)
(At CEO Endorsement)
(Achieved at MTR)
(Achieved at TE) Expected metric tons of
CO?e (direct) 10,641,554
Expected metric tons of CO?e (indirect)
Total Target Benefit
(At PIF)
(At CEO Endorsement)
(Achieved at MTR)
(Achieved at TE) Anticipated start year of
accounting
Duration of accounting 20
Indicator 6.2 Emissions Avoided Outside AFOLU (Agriculture, Forestry and Other Land Use) Sector Total Target Benefit
(At PIF)
(At CEO Endorsement)
(Achieved at MTR)
(Achieved at TE) Expected metric tons of
CO?e (direct)
Expected metric tons of CO?e (indirect)
Anticipated start year of accounting
Duration of accounting
Indicator 6.3 Energy Saved (Use this sub-indicator in addition to the sub-indicator 6.2 if applicable)
Total Target Benefit
Energy (MJ) (At PIF)
Energy (MJ) (At CEO
Endorsement)
Energy (MJ) (Achieved at MTR)
Energy (MJ) (Achieved at TE)
Target Energy Saved (MJ)
Indicator 6.4 Increase in Installed Renewable Energy Capacity per Technology (Use this sub-indicator in addition to the sub-indicator 6.2 if applicable)
Technolog y
Capacity (MW)
(Expected at PIF)
Capacity (MW) (Expected at CEO Endorsement)
Capacity (MW)
(Achieved at MTR)
Capacity (MW) (Achieved at TE)
Indicator 11 Number of direct beneficiaries disaggregated by gender as co-benefit of GEF investment Number
(Expected at
PIF) Number (Expected at CEO Endorsement)
Number (Achieved at MTR)
Number (Achieved at TE)
Female 5,280
Male 5,720
Total 0 11000 0 0
Part II. Project Justification
1a. Project Description
1) The global environmental and/or adaptation problems, root causes and barriers that need to be addressed (systems description).
1. There is a global environmental crisis, determined by the ongoing transformation and degradation of wild terrestrial and aquatic ecosystems, to a level that affects the whole biosphere.
As a result, biological diversity and fundamental ecosystem services are facing imminent threats, including the regulation of global climate. However, there are still large primary ecosystems in the world which are interconnected and barely altered; they perform as world biological diversity reserve, store high contents of carbon in the biomass and the soil, and contribute to the hydrologic cycle at a regional/global level. The Peruvian Amazon, water source of the Amazon River, is highly valuable at global, regional, and local levels, and is also a source of concern due to ongoing degradation and deforestation.
Loss and Degradation of the Amazon Ecosystem in Peru
2. In 2018, Peru had 68,4 million hectares of Amazon forest[1]. Between 2001 and 2018, the country lost more than 2 million hectares (3% with respect to 2000), at a yearly rate of 127,000 hectares[2]. The loss rate at these forests increased almost sustainably between 2001 and 2014 and has continued at around 154 and 164 thousand hectares per year between 2015 and 2018. In 2018, 154,766 hectares of tropical rainforest were lost, accounting for 0,73% with respect to the previous year (TABLE 01 of Annex 1 and MAPS 01 of Appendix E illustrate the changes described).
3. In terms of policy and administration, Peru is divided into departments, provinces, and districts.
At present, Peru has 24 departments, 196 provinces, and 1874 districts, out of which 11 departments, 66 provinces and 399 districts are totally or partially located in the Amazon. Table 1 summarizes all information related to the forest and non-forest surface area in the Peruvian Amazon.
4. At national level, Loreto is the department with the largest tropical forest (Amazon) surface area with more than 35 million hectares (ha), followed by Ucayali with more than 9 million ha, while Junin is in the seventh position with 1,8 million ha. Between 2001 and 2018, San Martin, Loreto, and Ucayali were the departments which lost most in terms of tropical forests. In 2018, those who suffered the most deforestation were Loreto (26,203 ha.) and Ucayali (25,991 ha). As far as forest loss in 2018, Loreto ranked first, followed by Ucayali, while Junin ranked seventh.
5. At provincial level, considering the three provinces within the scope of the Project, the province of Satipo, in the department of Junin, ranked fourth in terms of accumulated forest loss nationwide between 2001 and 2008, while the province of Atalaya, in Ucayali, ranked eighth with 81,409 ha.
and the province of Nauta, in Loreto, came in twenty third with 34,769 deforested ha. In 2018, Atalaya showed losses similar to those of Satipo, coming in sixth and seventh positions respectively, while the province of Nauta, in Loreto, came in twenty sixth.
6. The Atalaya and Satipo, provinces which belong to the Upper Ucayali-Inuya Landscape Paisaje Alto Ucayali-Inuya, suffer a significant forest deforestation and degradation problem, while the
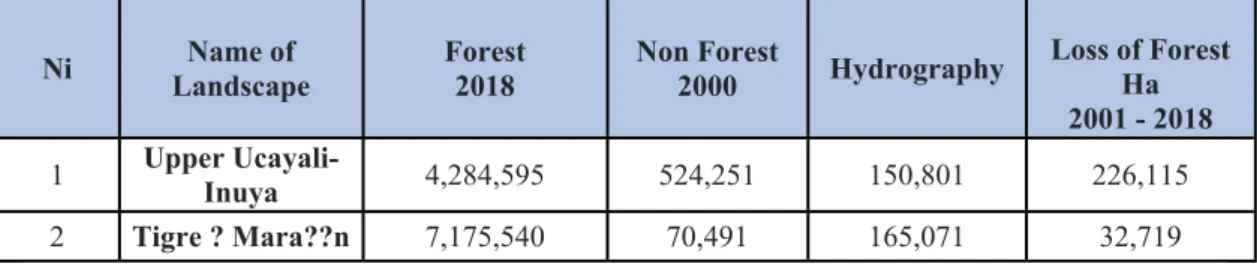
province of Loreto Nauta, located in the Tigre-Mara?on Landscape, does not show any major evidence of forest loss. Therefore, at the level of the Tigre-Mara?on and Upper Ucayali-Inuya landscapes, the greatest forest loss occurs in the Upper Ucayali-Inuya landscape, whose historical forest loss rates widely exceed those of the Tigre-Mara?on area, as shown below:
Table 1 Forest, Non-Forest, Hydrography and Loss between 2001-2018 within a Landscape (ha)
Ni Name of
Landscape Forest
2018 Non Forest
2000 Hydrography Loss of Forest Ha 2001 - 2018 1 Upper Ucayali-
Inuya 4,284,595 524,251 150,801 226,115
2 Tigre ? Mara??n 7,175,540 70,491 165,071 32,719
Source: Forest Conservation and Climate Change Mitigation National Program, Data up to 2018 (GEOBOSQUES, MINAM).
7. However, the Tigre-Mara?on landscape has hydromorphic ecosystems with high contents of carbon, which are being degraded and need to be preserved.
8. Worth mentioning is that these landscapes, which comprise 9 Protected Areas (PA) have an outstanding environmental value. Overall, the two landscapes include 7 Natural Protected Areas nationwide (NPA), 1 Regional Conservation Area (RCA), and 1 Territorial Reserve for Indigenous Peoples in Isolation and Initial Contact[3].
9. The Tigre-Mara?on landscape includes two national level NPAs (the Pacaya Samiria National Reserve and the Pucacuro National Reserve) and one RCA (Upper Nanay Pintuyacu Chambira). In addition, part of the Pastaza-Mara?on peatlands are located in this area, and store 32% of the carbon stock of the whole of South America, and 3,5% of that contained in all peatlands around the world[4]. Estimates indicate that if 1% of this area was affected (35,000 ha), approximately 115 million tons of equivalent CO2 could be emitted; this figure way exceeds the climate target Peru has committed to before the United Nations, and would have great repercussions worldwide[5]. 10. The Upper Ucayali-Inuya landscape includes 5 NPAs (El Sira Community Reserve, San Matias San Carlos Protection Forest, Otishi National Park, Ashaninka Community Reserve, Upper Purus National Park) and 1 Territorial Reserve for Indigenous Peoples Isolation and Initial Contact.
Details of these PAs are provided in ANNEX 2. The area of influence of the El Sira Community Reserve is the most affected by degradation processes, mainly due to illegal logging and change of land use caused by illicit activities carried out in the Pachitea Basin and in the mid-Ucayali districts of Iparia and Masisea; followed by the area close to the Ashaninka Community Reserve and the Otishi National Park in Satipo, and the area of influence of the San Matias San Carlos Protection Forest in Oxapampa[6].
11. These areas also have great socio-cultural importance. Indigenous peoples in isolation and initial contact[7] have been sighted north-east of the province of Loreto. Part of the proposed Napo Tigre Indigenous Reserve is found in the area of interest. It partially overlaps with the Pucacuro National Reserve and some native communities. The Indigenous Reserves of Murunahua and Mashco Piro are found in the Upper Ucayali-Inuya landscape; they were established in 2016 as intangible areas for the protection of indigenous peoples in isolation and initial contact in the communities of Mashco Piro, Murunahua, Mastanahua, Amahuaca, Chitonahua and others living
in those areas. Both indigenous reserves are part of the Purus Manu Conservation Corridor;
Maschco Piro totally overlaps with the NP Upper Purus, thereby increasing its level of protection.
This is why the Project will only focus on enhancing the Murunahua management.
Main Causes of Forest Biodiversity Loss
12. According to the National Strategy on Forests and Climate Change (ENBCC, 2016), the proportional distribution of different activities causing deforestation nationwide is the following:
Agriculture: 51,9%, Livestock: 39,9%, Illegal mining: 5,8%, Coca crops: 2,3%, Infrastructure and Extractive Industries: 0,3%. Available information suggests that the causes of deforestation and degradation of ecosystems in the area of intervention are similar, the structure being slightly different[8]. Existing evidence shows deeply rooted causes beyond agriculture, mining, infrastructure, illegal logging, and other activities. These causes support the theory of change contained in the Amazon Sustainable Landscapes Program.
13. a. Inadequate allocation or planning of land use, in other words allocating productive uses to areas that should otherwise be preserved. The productive uses referred to are agriculture, livestock, timber harvesting, mining, hydrocarbon exploitation, road and power infrastructure, and human settlements. The dominant process within the scope of the Project -and in the Amazon in general- is the change of land use, from forest to small or medium scale agriculture. This activity includes high rotation crops and generation of income in the short term, such as grain production;
medium term commercial crops, such as papaya and bananas; and perennial crops, such as cocoa cacao, coffee, and palm trees.
14. This deforestation is driven by agricultural production. Income is obtained by selling timber taken from the felling of complementary forests; such wood is not used in any significant way.
Once established, agricultural workers may request titles of possession with which they may later on obtain ownership titles. This represents a perverse incentive promoting forest conversion into agricultural lands. Large-scale farmers not only have access to the land through small and medium size producers, but also through the direct adjudication of vast areas of land for perennial crops such as oil palm trees. This is evident in the Upper Ucayali Inuya landscape. The affected forest area is partly a primary forest and partly a well-developed secondary forest, which has grown again after having been felled. Farmers use agricultural felling and burning techniques causing the soil to lose its fertility; moreover, new lands are turned into grasslands or perennial crops.
15. The expansion of the agrarian frontier is one of the most relevant deforestation factors in the Upper Ucayali Inuya landscape, particularly due to migrant population from the central and southern mountainside. The area most impacted is the Satipo province, located in the central jungle; this area is easily accessible to Andean migrants, where authorities have been readily granting titles or allocating rights over the land. In 2014, land used for farming purposes in this province exceeded land capacity by 247%, thus generating conflicts for land use and invasion of indigenous territories and NPAs. In the Upper Ucayali - Inuya landscape, coffee plantations that do not follow any environmental sustainability criteria are of concern. In Atalaya, coffee, cocoa, and bananas are the main crops leading to deforestation. In the Imiria RCA, Servindi has reported that a native community in the area ?denounced the expansion of irrigated rice crops, planted, and harvested with the use of machines?.
16. The establishment of grasslands for cattle and sheep farming has led to the initial de facto occupation of open access areas, the felling of trees, and the planting of pastures. The main purpose in their establishing pastures is land grabbing and speculation. Interested in diversifying into new crops, medium-size producers, who have the necessary resources to continue investing in livestock, tend to buy land from small livestock producers to sell to large scale breeders, thus generating working opportunities for small local producers and new migrants.
17. The legal extraction of non-renewable natural resources such as mining and oil is also linked to deforestation and degradation processes. These activities directly result in the felling of trees.
Moreover, the extraction of resources and infrastructure encourage immigration and agriculture in regions covered by forests. These activities have been increasing in the Peruvian Amazon. In the Tigre-Mara?on landscape, this activity has mainly affected the Pacaya Samiria National Reserve and its buffer area, as well as the buffer area of the Pucacuro National Reserve (blocks 39,67 y 192). Worth noting is the impact caused by hydrocarbon exploration and exploitation of blocks 108[9] and 57. This hydrocarbon activity also has a negative impact on the San Matias San Carlos Protected Forest (PF). Hydrocarbon activities also affect the Mascho Piro territorial reserve. The construction of the CCPF-Andoas oil pipeline and diluent line is planned[10].
18. Roads and energy infrastructure development projects also contribute to deforestation. In the Peruvian Amazon, the construction of new infrastructure and the enhancement of the existing one have had direct impact on ecosystems. Planning often focusses on the effectiveness and efficiency of this new infrastructure without taking into account its potential impact on ecosystems, such as its direct occupation (felling of trees) and fragmentation. In addition, and in a more indirect way, the construction of infrastructure has triggered uncontrolled migration towards areas previously inaccessible. This has resulted in an increase in land grabbing, deforestation, and inadequate extractive activities.
19. At present, there are 96,500 km of roads in the Peruvian Amazon. This figure is expected to increase considerably in the coming years, since major roads are currently being planned[11]. To- date, the following infrastructure works have been undertaken in these territories:
- Upper Ucayali Inuya landscape: Villa Rica - Puerto Bermudez National Road, crossing the San Matias- San Carlos Protection Forest.
- The Atalaya ? Satipo road in the Junin region: has allowed more mobility of people and products, and has boosted the dominant economic dynamic, including the illegal trafficking of wildlife.
- The motorized trail connecting Tournavista to Santa Cecilia de Pacache-Iparia: has impacted the El Sira Community Reserve.
- The construction of new access roads between 2017 and 2018 caused the deforestation of 353 ha. in an area north of the Imiria Regional Conservation Area, as reported by the MAPP[12] (Monitoring of the Andean Amazon Project).
20. In addition, other ecosystems in the area of intervention are at risk due to the following infrastructure works either planned or under construction:
- The Mara?on-Pastaza landscape is threatened by the construction of the 220 KV Moyobamba-Iquitos Transmission Line and Associated Substation[13] and the Iquitos- Saramiriza road project.
- The Upper Ucayali - Inuya landscape is also threatened by the Paquitzapango Hydroelectric Project[14].
- The Mascho Piro territorial reserve is threatened by the Pucallpa-Cruzeiro do Sul and Puerto Esperanza-I?apari road projects, as well as by the Brazil-Peru Transcontinental Railway Project.
21. Urban development has also resulted in the occupation of lands with high environmental value. Moreover, it is also the starting point for productive activities causing deforestation and degradation of valuable ecosystems. In the area of intervention, the cities of Atalaya and Satipo are growing rapidly and strongly; however, this growth is not the result of adequate planning. The city of Atalaya has become a main port for transportation of goods and supplies necessary to operate the Camisea gas project-the most important hydrocarbon project in the country. The city of Satipo directly connects with the cities of Lima, Cusco, and Ucayali.
Therefore, it is a strategic commercial enclave and the starting point for spontaneous colonization. Other human settlements have also been taking over more land for residential and productive purposes (industries and services), without any planning taking into account the main ecological structure.
22. b. Unsustainable use of landscapes. While land use may be well allocated, land is[15] not necessarily exploited in a sustainable manner. In the intervention area, agricultural practices tend to be inefficient and unsustainable, and use agropollutants. A few exceptional cases in Atalaya may be identified, with certified coffee and cocoa crop initiatives (or potentially eligible for certification). Harvest methods for "aguaje" (Mauritia flexuosa)- a native swamp palm-are particularly worrisome. The pulp of "aguaje" has high nutritional value. According to the Loreto Regional Government, there are more than 5 million hectares of "aguaje" in the region, of which only 69 thousand are held under management plans. Most of the "aguaje" fruits are harvested by cutting the female palm trees, therefore continuously increasing the area of degraded and non-productive ?aguajales? (swampy forests dominated by "aguaje" ). It is estimated that 24 thousand female "aguaje" palm trees are felled every year in Loreto only to satisfy local demand.
23. Excessive commercial fishing is also degrading the Peruvian Amazon ecosystem. The Ashaninka Community Reserve is a clear example of this, where commercial fishing during the fish migration season is depleting fish stock for neighbouring communities. In addition, overfishing has caused fish stock for human consumption to drop considerably in the Pacaya Samiria National Reserve. The same has occurred with other regionally important species like arapaima (?paiche?) and arowana (?arahuana?).
24. Mining and hydrocarbon exploitation activities tend to be carried out following non- sustainable methods. Tailings generated by mining operations are not often treated adequately, thus contaminating soil, water bodies, and particularly, in the case of hydrocarbons, polluting the air. In the Pacaya Samiria National Reserve, oil spills have been detected along the crude oil pipeline. In September 2019, the Ombudsman?s Office in Loreto reported on social conflicts linked to the contamination of indigenous territories as a result of oil operations. The
Apurimac and Quempiri Rivers at the Otishi National Park have been contaminated with chemical products used to produce cocaine base. Lastly, when operations end, platforms are abandoned and no remediation operations are carried out on the site.
25. In addition, new infrastructure is often built without taking actions to minimize the impact on ecosystems; this brings about massive land movements and felling of trees without adequate waste treatment and disposal, resulting in soil, flora, and water body contamination.
Frequently, infrastructure design does not consider actions to minimize environmental impact, but rather includes little green infrastructure and poor waste management which cause pollution. Furthermore, such designs do not foresee any compensatory strategies to favour connectivity.
26. Quite often, urban projects are not only developed in inadequate areas, but are also implemented without taking measures necessary to decrease environmental impact. Solid and liquid waste management at human settlements is a matter of great importance. In most cases, waste is disposed of without any treatment, thus contaminating soils, water, and air. In the province of Satipo, several rivers meet in their downflow from towns and villages in the Andes, and receive hundreds of effluents from mining operations[16]. They all flow into the Tambo river which is infested with waste. The Tambo and Ene rivers in the Otishi National Park are threatened by untreated sewage waters coming from cities in the highlands of Peru, thus dwindling fish population.
27. In addition to unsustainable practices, ecosystems degrade in areas of intervention due to the little integration of certain landscape categories. In other words, protected areas, buffer areas, and indigenous territories are not managed in an integrated manner and their functional links are therefore overlooked.
28. c. Development of illegal activities: In addition to the abovementioned factors (which may be to some extent formal or legal), we have to consider those activities which are openly illegal, such as illegal mining, illegal logging, illegal traffic of flora and wildlife, and coca production. Illegal mining has increased over the past years because of the rising price of gold.
In the Amazon, this activity is usually carried out by individual miners using rudimentary tools. Estimates indicate that more than 116,000 ha of critical wetlands[17] have been degraded in the department of Madre de Dios as a result of these activities. In August 2019, two dredgers were destroyed at the Upper Nanay RCA in the Tigre-Mara?on landscape, apparently because a community within the RCA was hosting illegal miners and loggers. Illegal mining is also increasing at the Upper Ucayali - Inuya landscape. The impact of these illegal practices is substantially stronger than those of legal mining.
29. Illegal logging and flora and wildlife trafficking, also affecting endemic and endangered species, contribute to deforestation and degradation. Selective cutting of trees with high commercial value is one of the first impacts in the land use change process. Illegal selective timber harvesting operations adopt cutting practices which severely impact the rest of the forest, thus creating favourable conditions for degradation processes based on the destruction of low forest strata; the forests are consequently more vulnerable to fire and invasive species. Like illegal timber trade, illegal capture and trading of wildlife species threaten biodiversity in the region. Poaching activities are key elements to understand this complex reality because of their illegal nature and
their occurring on rugged terrain with a broad diversity of species. In September 2019, social conflicts connected to violent acts committed by illegal timber loggers were reported in Satipo. In Atalaya, there is a strong incidence of illegal logging affecting the territories of native communities. People in this area are strongly engaged in timber activities, but do not generate any added value and have to endure long hours of river transportation which ultimately discourages any sustainable forest management. The Inuya river basin needs to be protected against illegal logging for several reasons: it is the most important basin in the Upper Ucayali - Inuya landscape; its inhabitants are peoples in initial contact; it is an area of influence of the Murunahua Indigenous Reserve for peoples in isolation; and it is located on the western edge of the Purus-Manu conservation corridor. The extraction and illegal trading of the taricaya turtle (Podocnemis unifilis) at the Pacaya Samiria National Reserve are of great concern. The illegal trade of taricayas and their eggs is also worrisome at the High Nanay-Pintuyacu-Chambira RCA, particularly in the Pintayacu river.
30. The illegal production of coca is also worth mentioning. Drug-trafficking is a growing activity in the areas of intervention; new coca plantations have been detected in the High Nanay Pintuyacu Chambira RCA and in the lowlands of the Tigre river, only a few hours away from the buffer area of the Pucacuro National Reserve[18], in the Tigre-Mara?on landscape. Coca plantations are increasingly impacting Atalaya. In Satipo, indigenous peoples are exposed to continuous invasions of their territories by illegal loggers and settlers engaged in coca farming for illegal trafficking. The Lima-Satipo-Lima road is one of the main routes used for the illegal trafficking of wildlife and other illegal forest products. Drug trafficking activities have taken over less accessible areas of the San Matias San Carlos PF.
31. d. Vulnerability of territories and communities to climate change. This situation contributes to forest degradation and deforestation in the Peruvian Amazon region, home to peoples and ecosystems that are highly vulnerable to the adverse effects of climate change.
This vulnerability results from several factors such as poverty, little coordination with authorities, weak development governance, and a productive baseline affected by climate factors, inter alia.
32. According to the Third National Communication (TNC) issued by the Ministry of the Environment (MINAM, 2016), temperature in the Peruvian Amazon has increased by 0,09?C every decade since 1965; recent studies have shown a decrease in rainfall since 1970 and a significant increase in the duration of the dry season since 1980. More frequent and more severe droughts have occurred in the past decades causing forest fires. It is estimated that tree mortality during droughts increased by 400% compared to normal years. Over the past three decades, there has been an increase in the mortality rate of biomass in the Amazon, causing forests to lose their capacity to absorb CO2. Only between 2005 and 2014, two historical droughts and three catastrophic floods have occurred. Moreover, the TNC states that rainfall outlooks vary between +10 % to -25 %, depending on the climate model used. Research conducted in 2013 shows slight increase in flows during the rainy season and significant drops in flows of the main Amazon rivers during the dry seasons, which would mean a longer dry season in the future. Warmer and drier conditions could also bring about irreversible damage to the Amazon forest; this reinforces the hypothesis of a possible ?savanna effect? on the Amazon. Overlapping climate and vegetation models have in fact predicted a shift from a tropical to a savanna type ecosystem during the second half of the XXI century.
33. On the other hand, the TNC reveals that, while there is still much uncertainty about the possible collapse of tropical forests in terms of intensity and scope, the water stress increase during dry seasons predicted to occur by the end of the XXI century and the increase of evapotranspiration would lead the Amazon to having a climate more favourable to a seasonal forest than the tropical forest we have today. This is a highly risky scenario, considering the important role the Amazon forest has in regulating the atmospheric humidity throughout the region.
34. Another risk associated to the loss of the Amazon forest is related to the vital role forest play in carbon sequestration and global carbon balance. The TNC reveals that years experiencing extreme droughts (producing forest fires) cause the Amazon to release higher amounts of CO2 into the atmosphere than those it captures. More frequent extreme droughts and deterioration of tropical forest would turn the Amazon region into a permanent source of CO2 emissions, thus increasing greenhouse gas (GHG) concentration in the atmosphere. This situation would be further exacerbated by potential changes of land use in the Amazon as a result of human activities, such as deforestation, expansion of agriculture, etc.
35. These changes in the climate variables could have direct or indirect adverse impacts on the Peruvian Amazon forest. The increase in temperature and the decrease in rainfall would directly impact the survival of certain endemic species; at the same time, they could favour the dispersion of invasive species. Moreover, the projected climate change directly increases the risk of more frequent, longer, and harsher forest fires. These have recently impacted several national parks in the area of intervention, such as the Otishi National Park. Likewise, the projected climate change could increase degradation in water bodies: as water evaporation increases, there are more pollutants mainly from mining and hydrocarbon related activities. Additionally, climate change (and its consequences such as the spread of pests and deceases) is expected to negatively affect yields of agricultural and livestock activities performed by people in the Peruvian Amazon region.
Indirectly, these changes could drive deforestation as agriculture and livestock could be regarded as alternative sources of income, and thus larger surface areas would be used for these activities to compensate for the drop in forest productivity.
36. Maps 6 and 13 of Appendix E provide graphs showing these deforestation and degradation factors of the Amazon ecosystems in the area of intervention. ANNEX 02 provides details on the abovementioned aspects, including information on the threats for each PA: Natural Protected Area, Regional Conservation Area, and Territorial Reserve in the area of intervention[19].
Main Barriers
37. Ecosystem degradation introduces a number of barriers to planning, management, and sustainable use of Amazon landscapes in the area of intervention. These may be grouped into: i) institutional weaknesses; ii) protected areas system; iii) economic aspects; and iv) information and knowledge management.
38. i) Barrier 1: Institutional Weaknesses. As shown in section 6b, Peru has made significant progress in developing its legal framework and public policies for sustainable development during the past twenty-five years. The Ministry of the Environment was created a decade ago at the highest level of government. This agency is responsible for promoting the environmental management agenda in all sectors and at all levels of the State. Moreover, the creation of the
National Forest and Wildlife Service (SERFOR), the Agency for the Supervision of Forest Resources and Wildlife (OSINFOR), and the transfer of functions and duties to regional governments have assigned different forest related responsibilities both horizontally and vertically, in order to promote the sustainable management of forest and wildlife resources. To achieve this goal, Peru has several decentralized territorial planning tools, including the Regional and Provincial Concerted Development Plans, the Economic Ecological Zoning (EEZ) Plans, and the Forest Zoning (FZ) Plans. The forest zoning process contains 4 modules and is currently being implemented throughout the country, mainly in the Amazon; it is binding for the granting of forest harvesting rights. The Forest Zoning Plan was approved by the current Forest and Wildlife Law (29763) and complements the EEZ Plan. Among the various management tools, we can mention:
water resource management plans for basin management; forest and wildlife management plans to grant forest concessions and permits; master plans for natural protected areas; and native communities? life plans.
39. At the regional level, there are several planning instruments for the Environment sector, such as the Regional Climate Change Strategy (ERCC) and the Regional Strategy for Biological Diversity (ERDB), which are not being implemented as expected[20].
40. At the institutional level, and taking into account the diverse stakeholders involved in land management, the country has developed a number of institutional coordination platforms. Their goal is to closely coordinate the work of water resources management councils, environmental commissions (national, regional, and municipal), regional conservation systems, oversight and monitoring regional roundtables, and national and regional forest roundtables.
41. Despite all the progress achieved, there are important institutional barriers to the conservation and sustainable use of Amazon ecosystems in the area of intervention. There is a need to develop planning policies and instruments, and to enhance existing ones:
? Not all of the necessary policies and planning instruments are in place. For example, and within the scope of the Project, a significant area does not have a EEZ (particularly in Loreto) or a FZ (particularly in Junin). Other instruments, such as the Assignment in Use Contracts for Agroforestry systems, essential to restore degraded areas, have not been used either. Moreover, no plans have been developed to prevent forest fires.
Some of the existing plans and policies are short-term and will expire in 2021 or 2030;
consequently, it is very difficult to develop any strategic planning thereafter.
42. At present, some of the existing plans and policies, such as EEZ, FZ, master plans for PA, the river basin life and management plans are elaborated independently, and are not necessarily compatible or coordinated with each other either at a horizontal or vertical levels; compromising as a result the sustainable management of the Amazon. There are indeed important inconsistencies in terms of planning in the areas of intervention.
43. In addition, spaces, platforms, and incentives for the exchange of information and the joint and coordinated planning and implementation are very weak.
44. The internal organization of some regional governments is not efficient.
There are still some forest related functions yet to be transferred to regional governments; to date, they are still under the purview of SERFOR.
While there are few inter- and intra-sectorial dialogue and consultation spaces, these are not available at all levels. For example, Loreto Nauta does not have a forestry round-table; Loreto and Ucayali do not have spaces to promote non-timber products; the RAMSAR site, located in the Loreto landscape, does not have a local Management Committee promoting its conservation and categorization; and the Project?s landscapes do not have any River Basin Water Resources Councils.
45. Availability and exchange of information is also weak. Forest and wildlife records, necessary to create forest and wildlife production statistics, are inadequately managed. This is particularly noticeable in the records related to non-timber forest products.
46. As far as monitoring of natural resources and the enforcement of policies is concerned, laws and regulations, the country has made progress in monitoring its forests; however, the area of intervention does not have enough Community Oversight Committees (COC) in territories occupied by native communities. These communities require much support to be set up and to be able to operate and coordinate their activities with the government. In the area of intervention, there are barely 27 of those communities in Atalaya and 10 in Satipo. No detailed information is available for Loreto Nauta.
47. While this situation is more evident at a national level, coordination between Peru and other countries sharing the Amazon (i.e. Ecuador in the Tigre basin and Brazil in the Yurua basin) is quite weak.
48. ii) Barrier 2: Weaknesses in the protected area management system. Ever since the establishment of the National System of Protected Areas, Peru has made considerable progress in preserving its natural heritage. At present, there are 75 areas under national administration plus 25 regional conservation areas and 136 private conservation areas[21]. Moreover, certain areas in the Amazon have been declared territorial reserves by the State in order to safeguard the well-being and survival of indigenous peoples in isolation. Entry to these areas is strictly forbidden; as a result, they operate as highly protected areas[22] and contribute to ecological connectivity. As mentioned earlier, the intervention zone includes 2 national parks, 2 national reserves, 2 community reserves, 1 protection forest, 1 area of regional conservation, and 2 territorial reserves, covering an area of 5,8 million ha. i.e.40,5% of the surface area of both landscapes.
49. Peru has classified vast areas with high environmental value as Protected Areas (PA). These include Natural Protected Areas from the National System of Protected Areas (SINANPE) and Other Effective Area-based Conservation Measures (OECMs) to foster their conservation.
Additionally, Peru has made great efforts to restore certain natural areas with great potential in the intervention zone. Between 2007 and 2019, the government generated 255 projects (whether approved or feasible) to recover ecosystem services, with a total investment of USD 272,4 million.
Twelve (12) projects have been implemented in Loreto totalling USD 31,6 million, 9 projects in Ucayali totalling USD 9,4 million, and 19 projects in Junin (between the Andes and the Amazon) totalling USD 29,1 million.