Abstract—Traditional approaches used in sample calculation for superiority trials comparing two low proportions usually provide very large sample sizes. Furthermore, such calculations may be inaccurate due to asymptotic normality that is often assumed but may not hold in such cases. Bayesian approach could reduce sample size by integrating historical information prior to data collection. It allows also single arm design to be conducted e.g. when it would not be ethical to enroll participants into a control group. In this analysis, a 1:1 randomized two-arm Bayesian trial designed to test for superiority was compared in terms of power and Bayesian Type I error with 1) a single-arm Bayesian trial and 2) a two-arm frequentist trial. Via Monte Carlo simulations, sample sizes required and trial powers were compared for various scenarios of efficacy results, using various prior distributions. Our analysis was applied to a real-world case study in the area of a trial to test the efficacy of a strategy to reduce mother-to-child transmission of HIV.
As a result, regardless of the prior distributions used, power to detect superiority was found systematically higher with single-arm Bayesian design compared to two-arm Bayesian
Manuscript received December 22, 2015; revised January 8, 2016. Patumrat Sripan received scholarships from Faculty of Science, Kasetsart University and the Graduate School Kasetsart University to participate this conference. She received a scholarship of French Embassy in Thailand and Science Achievement Scholarship of Thailand for her PhD study.
Patumrat Sripan is with Department of Statistics, Faculty of Science, Kasetsart University, Bangkok, Thailand; Institut de Recherche pour le Développement (IRD) UMI 174-PHPT, Marseille, France and Ecole Doctorale de Santé Publique, Université Paris Saclay, Paris, France ([email protected])
Lily Ingsrisawang is with Department of Statistics, Faculty of Science, Kasetsart University, Bangkok, Thailand (corresponding author, phone: +66 2 5625555 ext 3873; e-mail: [email protected]).
Billy Amzal is with LASER Analytica, London, UK ([email protected])
Sophie Le Cœur is with Institut National d'Etudes Démographiques (INED), Paris, France; Institut de Recherche pour le Développement (IRD) UMI 174-PHPT, Marseille, France and Department of Medical Technology, Faculty of Associated Medical Science Chiang Mai University, Chiang Mai, Thailand ([email protected])
Tim R. Cressey is with Institut de Recherche pour le Développement (IRD) UMI 174-PHPT, Marseille, France; Department of Medical Technology, Faculty of Associated Medical Science, Chiang Mai University, Chiang Mai, Thailand and Harvard T.H. Chan School of Public Health, Boston, MA, USA ([email protected])
Marc Lallemant is with Institut de Recherche pour le Développement (IRD) UMI 174-PHPT, Marseille, France. This author contributed equally as last authors to this work ([email protected])
Saïk Urien is with EAU08 Université Paris Descartes, Sorbonne Paris Cité, Paris, France; Unité de Recherche Clinique Necker Cochin, AP-HP, Hôpital Tarnier, Paris, France and CIC1419 INSERM, Cochin-Necker, Paris, France ([email protected])
design. However when the size of the effect becomes smaller, the power of a two-arm Bayesian design becomes higher than single-arm. In our case study, using the model predictive prior for the experimental arm (transmission rate decrease from 2.3% to 0.7%), power to detect superiority (RR<1) could reach 80% with optimistically as low as 50 subjects. In the two-arm frequentist design, using Farrington and Manning method, the power to demonstrate superiority of the experimental over control arm would be far below 80% with 350 subjects (34% power). Similarly, in a two-arm Bayesian design, the power would not reach 80% using a prior set identical to the predictive prior in the control arm or the inflated 170% coefficient of variation (CV). Finally, based on single-arm Bayesian design, power reaches 80% with 350 subjects when using the inflated 170% CV to the control arm predictive prior.
Index Terms—Bayesian approach, rare outcome, relative risk, superiority, historical prior
I. INTRODUCTION
Superiority testing of a new medical treatment or new strategy over the standard of care (control) is often required for regulatory registration. When the standard of care is highly efficacious the probability of the outcome may be very low, thus a large sample size is required to demonstrate superiority. When a superiority test is based on the absolute difference, it is poorly meaningful to compare low proportions (i.e. standard of care (θ1) with a new treatment (θ2)) when the reference θ1 is close to zero. It is then more relevant to use relative risks and odds ratios to test for superiority since both θ1 and θ2 are positive numbers between 0 and 1. When the probability of the outcome is low, relative risks and odds ratios are quite similar but relative risks are easier to interpret.
Based on relative risk, Farrington and Manning [1] proposed to replace the sample proportions with the restricted maximum likelihood estimates of θ1and θ2 under the null hypothesis to improve the accuracy of the sample size calculation. However, this frequentist approach is based on asymptotic normality and may be inaccurate for the risk distribution of rare event.
Bayesian methods are powerful alternatives to sample size calculation for sequential study designs. Bayesian calculations combine historical information with data to be prospectively collected [2]. Typically, historical data are only available from a control arm and act as prior information for the concurrent control. Non-informative
A Sample Size Calculation of Bayesian Design
for Superiority Trials with
Rare Events
prior distributions are used when prior information is not available.
The objective of the present analysis is to compare the statistical performances (power to detect superiority and Bayesian Type I error) of different clinical trial designs based on a Bayesian or frequentist framework using relative risk to determine superiority. Based on a simulation study, a two-arm Bayesian study design was compared with 1) a single-arm Bayesian design [3]; and 2) a two-arm frequentist design. The sample size calculation based on Bayesian predictive probability [4], [5] was used for Bayesian design whereas Farrington and Manning methodology was used for frequentist design.
Finally, we apply our analysis to a case study: PHPT-5 clinical trial (NCT01511237) [6], phase III clinical trial to evaluate the efficacy of an antiretroviral (ARV) intensification strategy to reduce the risk of transmission of HIV from mother to infant during labor and delivery. This clinical trial used a single-arm Bayesian design as the inclusion since a control arm was not possible for ethical reasons. Prior knowledge was obtained from historical data collected within other perinatal trials performed in the same clinical setting. The statistical power to detect superiority of the proposed strategy over the standard of care in the PHPT-5 second phase trial—a single-arm Bayesian trial—was compared to a two-arm Bayesian and to a frequentist study design.
II. PROCEDURE FOR SAMPLE SIZE CALCULATION USING A BAYESIAN APPROACH
Suppose that in a two-arm study, nCONTsubjects are randomized to receive the standard treatment (active control) and nEXPsubjects randomized in the experimental arm. Let yCONT and yEXP denote the number of outcomes in the corresponding treatment groups observed over a pre-defined follow-up study period, we further assume that
CONT
y and yEXP are independent and follow binomial distribution with probability of interestCONT and EXP,
respectively.
CONT CONT CONT
y Binomial( ,n )
EXP EXP EXP
y Binomial( ,n )
The sample size to demonstrate the superiority of the new strategy over standard of care was calculated under the following hypothesis:
0 EXP CONT
H : versusH :1 EXP CONT or H : RR0 R0versusH : RR1 R0
UnderH , we chose a relative risk 0 R =1. Accordingly, 0 the sample size to achieve 80% power can be determined. The procedure for sample size calculation based on predictive probability was as follow:
a)Step 1: Computing the posterior distribution
For each implementation of the simulations, we assumed that the risk distribution in the control arm and in the experimental arm followed Beta distributions.
CONT CONT CONT
ˆ ~ Beta( a ,b )
EXP EXP EXP
ˆ ~ Beta( a ,b )
This is determined for each arm, based on the observed data and the prior distribution. The posterior probability distributions for each group follow a beta form as follow:
CONT ~ Beta( aCONT yCONT,bCONT nCONT yCONT)
EXP~ Beta( aEXP yEXP,bEXP nEXP yEXP)
b)Step 2: Simulating outcomes
OutcomesˆyCONT and ˆyEXP to be observed were simulated
from predictive distributions based on CONT and EXPgiven the respective sample sizes nCONT and nEXP:
CONT CONT CONT
ˆy ~ Binomial( n , )
EXP EXP EXP
ˆ
y ~ Binomial( n , )
In the single-arm design, nEXPsubjects enroll only in the experimental arm.
TOTAL EXP
n n
For the two-arm design, a 1:1 randomization scheme is considered.
CONT EXP
n n =n
2
TOTAL
n n
c)Step 3: Simulating posterior distributions on risk of events
In the single-arm design, the posterior outcome risk in the experimental arm,EXPwas simulated, whereas the risk in the control group could only be predicted from the historical estimate (ˆCONT).
In the two-arm design, the simulated risk for each arms are:
CONT ~ Beta( aCONT ˆyCONT,bCONT nCONT ˆyCONT)
EXP ~ Beta( aEXP ˆyEXP,bEXP nEXP ˆyEXP)
d)Step 4: The relative risk prediction
e)Step 5: Predictive power
We repeated 20,000 replicates from step (1) to step (4) to obtain the set of predicted relative risk. The prospective sample size nTOTAL can demonstrate the superiority of the
new strategy to the standard care if the probability of RR<R0 was higher than 80%.
III. CHOICE OF PRIOR DISTRIBUTION
The choice of the prior distribution impacts the sample size calculation. When historical data are not available, a non-informative prior is typically used for proportion parameters. Alternately, when relevant data from previous trials are available, prior distribution informed by historical data can be used [2]. A prior estimated using historical data could be used for the control arm. We investigated the performance of the designs using different sets of non-informative prior distributions for the experimental including flat prior, Beta (1, 1) and Jeffreys' prior, Beta (0.5, 0.5)[7].
We also proposed the three different historical priors for the experimental arm as follows.
1)A model predictive prior: a prior estimated through linear mixed model using historical data.
2)A prior similar to the control arm prior: a prior set identical to the control arm.
3)A prior with a 170% inflated coefficient of variation (CV) in the control arm. The CV corresponds to the standard deviation divided by the mean of the distribution of the risk. Since the CV of the model predictive prior for the control arm was assumed to at 85%, we used an inflated CV set to twice the CV of model predictive prior (170%) to reflect the hypothesis that the distribution of the risk in the experimental arm was close to the distribution of the risk in the control arm but less likely than a prior set identical to the control arm.
Shape parameters based on estimates from historical data were computed given the mean and variance [8]. For a beta density with mean m and standard deviation s the shape parameters, a and bare
Beta( a,b )
2 m( 1 m )
a m 1
s
(1)
2 m( 1 m )
b ( 1 m ) 1
s
(2)
IV. SIMULATION STUDY
In this section, using several sets of simulated data we compared sample sizes from three designs including 1) single-arm Bayesian design, 2) two-arm Bayesian design and 3) frequentist design (Farrington and Manning method). In the two-arm design, the sizes were set such as nCONT =nEXP = {25, 50, 75, 100, 125, 150, 175}. Therefore the total sample sizes including the control and the experimental arm in the 1:1 randomization scheme, is nTOTAL = nCONT +nEXP = {50, 100, 150, 200, 250, 300, 350}. To be comparable with
the single-arm design, the sample sizes of the experimental arm nEXP should be= {50, 100, 150, 200, 250, 300, 350}.
a) Evaluation of power to detect superiority
Power to detect superiority = 1-Probability (RR ≥1/H1 is true).
Assuming that H0 was true, the true θCONT value was 0.03 and the true θEXP values were {0.003, 0.006, 0.015}. Various θEXP values were used in order to evaluate power when the true effect size varies. The dataset was simulated 20,000 times assuming that the distribution of the outcome followed a binomial distribution with nCONT = nEXP =10,000.
b) Evaluation of Type I error
Bayesian Type I error=Probability (RR<1/H0 is true) Assuming that H0 was true, true θCONT values were {0.003, 0.006. 0.015) and the true θEXP value was 0.03. Various θCONT values were used to evaluate the Type I error when effect sizes differ. Using 20,000 replicates, the binomial data were simulated with nCONT = nEXP =10,000.
c)Simulated historical prior
In the control arm, historical prior of risk distribution was defined with 85% CV of the true parameter assuming that some uncertainty could not be explained by using the model based tool with the historical data. A 85% CV was also assumed for the experimental arm as model predictive prior (optimistic prior).
V. CASE STUDY: MOTHER-TO-CHILD TRANSMISSION (MTCT) OF HIV
The high efficacy of current preventive strategies lead to MTCT rates as low as 2% or less. Consequently, the demonstration of the superiority of a new drug, drug combinations or strategies for the prevention of mother to child transmission (PMTCT) over an active control with already high efficacy requires large sample sizes.
PHPT-5 second phase was a single arm, Bayesian phase III clinical trial to evaluate the efficacy of an experimental strategy, i.e. ARV intensification to reduce the transmission risk during labor and delivery (intra-partum transmission) in women initiating ZDV+3TC+LPV/r late during pregnancy (cARV duration ≤ 8 weeks). The ARV intensification was defined as single dose NVP at onset of labor for women, and for neonates ZDV+3TC+NVP for 2 weeks followed by 2 weeks ZDV+3TC (experimental arm). In our study, this designed was compared with an hypothetical two-arm design, with a control arm composed of women also initiating therapy late during pregnancy (received ZDV+3TC+LPV/r for 8 weeks or less) but who did not receive the experimental strategy, i.e. ARV intensification.
a)Historical prior
A previous analysis [9] had investigated the predictors of intra-partum transmission using previous perinatal trials, (PHPT-1(NCT00386230) [10], PHPT-2(NCT00398684) [11] and PHPT-5 first phase (NCT00409591) [12]).
therapy (cART) less than 8 weeks in these previous trials and did not receive any ARV intensification. The prediction of the model provided the prior information that was used in the clinical trial design.
The predicted risks of intra-partum transmission of the control arm and experimental arm were ˆCONT= 0.023 ± 0.028 and ˆEXT=0.007 ± 0.016, respectively.
1)Prior distribution for control arm
Shape parameters were computed given the means and variances using (1) and (2).
0 64 27 CONT
ˆ Beta( . , )
2)Prior distribution for experimental-arm.
We used the model historical prior estimate for the experimental arm together with two different choices of prior including a prior set identical to the control arm and a prior with 170% inflated CV to the control arm.
VI. RESULTS
a) Power comparison
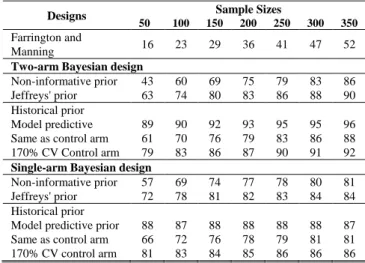
Table I, Table II and Table III show the power to detect superiority with the θEXP varying as 0.003, 0.006, 0.015 compared to a θCONT =0.03 in order to evaluate the power when the effect size varies.
TABLE I
POWER (%) WITH θCONT =0.03 AND θEXP =0.003 BASED ON VARIOUS PRIOR DISTRIBUTIONS FOR
EXPERIMENTAL ARM AND SAMPLE SIZES.
Designs Sample Sizes
50 100 150 200 250 300 350
Farrington and
Manning 18 28 36 44 51 58 63
Two-arm Bayesian design
Non-informative prior 45 63 74 81 85 89 91 Jeffreys' prior 67 78 85 89 91 93 94 Historical prior
Model predictive prior 95 96 97 98 98 99 99 Same as control arm 62 72 79 84 87 90 92 170% CV control arm 82 87 90 92 94 95 96
Single-arm Bayesian design
Non-informative prior 61 74 80 83 85 87 88 Jeffreys' prior 77 84 87 88 90 91 90 Historical prior
Model predictive 95 94 94 94 94 95 94 Same as control arm 69 77 80 84 86 87 88 170% CV control arm 86 89 90 91 92 92 92
TABLE II
POWER (%) WITH θCONT =0.03 AND θEXP =0.006 BASED ON VARIOUS PRIOR DISTRIBUTIONS FOR
EXPERIMENTAL ARM AND SAMPLE SIZES.
Designs Sample Sizes
50 100 150 200 250 300 350
Farrington and
Manning 16 23 29 36 41 47 52
Two-arm Bayesian design
Non-informative prior 43 60 69 75 79 83 86 Jeffreys' prior 63 74 80 83 86 88 90 Historical prior
Model predictive 89 90 92 93 95 95 96 Same as control arm 61 70 76 79 83 86 88 170% CV Control arm 79 83 86 87 90 91 92
Single-arm Bayesian design
Non-informative prior 57 69 74 77 78 80 81 Jeffreys' prior 72 78 81 82 83 84 84 Historical prior
Model predictive prior 88 87 88 88 88 88 87 Same as control arm 66 72 76 78 79 81 81 170% CV control arm 81 83 84 85 86 86 86
TABLE III
POWER (%) WITH θCONT =0.03 AND θEXP =0.015 BASED ON VARIOUS PRIOR DISTRIBUTIONS FOR
EXPERIMENTAL ARM AND SAMPLE SIZES.
Designs Sample Sizes
50 100 150 200 250 300 350
Farrington and
Manning 10 13 15 18 20 22 24
Two-arm Bayesian design
Non-informative prior 38 48 56 60 63 66 68 Jeffreys' prior 56 62 66 68 70 71 74 Historical prior
Model predictive prior 71 73 75 76 78 80 80 Same as control arm 57 61 65 68 70 72 74 170% CV control arm 70 71 72 73 75 77 77
Single-arm Bayesian design
Non-informative prior 48 55 58 60 61 62 62 Jeffreys' prior 61 63 64 65 65 65 65 Historical prior
Model predictive 69 68 68 68 68 68 68 Same as control arm 58 61 62 63 63 64 65 170% CV control arm 70 68 67 67 67 67 67
Based on our simulation study, we found that when the size of the effect is large, even non-informative prior can be used when historical data are not available. However, historical prior improve the power compared to non-informative prior. Regardless the prior distributions used, the power to detect superiority (RR<1) was generally higher in single-arm Bayesian design compared to two-arm Bayesian design with larger effect size. In contrast, when the size of the effect was smaller, the power became higher in two-arm Bayesian design.
b) The evaluation of Type I error based on simulation study
design compared to the single-arm Bayesian design for all prior distributions. Patterns of Type I errors are similar regardless the effect size.
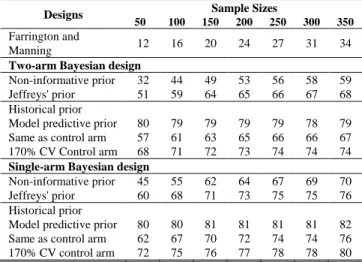
c) Power evaluations in case study
TABLE IV
POWER IN CASE STUDY: MTCT OF HIV BASED ON VARIOUS PRIOR DISTRIBUTIONS FOR EXPERIMENTAL ARM AND SAMPLE SIZES.
Designs Sample Sizes
50 100 150 200 250 300 350
Farrington and
Manning 12 16 20 24 27 31 34
Two-arm Bayesian design
Non-informative prior 32 44 49 53 56 58 59 Jeffreys' prior 51 59 64 65 66 67 68 Historical prior
Model predictive prior 80 79 79 79 79 78 79 Same as control arm 57 61 63 65 66 66 67 170% CV Control arm 68 71 72 73 74 74 74
Single-arm Bayesian design
Non-informative prior 45 55 62 64 67 69 70 Jeffreys' prior 60 68 71 73 75 75 76 Historical prior
Model predictive prior 80 80 81 81 81 81 82 Same as control arm 62 67 70 72 74 74 76 170% CV control arm 72 75 76 77 78 78 80
Table IV shows power according to different design with sample sizes ranging from 50 to 350 and ˆCONT and
EXP
ˆ
defined as 0.023 and 0.007, respectively. The power is higher in the single-arm design using all prior distribution compared to the two-arm design. Power does not reach 80 % when using a non-informative prior or the same prior in the experimental and control arm. Using the model predictive prior for the experimental arm, power to detect superiority (RR<1) could reach 80% with optimistically as low as 50 subjects.
Using the Farrington and Manning method, the power to demonstrate superiority of the experimental over control arm would be far below 80% with 350 subjects (34% power only) and it would require 1,426 subjects to reach 80% power. Similarly, power could not reach 80% with 350 subjects in a two-arm design using a prior set identical to the predictive prior in the control arm or the inflated 170% CV. However, with the single-arm design using the inflated 170% CV to control arm predictive prior, the power would reaches 80% with only 350 subjects.
VII. CONCLUSION
When the effect size is large, non-informative priors can be used in the experimental arm. However, increased power could be provided by using the priors set identical to the model predictive prior of the control arm or with an inflated 170% CV. Generally, power is higher in single-arm design than in two-arm design regardless of the prior distribution when the effect size is large. In contrast, when the true effect size is smaller, power is higher in the two-arm Bayesian design.
ACKNOWLEDGMENT
We would like to thank all members of hospital teams, and patients who participated in PHPT studies from which we used as historical data. We are also grateful to Dr. Patrinee Traisathit for statistical advices.
REFERENCES
[1] C. P. Farrington and G. Manning, “Test statistics and sample size formulae for comparative binomial trials with null hypothesis of non-zero risk difference or non-unity relative risk,” Stat Med, vol. 9, no. 12, pp. 1447–1454, Dec. 1990.
[2] D. J. Spiegelhalter, K. R. Abrams, and J. P. Myles, Bayesian Approaches to Clinical Trials and Health-Care Evaluation. John Wiley & Sons, 2004.
[3] K. Viele, S. Berry, B. Neuenschwander, B. Amzal, F. Chen, N. Enas et al., “Use of historical control data for assessing treatment effects in clinical trials,” Pharmaceut. Statist., vol. 13, no. 1, pp. 41–54, Jan. 2014.
[4] Bruno Lecoutre, “Bayesian predictive procedure for designing and monitoring experiments,” Bayesian Methods with Applications to Science, Policy and Official Statistics, Luxembourg: Office for Official Publications of the European Communities, pp. 301–310, 2001.
[5] S. C. Choi and P. A. Pepple, “Monitoring Clinical Trials Based on
Predictive Probability of Significance,” Biometrics, vol. 45, no. 1, pp.
317–323, 1989.
[6] M. Lallemant, B. Amzal, S. Urien, P. Sripan, T. R. Cressey, N. Ngo-Giang-Huong, et al., “Antiretroviral Intensification to Prevent
Intrapartum HIV Transmission in Late Comers,” in the IAS Conf. on HIV Pathogenesis, Treatment and Prevention, Vancouver, British Columbia, Canada, 2015.
[7] S. H. Jeffreys, The Theory of Probability, Third Edition. Oxford Classic Texts in the Physical Sciences, 1998.
[8] John K. Kruschke, Doing Bayesian Data Analysis: A Tutorial with R and BUGS, 1 edition. Burlington, MA: Academic Press, 2010. [9] P. Sripan, S. Le Coeur, B. Amzal, L. Ingsrisawang, P. Traisathit, N.
Ngo-Giang-Huong, et al., “Modeling of In-Utero and Intra-Partum Transmissions to Evaluate the Efficacy of Interventions for the
Prevention of Perinatal HIV,” PLoS ONE, vol. 10, no. 5, p. e0126647,
2015.
[10] M. Lallemant, G. Jourdain, S. Le Coeur, S. Kim, S. Koetsawang, A. M. Comeau, et al., “A trial of shortened zidovudine regimens to prevent mother-to-child transmission of human immunodeficiency
virus type 1. Perinatal HIV Prevention Trial (Thailand) Investigators,”
N. Engl. J. Med., vol. 343, no. 14, pp. 982–991, Oct. 2000.
[11] M. Lallemant, G. Jourdain, S. Le Coeur, J. Y. Mary, N. Ngo-Giang-Huong, S. Koetsawang, et al., “Single-dose perinatal nevirapine plus standard zidovudine to prevent mother-to-child transmission of HIV-1
in Thailand,” N. Engl. J. Med., vol. 351, no. 3, pp. 217–228, Jul. 2004.
[12] M. Lallemant, S. Le Coeur, W. Sirirungsi, T. R. Cressey, N. Ngo-Giang-Huong, P. Traisathit, et al., “Randomized noninferiority trial of two maternal single-dose nevirapine-sparing regimens to prevent