ACPD
11, 18853–18899, 2011Global distribution and climate forcing of
marine organic aerosol
N. Meskhidze et al.
Title Page
Abstract Introduction
Conclusions References
Tables Figures
◭ ◮
◭ ◮
Back Close
Full Screen / Esc
Printer-friendly Version Interactive Discussion
Discussion
P
a
per
|
Dis
cussion
P
a
per
|
Discussion
P
a
per
|
Discussio
n
P
a
per
|
Atmos. Chem. Phys. Discuss., 11, 18853–18899, 2011 www.atmos-chem-phys-discuss.net/11/18853/2011/ doi:10.5194/acpd-11-18853-2011
© Author(s) 2011. CC Attribution 3.0 License.
Atmospheric Chemistry and Physics Discussions
This discussion paper is/has been under review for the journal Atmospheric Chemistry and Physics (ACP). Please refer to the corresponding final paper in ACP if available.
Global distribution and climate forcing of
marine organic aerosol – Part 1: Model
improvements and evaluation
N. Meskhidze1, J. Xu1,2, B. Gantt1, Y. Zhang1, A. Nenes3,4, S. J. Ghan5, X. Liu5,
R. Easter5, and R. Zaveri5
1
Department of Marine, Earth, and Atmospheric Sciences, North Carolina State University, Raleigh, NC, USA
2
Chinese Research Academy of Environment Sciences, No. 8 Dayangfang, Beiyuan, Chaoyang District, Beijing 100012, China
3
School of Earth and Atmospheric Sciences, Georgia Institute of Technology, Atlanta, GA, USA
4
ACPD
11, 18853–18899, 2011Global distribution and climate forcing of
marine organic aerosol
N. Meskhidze et al.
Title Page
Abstract Introduction
Conclusions References
Tables Figures
◭ ◮
◭ ◮
Back Close
Full Screen / Esc
Printer-friendly Version Interactive Discussion
Discussion
P
a
per
|
Dis
cussion
P
a
per
|
Discussion
P
a
per
|
Discussio
n
P
a
per
|
5
Atmospheric Sciences & Global Change Division, Pacific Northwest National Laboratory, Richland, WA, USA
Received: 24 May 2011 – Accepted: 14 June 2011 – Published: 1 July 2011
Correspondence to: N. Meskhidze ([email protected])
ACPD
11, 18853–18899, 2011Global distribution and climate forcing of
marine organic aerosol
N. Meskhidze et al.
Title Page
Abstract Introduction
Conclusions References
Tables Figures
◭ ◮
◭ ◮
Back Close
Full Screen / Esc
Printer-friendly Version Interactive Discussion
Discussion
P
a
per
|
Dis
cussion
P
a
per
|
Discussion
P
a
per
|
Discussio
n
P
a
per
|
Abstract
Marine organic aerosol emissions have been implemented and evaluated within the National Center of Atmospheric Research (NCAR)’s Community Atmosphere Model (CAM5) with the Pacific Northwest National Laboratory’s 7-mode Modal Aerosol Mod-ule (MAM-7). Emissions of marine primary organic aerosols (POA), phytoplankton-5
produced isoprene- and monoterpenes-derived secondary organic aerosols (SOA) and methane sulfonate (MS−) are shown to a
ffect surface concentrations of organic aerosols in remote marine regions. Global emissions of submicron marine POA is es-timated to be 7.9 and 9.4 Tg yr−1, for the Gantt et al. (2011) and Vignati et al. (2010) emission parameterizations, respectively. Marine sources of SOA and particulate MS− 10
(containing both sulfur and carbon atoms) contribute an additional 0.2 and 5.1 Tg yr−1, respectively. Widespread areas over productive waters of the Northern Atlantic, North-ern Pacific, and the SouthNorth-ern Ocean show marine-source submicron organic aerosol surface concentrations of 100 ng m−3, with values up to 400 ng m−3 over biologically productive areas. Comparison of long-term surface observations of water insoluble 15
organic matter (WIOM) with POA concentrations from the two emission parameteriza-tions shows that both Gantt et al. (2011) and Vignati et al. (2010) formulaparameteriza-tions are able to capture the magnitude of marine organic aerosol concentrations, with the Gantt et al. (2011) parameterization attaining better seasonality. Model simulations show that the mixing state of the marine POA can impact the surface number concentration of 20
cloud condensation nuclei (CCN). The largest increases (up to 20 %) in CCN (at a su-persaturation (S) of 0.2 %) number concentration are obtained over biologically pro-ductive ocean waters when marine organic aerosol is assumed to be externally mixed with sea-salt. Assuming marine organics are internally-mixed with sea-salt provides diverse results with increase and decrease in the concentration of CCN over different 25
ACPD
11, 18853–18899, 2011Global distribution and climate forcing of
marine organic aerosol
N. Meskhidze et al.
Title Page
Abstract Introduction
Conclusions References
Tables Figures
◭ ◮
◭ ◮
Back Close
Full Screen / Esc
Printer-friendly Version Interactive Discussion
Discussion
P
a
per
|
Dis
cussion
P
a
per
|
Discussion
P
a
per
|
Discussio
n
P
a
per
|
due to compositional changes in marine aerosol. Based on emerging evidence for in-creased CCN concentration over biologically active surface ocean areas/periods, our study suggests that treatment of sea spray in global climate models (GCMs) as an internal mixture of marine organic aerosols and sea-salt will likely lead to an underes-timation in CCN number concentration.
5
1 Introduction
The indirect effect of anthropogenic aerosols remains as the largest source of uncer-tainty for climate projections (IPCC, 2007). To characterize the effects of anthropogenic aerosol, the impact of all aerosols (anthropogenic and natural) on the earth system, and the role of “aerosols before pollution” (Andreae, 2007) must be understood. One 10
of the largest uncertainties of the aerosol-cloud system is the emission rate of natu-ral aerosols, especially over marine areas. Marine aerosols are important for global cloud condensation nuclei (CCN) budget, as they contribute considerably to the overall aerosol load, are emitted from a large surface area, and can strongly affect radiative properties and lifetime of marine stratiform clouds (Klein and Hartmann, 1993). Marine 15
aerosols could be particularly important for understanding the cloud-mediated effects of aerosols on climate, because cloud properties respond nonlinearly to aerosols and are most sensitive to CCN changes when their background concentration is low (Plat-nick and Twomey, 1994). This sensitivity is evident in measured cloud droplet number concentration (CDNC) over the remote oceans, which ranges from tens per cm3 in 20
biologically inactive regions to hundreds per cm3 under biologically active conditions (Andreae, 2007). Thus, factors that regulate the concentration of marine aerosols and resulting reflectivity of low-level marine clouds can critically affect the climate system as a whole (e.g., Randall et al., 1984). Despite their importance, the source strength and chemical composition of marine aerosols remain poorly quantified (O’Dowd and 25
ACPD
11, 18853–18899, 2011Global distribution and climate forcing of
marine organic aerosol
N. Meskhidze et al.
Title Page
Abstract Introduction
Conclusions References
Tables Figures
◭ ◮
◭ ◮
Back Close
Full Screen / Esc
Printer-friendly Version Interactive Discussion
Discussion
P
a
per
|
Dis
cussion
P
a
per
|
Discussion
P
a
per
|
Discussio
n
P
a
per
|
represent natural marine aerosols realistically. Instead, to compensate for missing nat-ural marine aerosol sources, global aerosol-climate models impose lower bounds on CDNC or aerosol number concentration over remote marine areas (Lohmann et al., 1999, 2007; Takemura et al., 2005; Wang and Penner, 2009). When these possibly unphysical constraints are removed, the simulated aerosol indirect effect can change 5
by up to 80 % (Hoose et al., 2009; Kirkev ˚ag et al., 2008). Changes of this magnitude can have profound effects on the model-predicted extent of human-induced climate change and highlight the need for improved modeling of marine aerosol number size distribution and chemical composition over pristine marine regions.
Natural aerosols over remote oceanic regions consist mainly of a mixture of sea-salt 10
particles, organics, and sulfates from the oxidation of biogenic dimethyl sulfide (DMS) with contributions from mineral dust and smoke from wildfires in some regions (An-dreae, 2007). Sea-salt has been proposed to be a major component of marine aerosol over the regions where wind speeds are high and/or other aerosol sources are weak (O’Dowd et al., 1997; Murphy et al., 1998; Quinn et al., 1998). At typical wind speeds 15
encountered during the cruises, sea-salt have been shown to be present in aerosol from 10 nm to several micrometers in diameter with a total number concentration above 100 cm−3 (Geever et al., 2005; Clarke et al., 2006; Smith, 2007). Using a coupled global aerosol-climate model with a size-resolved sea-salt aerosol parameterization, Ma et al. (2008) estimated that global direct and first indirect radiative forcings associ-20
ated with sea-salt aerosol were−0.60 W m−2and−1.34 W m−2, respectively.
In addition to sea-salt and DMS products, significant concentrations of submicron organic carbon (OC) aerosols have been identified in marine environments (Novakov et al., 1997; Ellison et al., 1999; Putaud et al., 2000; O’Dowd et al., 2004; Cavalli et al., 2004; Yoon et al., 2007; Pio et al., 2007; Sciare et al., 2009; Russell et al., 2010; Hultin 25
ACPD
11, 18853–18899, 2011Global distribution and climate forcing of
marine organic aerosol
N. Meskhidze et al.
Title Page
Abstract Introduction
Conclusions References
Tables Figures
◭ ◮
◭ ◮
Back Close
Full Screen / Esc
Printer-friendly Version Interactive Discussion
Discussion
P
a
per
|
Dis
cussion
P
a
per
|
Discussion
P
a
per
|
Discussio
n
P
a
per
|
primary or secondary based on chemical composition (Ceburnis et al., 2008), although this classification has recently been subjected to criticism (Rinaldi et al., 2010). Bubble bursting processes that emit sea-salt aerosols into the marine boundary layer also lead to the emission of marine primary organic aerosols (POA) composed of biogenic se-cretions and bacterial/viral debris (Blanchard and Woodcock, 1957; Middlebrook et al., 5
1998; O’Dowd et al., 2004; Leck and Bigg, 2005). Owing to their enhanced fine-mode concentration and surface active nature, these small insoluble organic particles have been proposed to influence both concentration and CCN activity of remote marine aerosols (O’Dowd et al., 2004; Leck and Bigg, 2007; Moore et al., 2008). However, to date laboratory and modeling studies have reported widely inconsistent results, sug-10
gesting increase, decrease or no effect of marine POA on CCN number concentration (Blanchard, 1963; Sellegri et al., 2006; Tyree et al., 2007; Fuentes et al., 2010a; West-ervelt et al., 2011).
Phytoplankton can also emit several types of biogenic volatile organic compounds (BVOCs), such as isoprene, monoterpenes, and amines that have the potential to form 15
secondary organic aerosols (SOA) (Bonsang et al., 1992; Shaw et al., 2003, 2010; Yas-saa et al., 2008; Facchini et al., 2008a; Sabolis, 2010). Marine isoprene emissions and their impact on SOA formation have been the subject of several recent studies (Arnold et al., 2009; Gantt et al., 2009; Luo and Yu, 2010; Myriokefalitakis et al., 2010). While the magnitude of SOA-forming potential from marine isoprene has been estimated to 20
be small on the global scale (Arnold et al., 2009), size-resolved local/regional contribu-tions are still not well understood (Gantt et al., 2009). It has been proposed that SOA produced from plankton-emitted isoprene can act synergistically with the established mechanisms of DMS-derived sulfate and sea-salt aerosols to change the chemical composition and number concentration of marine CCN (Meskhidze and Nenes, 2006). 25
ACPD
11, 18853–18899, 2011Global distribution and climate forcing of
marine organic aerosol
N. Meskhidze et al.
Title Page
Abstract Introduction
Conclusions References
Tables Figures
◭ ◮
◭ ◮
Back Close
Full Screen / Esc
Printer-friendly Version Interactive Discussion
Discussion
P
a
per
|
Dis
cussion
P
a
per
|
Discussion
P
a
per
|
Discussio
n
P
a
per
|
three main effects of marine-induced organic aerosols on marine clouds: (1) CCN number concentration; (2) cloud microphysical and radiative properties; and (3) the range in the assessments of shortwave cloud forcing. Calculations are conducted us-ing different mixing states and emission mechanisms of marine organic aerosols, and different cloud droplet activation parameterizations. This study is the first of a two-part 5
sequence and focuses on the impacts of marine organic emissions on aerosol abun-dance, chemical composition, and CCN activity. The second part (Meskhidze et al., 2011) will focus on the impact of these emissions on cloud microphysical properties and shortwave radiative forcing.
2 Model and methods
10
2.1 Model description
CAM5 is a general circulation model (GCM) with a complete representation of the aerosol lifecycle, a physically-based treatment of aerosol activation, double-moment cloud microphysics, and interactive cloud radiative properties. The model simula-tions are conducted at 1.9◦
×2.5◦ horizontal grid resolution with a vertical resolution
15
of 30 layers from the surface to 2.19 hPa. CAM5/MAM-7 (hereinafter referred to as CAM5) treats aerosols as internal mixtures of all major species within each of seven externally-mixed modes whose properties are given in Table 1. A detailed description of CAM5 can be found at http://www.cesm.ucar.edu/models/cesm1.0/cam and Neale et al. (2010). Of particular importance to this study is the treatment of aerosol water 20
uptake and activation. Water uptake is determined using K ¨ohler theory (Ghan and Za-veri, 2007) with a parameterized treatment of aerosol hygroscopicity values equivalent to theκ-K ¨ohler theory approach of Petters and Kreidenweis (2007). Aerosol activation to form cloud droplets is calculated by the scheme of Abdul-Razzak and Ghan (2000) (hereinafter referred to as AR-G), which is based on all modes of the aerosol size distri-25
ACPD
11, 18853–18899, 2011Global distribution and climate forcing of
marine organic aerosol
N. Meskhidze et al.
Title Page
Abstract Introduction
Conclusions References
Tables Figures
◭ ◮
◭ ◮
Back Close
Full Screen / Esc
Printer-friendly Version Interactive Discussion
Discussion
P
a
per
|
Dis
cussion
P
a
per
|
Discussion
P
a
per
|
Discussio
n
P
a
per
|
between modes during droplet formation is important when the surface area of the accumulation and coarse modes of the aerosol are comparable (Ghan et al., 1998).
Anthropogenic emissions, including sulfur dioxide (SO2), POA, and black carbon (BC) are from the Lamarque et al. (2010) Intergovernmental Panel on Climate Change (IPCC) Fifth Assessment Report (AR5) emission data set, updated by Bond et al. 5
(2007) and Junker and Liousse (2008). Injection heights and size distributions of pri-mary emitted particles and precursor gases follow the Aerosol Comparisons between Observations and Models (AEROCOM) protocols (Dentener et al., 2006). SOA pro-duction from five (lumped) biogenic and anthropogenic hydrocarbon emissions is pre-scribed using monthly-averaged VOC emissions from the MOZART-2 dataset (Horowitz 10
et al., 2003) for the year 1997 and assumed SOA yields for each different VOC species to form a single lumped semi-volatile gas that then condenses onto each aerosol mode using gas-to-particle mass transfer expressions (Seinfeld and Pandis, 2006) that are integrated over the size distribution of each mode (Binkowski and Shankar, 1995). Sea-salt emissions are calculated online using M ˚artensson et al. (2003) for particles<
15
2.8 µm in dry diameter and Monahan et al. (1986) for particles>2.8 µm in dry diame-ter, and assumed upper cut offdiameters of 0.08, 0.3, 1.0 and 10 µm to determine the sea-salt number and mass emissions into the Aitken, accumulation, and fine/coarse sea-salt modes. Dust emissions are also calculated online using the Dust Entrainment and Deposition (DEAD) scheme of Zender et al. (2003). Primary aerosol emissions 20
specify both mass and number emissions. With the exception of sea-salt (which is emitted as a number and then converted to mass), the aerosol number emission is calculated based on the size distribution of each aerosol type.
2.2 Model improvement
In this work, several updates have been developed and implemented into the CAM5 25
ACPD
11, 18853–18899, 2011Global distribution and climate forcing of
marine organic aerosol
N. Meskhidze et al.
Title Page
Abstract Introduction
Conclusions References
Tables Figures
◭ ◮
◭ ◮
Back Close
Full Screen / Esc
Printer-friendly Version Interactive Discussion
Discussion
P
a
per
|
Dis
cussion
P
a
per
|
Discussion
P
a
per
|
Discussio
n
P
a
per
|
marine SOA production pathways, extension of the AR-G aerosol activation parame-terization to allow treatment of the influence of organic surfactants on the activation process, and implementation of an alternate aerosol activation parameterization.
2.2.1 Marine primary organic aerosol
The two distinct online emission mechanisms for marine POA that have been imple-5
mented in CAM5 in this work are described in detail by Vignati et al. (2010) and Gantt et al. (2011). Both parameterizations compute organic mass fraction of sea spray (OMss), and use it to estimate the emissions of marine POA based on the default sea spray emission rates. The major difference between the two OMssemissions schemes is the mechanism that determines the organic enrichment of sea spray. In the Vignati 10
et al. (2010) scheme which updates O’Dowd et al. (2008), the organic fraction of sea spray is determined using a positive linear relationship with ocean surface chlorophyll-a
concentration ([Chl-a]). In addition to [Chl-a], the Gantt et al. (2011) scheme consid-ers wind speed and aerosol diameter (Dp) in determining the OMss. The wind speed dependence of the Gantt et al. (2011) parameterization is based on a conceptual re-15
lationship between the organic enrichment at the air-sea interface and surface wind speed, while the aerosol size dependence is based on measurements of Facchini et al. (2008b). The multi-variable logistic regression between OMss and [Chl-a], 10-m wind speed (U10), and aerosol diameter in Gantt et al. (2011) is given as:
OMss(Chl-a,U10,Dp)=
1
1+exp(−2.63[Chl-a]+0.18U10) 1+0.03exp(6.81Dp) +
0.03
1+exp(−2.63[Chl-a]+0.18U10)
(1) 20
The resulting OMss parameterization is applicable to areas with vastly different winds and [Chl-a] and can give the size-resolved organic carbon fraction of sea spray aerosols globally, using model-predictedU10 and remotely-sensed [Chl-a] data.
ACPD
11, 18853–18899, 2011Global distribution and climate forcing of
marine organic aerosol
N. Meskhidze et al.
Title Page
Abstract Introduction
Conclusions References
Tables Figures
◭ ◮
◭ ◮
Back Close
Full Screen / Esc
Printer-friendly Version Interactive Discussion
Discussion
P
a
per
|
Dis
cussion
P
a
per
|
Discussion
P
a
per
|
Discussio
n
P
a
per
|
with the Gantt et al. (2011) parameterization, the same Facchini et al. (2008b) size distribution is applied to the Vignati et al. (2010) parameterization as follows:
OMss(Chl-a,Dp)=
0.435[Chl-a]+0.138
1+0.03exp(6.81Dp)+0.03×(0.435[Chl-a]+0.138) (2) The marine primary organic emission parameterizations implemented in CAM5 also incorporate the change in density when transitioning between sea-salt and organics 5
as described in Gantt et al. (2009). The magnitude of OMss can influence the hygro-scopicity and thus the growth factor of the aerosol as described in Gantt et al. (2011). For marine POA emissions described by Eq. (2) be consistent with the rates from Vi-gnati et al. (2010), no growth factor effects were considered (GF=1) and the Dp in
Eqs. (1) and (2) is assumed to represent a dry diameter. Since marine POA and 10
sea-salt are thought to have similar emission mechanisms (i.e., bubble bursting), the modeled marine primary organics are emitted into the same aerosol modes that con-tain sea-salt (i.e., Aitken, accumulation, and fine/coarse sea-salt). As the M ˚artensson et al. (2003) parameterization was developed for a synthetic sea-water (without organ-ics) and in light of observational and laboratory evidence for the external mixtures of 15
sea-salt and marine POA (Leck and Bigg, 2007; Hawkins and Russell, 2010; Hultin et al., 2010) and changes in number and size distribution of marine aerosol during high biological productivity (Andreae et al., 2007; Yoon et al., 2007; Fuentes et al., 2010b), two different approaches are used for modeling marine POA: externally-mixed and internally-mixed (with sea-salt) emissions. In both approaches, the organic mass 20
fraction of sea spray in Aitken, accumulation, and fine/coarse sea-salt modes (see Ta-ble 1) is calculated using Eqs. (1) and (2). In the externally-mixed emission approach, the added marine POA mass emissions are accompanied by corresponding increases to sea spray number emissions into 4 model modes, based on the assumed size dis-tribution for sea spray emissions (M ˚artensson et al., 2003; Monahan et al., 1986). The 25
externally-mixed approach increases the aerosol number emission within the aerosol modes and slightly decreases the mean modal diameter of the emissions (by ∼4 %
ACPD
11, 18853–18899, 2011Global distribution and climate forcing of
marine organic aerosol
N. Meskhidze et al.
Title Page
Abstract Introduction
Conclusions References
Tables Figures
◭ ◮
◭ ◮
Back Close
Full Screen / Esc
Printer-friendly Version Interactive Discussion
Discussion
P
a
per
|
Dis
cussion
P
a
per
|
Discussion
P
a
per
|
Discussio
n
P
a
per
|
internally-mixed approach, only the sea spray aerosol mass is enhanced by addition of organics. Sea-spray number emissions into the 4 model modes are unchanged; the additional marine POA alters the chemical composition and increases the mean modal diameter of the emissions (by∼10 % when OMss=0.5). As the number
concentra-tion of organic aerosols in marine environments is relatively unconstrained, addiconcentra-tion 5
of marine POA emissions as both external and internal mixtures to CAM5 using the OMss from Eqs. (1) and (2) is believed to cover the range of possible scenarios by which marine carbonations aerosols can influence the CCN activity of aerosols over the ocean.
For both the internally- and externally-mixed emission approaches, the aerosols in 10
each mode are assumed to be internally-mixed and the hygroscopicity is calculated as mixture of a volume-weighted average of the hygroscopicity values of individual components (Petters and Kreidenweis, 2007). Few observational data are available for the physical and chemical properties of marine POA; so, the chemical properties of sub- and super-micron marine POA are assumed to be that of terrestrial POA, i.e., 15
a hygroscopicity value (κ) of 10−10 and a density of 1000 kg m−3(Neale et al., 2010). However, in light of higher hygroscopicity values of marine POA inferred by Cavalli et al. (2004) and Moore et al. (2008) and the sensitivity of aerosol indirect forcing to the hygroscopicity of terrestrial POA (Liu and Wang, 2010), calculations documenting the sensitivity of our results to an increased marine POA hygroscopicity will be presented 20
in the second part of this study.
2.2.2 Marine SOA
It has been well established that marine photosynthetic organisms emit a suite of BVOCs. In this study we consider DMS, isoprene, and monoterpenes (e.g., α- and
β-pinene, and d-limonene). DMS fluxes in CAM5 are from Dentener et al. (2006), 25
air-ACPD
11, 18853–18899, 2011Global distribution and climate forcing of
marine organic aerosol
N. Meskhidze et al.
Title Page
Abstract Introduction
Conclusions References
Tables Figures
◭ ◮
◭ ◮
Back Close
Full Screen / Esc
Printer-friendly Version Interactive Discussion
Discussion
P
a
per
|
Dis
cussion
P
a
per
|
Discussion
P
a
per
|
Discussio
n
P
a
per
|
ocean exchange parameterization. Previous modeling studies (e.g., Chin et al., 2000; Boucher et al., 2003; Easter et al., 2004; Myriokefalitakis et al., 2010) have found that over 90 % of atmospheric DMS is converted to SO2, but 1–2 Tg S yr−1 are converted to gaseous methanesulfonic acid which condenses to particulate methane sulfonate (MS−). To account for the contribution of MS− to both sulfur and SOA budgets (no-5
tice that particulate MS− contains both sulfur and carbon atoms) in CAM5, we have implemented a temperature-dependent empirical equation for the MS−/nss-SO2−
4 ratio
proposed by Bates et al. (1992). This formulation compares well with both the observa-tional data (Bates et al., 1992) and the results of complex multiphase chemical models of DMS oxidation (Campolongo et al., 1999). In the model, advection as well as dry 10
and wet deposition of MS− is treated in a way similar to SO2−
4 .
The marine emissions of isoprene and monoterpenes are calculated using the Gantt et al. (2009) scheme. This emission module accounts for phytoplankton abundance in the surface ocean column, their speciation,U10, sea surface temperature, and the in-coming solar radiation at a specific water depth based on diffuse attenuation of sunlight 15
throughout the ocean column. Isoprene production rates as a function of light intensity for various phytoplankton groups are taken from Gantt et al. (2009). Production rates for marineα- andβ-pinene, and d-limonene are scaled to isoprene emissions based on the measurements of Sabolis (2010). Both isoprene and monoterpene emission rates used in this study are based on laboratory measurements from different phytoplank-20
ton functional groups (i.e., diatoms, coccolithophores, dinoflagellates) under variable environmental conditions (i.e., light and temperature). For the conversion of marine BVOC to SOA, a 28.6 % mass yield is assumed for isoprene (Surratt et al., 2010), 30 % forα- and β-pinene, and 60 % for d-limonene (Lee et al., 2006). Unlike marine POA emissions that are added to CAM5 as an additional mass and number, the SOA and 25
MS−are condensed to pre-existing particles in di
ACPD
11, 18853–18899, 2011Global distribution and climate forcing of
marine organic aerosol
N. Meskhidze et al.
Title Page
Abstract Introduction
Conclusions References
Tables Figures
◭ ◮
◭ ◮
Back Close
Full Screen / Esc
Printer-friendly Version Interactive Discussion
Discussion
P
a
per
|
Dis
cussion
P
a
per
|
Discussion
P
a
per
|
Discussio
n
P
a
per
|
aκ=0.14 and a density of 1000 kg m−3(Neale et al., 2010).
2.2.3 Surfactant effect
Models of cloud droplet formation based on laboratory studies with idealized composi-tion of CCN suggest that organic solutes can lower surface tension (σ), one of the fac-tors that control the vapor pressure of small droplets. Chemical effects on cloud droplet 5
number concentration could be particularly pronounced for shallow marine clouds that are characterized by low droplet number concentrations and weak updraft velocities (compared to continental clouds) (Rissman et al., 2004). Here we carry out an exten-sion of AR-G parameterization in CAM5 to include explicit treatment of surface-active species by implementing the modified multi-mode parameterization of Rissman et al. 10
(2004). Recent surface tension measurements for marine dissolved organic matter have shown that surface tension depression for marine organics can be represented by Szyskowski-Langmuir adsorption isotherm (Langmuir, 1917) as a function of carbon concentration,C:
σ=σw−αTln(1+βC) (3)
15
whereσw is surface tension of water (i.e., an “infinitely diluted” sample), T is the ab-solute temperature, andα andβare empirical constants. Surfactant effects of marine organics are explored using two different sets of constants: α=1.7×10⁻⁴N m−1K−1
and β=11.86 l mol−1 from Cavalli et al. (2004) and α
=2.952×10⁻³N m−1K−1 and
β=2.4×10⁻²l mol−1 from Moore et al. (2008). The organic mass fraction of marine
20
aerosols in different modes is calculated by dividing marine POA by the total mass of dry aerosol components within each mode. Due to the overwhelming contribution of sea-salt, surfactant effects of supermicron marine POA aerosols are not considered in the simulations. Previous studies have revealed that Eq. (3) does not account for the possible partitioning of surface–active compounds between droplet surface and 25
ACPD
11, 18853–18899, 2011Global distribution and climate forcing of
marine organic aerosol
N. Meskhidze et al.
Title Page
Abstract Introduction
Conclusions References
Tables Figures
◭ ◮
◭ ◮
Back Close
Full Screen / Esc
Printer-friendly Version Interactive Discussion
Discussion
P
a
per
|
Dis
cussion
P
a
per
|
Discussion
P
a
per
|
Discussio
n
P
a
per
|
of marine organics treated this way should be viewed as a maximum effect on CCN number concentration.
2.2.4 Aerosol activation parameterization
A prognostic aerosol activation/droplet nucleation parameterization developed by Nenes and Seinfeld (2003) and updated by Fountoukis and Nenes (2005) (hereafter 5
referred to as FN) and Barahona et al. (2010) has been implemented in CAM5. The FN parameterization is one of the most comprehensive cloud droplet activation mech-anisms developed to date (Fountoukis and Nenes, 2005). In addition to treating the competition among all modes, the FN parameterization can also include the presence of surfactants and slightly soluble species (Shulman et al., 1996; Laaksonen et al., 10
1998). The FN parameterization includes a size-dependent mass transfer coefficient for the growth of water droplets to accommodate the effect of size (and potentially or-ganic films) on the droplet growth rate. The FN parameterization gives similar results to a detailed numerical cloud parcel model with a substantially lower simulation time, and has been shown to accurately predict cloud droplet activation for a wide range 15
of observational conditions for non-precipitating warm clouds of variable microphysics, aerosol composition, and size distribution (Nenes and Seinfeld, 2003; Meskhidze et al., 2005; Fountoukis et al., 2007; Ghan et al., 2011). The combination of accuracy and speed makes this parameterization appropriate for the calculation of the aerosol activa-tion processes in GCMs. The FN parameterizaactiva-tion can employ both secactiva-tional (binned) 20
and modal (lognormal) representations of the aerosol size distribution and chemical composition. The modal version has been implemented in CAM5. As both the mass and number fractions activated for each mode are needed to determine the nucleation scavenging rate of aerosols in the model, the FN parameterization was modified by adding activated mass fraction calculation following Abdul-Razzak et al. (1998). Al-25
ACPD
11, 18853–18899, 2011Global distribution and climate forcing of
marine organic aerosol
N. Meskhidze et al.
Title Page
Abstract Introduction
Conclusions References
Tables Figures
◭ ◮
◭ ◮
Back Close
Full Screen / Esc
Printer-friendly Version Interactive Discussion
Discussion
P
a
per
|
Dis
cussion
P
a
per
|
Discussion
P
a
per
|
Discussio
n
P
a
per
|
two different state-of-the-art aerosol activation parameterizations gives a robust as-sessment of the extent to which ocean ecosystems can influence regional aerosol and cloud radiative properties.
3 Simulation setup
Table 2 lists the simulations carried out to study the effects of marine OC emissions on 5
ambient aerosol concentration and CCN activity. All simulations are conducted for 5 yr with a 3 month spin-up. The CAM5 runs are carried out for three emissions schemes: “Default”, “V10”, and “G11”. The Default simulation uses all the original options of CAM5, including the AR-G aerosol activation scheme and the baseline terrestrial and marine emissions. The baseline marine emissions in the model include sea-salt and 10
DMS (with only yield of SO2−
4 ). The V10 simulation uses all the same options as the
Default, with the addition of marine POA emissions following Vignati et al. (2010) and marine SOA/MS− production as described above. The G11 simulation is similar to the V10 but employs the Gantt et al. (2011) marine POA emissions. Therefore, the differences among the Default, V10, and G11 simulations can be attributed exclusively 15
to the effects of marine POA and SOA (including MS−). Di
fferences between V10 and G11 are due to differences in marine POA emission parameterizations. A number of sensitivity studies are also carried out to examine how reasonable variations in the key parameters for marine organic aerosol affect the model-predicted CCN and cloud mi-crophysics properties. The “V10-Internal” and “G11-Internal” simulations are intended 20
to test the effects of mixing state of the marine POA emissions. In these two simula-tions, marine POA emissions are added to the aerosol modes as internally-mixed with sea-salt and marine SOA and MS−production are not considered. In “SOA/MS−” sim-ulations, only marine SOA and MS−production (no marine POA emissions) are added to the Default scheme to study the contribution of these marine secondary aerosols to 25
ACPD
11, 18853–18899, 2011Global distribution and climate forcing of
marine organic aerosol
N. Meskhidze et al.
Title Page
Abstract Introduction
Conclusions References
Tables Figures
◭ ◮
◭ ◮
Back Close
Full Screen / Esc
Printer-friendly Version Interactive Discussion
Discussion
P
a
per
|
Dis
cussion
P
a
per
|
Discussion
P
a
per
|
Discussio
n
P
a
per
|
4 Results
4.1 Marine emissions
Table 3 lists simulated global annual emissions of compounds with marine sources. For both V10 and G11 simulations, the emission amounts of POA increase with larger aerosol sizes like that of sea-salt; however, relative to sea-salt the emissions of ma-5
rine POA in the coarse mode are modest due to the progressively smaller organic enrichment of sea spray with size. The emission amounts of submicron marine POA estimated using the two parameterizations in this study are 9.4 Tg yr−1in the V10 sim-ulation and 7.9 Tg yr−1in the G11 simulation. Note that the size dependent scheme of OMsssupplemented to the Vignati et al. (2010) parameterization had an overall minor 10
effect on the absolute amount of submicron marine organic aerosol emissions (cf., 8.2 and 7–8 Tg yr−1reported by Vignati et al. (2010) and Myriokefalitakis et al. (2010), re-spectively). This is somewhat unexpected, as the M ˚artensson et al. (2003) emission function (used in CAM5) predicts a factor of five higher emission of submicron sea-salt mass, as compared to the Gong (2003) function (used in Vignati et al., 2010). The 15
lower than expected emissions of POA in the V10 simulations can be explained by the size-dependent OMss enrichment mechanism (with lower organic enrichments for larger sized submicron mode particles) applied to the Vignati et al. (2010) formulation. As the submicron sea spray mass is typically weighted toward the larger sizes (O’Dowd et al., 1997), the reduction of OMss with aerosol size yields lower marine POA mass 20
emissions. The coarse mode contributes∼70 % of the total marine POA mass for both
V10 and G11, but it is expected to have little climatic impact as it represents<1 % of coarse mode sea-salt mass emissions.
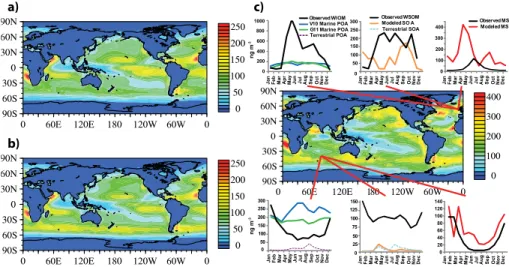
Although relatively similar in the magnitude of global emissions, the V10 and G11 pa-rameterizations predict considerably different spatial distributions. Figure 1a, b shows 25
ACPD
11, 18853–18899, 2011Global distribution and climate forcing of
marine organic aerosol
N. Meskhidze et al.
Title Page
Abstract Introduction
Conclusions References
Tables Figures
◭ ◮
◭ ◮
Back Close
Full Screen / Esc
Printer-friendly Version Interactive Discussion
Discussion
P
a
per
|
Dis
cussion
P
a
per
|
Discussion
P
a
per
|
Discussio
n
P
a
per
|
higher emissions as compared to V10. The distributions of SOA and MS−, shown in Fig. 1c,d, are different compared to that of POA in both magnitude and spatial distri-bution. For SOA, the magnitude of emissions is much lower than that of POA and the emissions are concentrated over the coastal upwelling regions characterized by high productivity. The magnitude of the MS− emissions is comparable to that of POA but 5
is more focused in the high latitude oceans due to the high DMS flux and negative temperature dependence of the MS−yields (e.g., Bates et al., 1994; Kettle et al., 1999; Barnes et al., 2006).
4.2 Marine organic aerosol mass concentrations
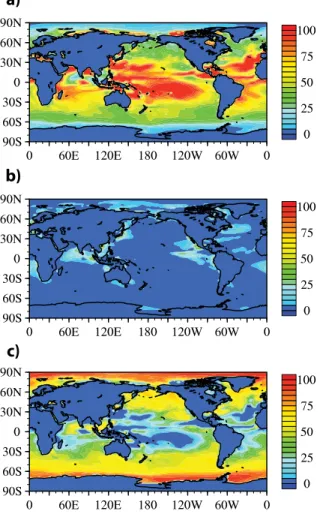
The differences in the POA emission rates for the G11 and V10 simulations (Fig. 1a 10
and 1b) lead to differences in the surface POA concentrations as shown in Fig. 2a and b. The largest differences in yearly-averaged surface concentrations of marine organic aerosols for G11 and V10 simulations occur over the Southern Ocean, where G11 pre-dicts lower concentrations (up to 100 ng m−3) compared to V10 (up to 200 ng m−3) due to the stronger wind speed dependence of the V10 emission scheme and high wind 15
speeds throughout the region. In the tropical Pacific, where wind speeds are much lower, G11 shows elevated concentrations relative to that of V10 due to its higher emis-sions rate there. Overall, the G11 simulation produces relatively uniform surface con-centrations with values greater than 50 ng m−3of marine organic aerosols over most of the oceanic regions. In addition to the emissions, surface layer POA concentrations are 20
also influenced by the differences in transport and deposition patterns. Comparison of Figs. 1a and 2a shows that although the high concentrations are typically co-located with the regions of high emissions, the oceanic areas with low annual precipitation (e.g., tropical oceans on both sides of the Intertropical Convergence Zone) tend to have elevated concentrations relative to their emission rates. Figure 2a, b shows that 25
ACPD
11, 18853–18899, 2011Global distribution and climate forcing of
marine organic aerosol
N. Meskhidze et al.
Title Page
Abstract Introduction
Conclusions References
Tables Figures
◭ ◮
◭ ◮
Back Close
Full Screen / Esc
Printer-friendly Version Interactive Discussion
Discussion
P
a
per
|
Dis
cussion
P
a
per
|
Discussion
P
a
per
|
Discussio
n
P
a
per
|
(Sciare et al., 2009; Russell et al., 2010, 2011; Gantt et al., 2010). Potential reasons for the model underestimation include the climatological surface ocean [Chl-a] used in both V10 and G11 emission parameterizations, the annual averaging of the emis-sions, and the coarse horizontal resolution of the model that may not capture local point observations. The assumption of a single value of 1.4 for the organic aerosol to OC 5
mass ratio (Decesari et al., 2007; Facchini et al., 2008b) is also likely to be a source of uncertainty. In terms of total marine-source submicron OM (OM=POA+SOA+MS−) concentrations, Fig. 2c shows that widespread areas over productive waters of the Northern Atlantic, Northern Pacific, and the Southern Ocean have marine-source sub-micron OM surface concentrations of 100 ng m−3 with values over 400 ng m−3 in the 10
most productive areas.
Global climate models like CAM5 give an average realization of the atmospheric state and therefore should not be directly compared to the measurements conducted for a short period of time at specific locations. This puts a strict constraint on obser-vational data suitable for model validation. On Fig. 2c the model components of OM 15
(POA, SOA, and MS−) are compared to long-term monthly-average observations of water insoluble organic matter (WIOM), water soluble organic matter (WSOM), and MS−at two coastal sites: Mace Head (Yoon et al., 2007) and Amsterdam Island (Sciare et al., 2009). Long-term observations of marine organic aerosols available from these two sites smooth out day-to-day variations and therefore are suitable for judging the 20
accuracy of the CAM5 predicted organic aerosol concentrations over the remote ma-rine regions. Figure 2c shows that at the Mace Head station located on the Atlantic coast of Ireland (53.33◦N, 9.90◦W) both the V10 and G11 simulations are roughly able to replicate the magnitude of ocean-derived WIOM for the periods of low biological activity (November through March). Figure 2c also highlights a significant underesti-25
ACPD
11, 18853–18899, 2011Global distribution and climate forcing of
marine organic aerosol
N. Meskhidze et al.
Title Page
Abstract Introduction
Conclusions References
Tables Figures
◭ ◮
◭ ◮
Back Close
Full Screen / Esc
Printer-friendly Version Interactive Discussion
Discussion
P
a
per
|
Dis
cussion
P
a
per
|
Discussion
P
a
per
|
Discussio
n
P
a
per
|
Mace Head (Ceburnis et al., 2011), and uncertainties related to the surf zone impact on aerosol emissions (de Leeuw et al., 2000; Vignati et al., 2001).
According to Fig. 2c, seasonal differences between the V10 and G11 schemes are predicted at Amsterdam Island (37.80◦S, 77.57◦E). This figure shows that at Amster-dam Island the G11 scheme captures the seasonal variation of POA (more productive 5
summer and less productive winter periods) slightly better than V10, although neither simulation accurately predicts the range of concentrations observed during the diff er-ent seasons. Neglecting any poter-ential non-emission related inadequacies in the model, the most likely reason for this problem is the strong wind speed dependence of the sea spray function employed by the two emission schemes. Although aerosol chemical 10
composition over the Amsterdam Island can be considered to be representative for marine background, given an extreme paucity of ground-based long-term measure-ments of marine organic aerosols, it is difficult to assess the accuracy of either V10 or G11 emission mechanism on a global scale. Nevertheless, Fig. 2c indicates that compared to simulations when only terrestrial emissions of POA are accounted for, the 15
implementation of marine POA in CAM5 leads to a significant improvement of organic aerosol concentrations at Amsterdam Island. Figure 3 shows that in general, both G11 and V10 simulations display distinct seasonalities in OM mass concentrations over the wider Southern Ocean waters (roughly between 40◦S to 70◦S) caused by variability in [Chl-a] (high biological productivity during austral summer and low in winter). However, 20
despite such similarities, Fig. 3 shows that due to stronger wind speed dependence, V10 is consistently predicting higher OM mass concentrations and less seasonal vari-ability compared to G11.
Also shown in Fig. 2c is the observed monthly-average surface WSOM concentra-tion at both sites which are well in excess of the modeled SOA concentraconcentra-tions. The 25
ACPD
11, 18853–18899, 2011Global distribution and climate forcing of
marine organic aerosol
N. Meskhidze et al.
Title Page
Abstract Introduction
Conclusions References
Tables Figures
◭ ◮
◭ ◮
Back Close
Full Screen / Esc
Printer-friendly Version Interactive Discussion
Discussion
P
a
per
|
Dis
cussion
P
a
per
|
Discussion
P
a
per
|
Discussio
n
P
a
per
|
2007) of possible marine origin. These model results are consistent with several re-cent studies suggesting that SOA produced from marine BVOCs may not be enough to explain the observed WSOM concentrations, especially over the Southern Ocean (Arnold et al., 2009; Claeys et al., 2009).
The spatial distribution of marine-source OM surface concentration for each of the 5
three components (POA, SOA, and MS−) shown in Fig. 4 reveal distinct patterns over the global oceans: POA and to a lesser degree SOA are comprising the majority of tropical ocean OM mass while a combination of POA and MS− is making up the mid-latitude OM, with MS− dominating at high-latitudes. These results are similar to that of Myriokefalitakis et al. (2010), although POA contributes more to tropical OM in the G11 10
simulation due to the higher emissions/concentrations. Not shown is the contribution of each of the three components to submicron marine OC mass, which would be some-what different owing to the distinct OM/OC ratios intrinsic to each type of OM. Marine POA, for example, would contribute substantially to global marine OC because of the assumed 1.4 OM/OC ratio (Decesari et al., 2007; Facchini et al., 2008b) as compared 15
to an OM/OC ratio of∼8 for MS−.
4.3 Changes in CCN concentration
A number of studies (e.g., Lohmann et al., 1999, 2007; Takemura et al., 2005; Wang and Penner, 2009; Hoose et al., 2009) highlight the challenges for GCMs to accurately represent the seeds of cloud droplets over pristine remote oceanic regions. To evalu-20
ate the representativeness of the model-predicted marine organic aerosols to serve as CCN over remote marine regions, we compare CAM5 simulated surface CCN concen-tration (S=0.2 %) with observations from several field campaigns. A supersaturation of 0.2 % is selected to be representative of an average effective supersaturation in marine boundary-layer stratocumulus clouds, while the choice of the first model layer 25
ACPD
11, 18853–18899, 2011Global distribution and climate forcing of
marine organic aerosol
N. Meskhidze et al.
Title Page
Abstract Introduction
Conclusions References
Tables Figures
◭ ◮
◭ ◮
Back Close
Full Screen / Esc
Printer-friendly Version Interactive Discussion
Discussion
P
a
per
|
Dis
cussion
P
a
per
|
Discussion
P
a
per
|
Discussio
n
P
a
per
|
assumed to be externally-mixed with sea-salt (the G11 simulation), the greatest per-centage changes (∼20 %) in the surface CCN occur in the vicinity of biologically
pro-ductive ocean waters. A similar spatial distribution and sign of these changes, albeit at different magnitudes, is predicted for CCN concentration at supersaturations of 0.01 % and 1 % (see Fig. S1 in the Supplement). Vertical profiles of model-predicted and 5
observed CCN have been compared by selecting the collocated CAM5 grid cell and simulated month(s) closest to that of each campaign. The detailed description of the location and dates for each of the field experiments can be found elsewhere (e.g., Ghan et al., 2001 and references therein; Wang et al., 2008, 2010). When compared to ob-served CCN concentrations (S=0.2 %) from various field campaigns (vertical plots on 10
Fig. 5a), it can be seen that for the selected measurement locations, marine organic aerosols have a minor effect on predicted CCN. Figure 5a shows that all model-predicted vertical profiles of CCN concentration decrease with height, except FIRE3 where simulation profiles are nearly invariant with height. The agreement between simulated and observed profiles is within the range of variability in the observations. 15
Deviations of model-predicted CCN from the observations (e.g., for SOCEX1) were previously attributed to a combination of factors including excessive MS− and ine
ffi -cient wet removal in the model (Ghan et al., 2001).
Comparison of Fig. 5a and 5b shows that the surface CCN concentration changes are similar between the G11 and V10 simulations (with the exception of the South-20
ern Ocean which had a greater increase in the V10 simulation). These figures show that over most of the oceans, marine-source organic aerosols increase surface CCN concentration by less than 10 %. Inspection of Fig. 5 also reveals reduction of CCN concentration for most of the land regions (sometimes far inland over the Europe and North America). Our data analysis (shown in Table 4) indicates that for all the sim-25
ACPD
11, 18853–18899, 2011Global distribution and climate forcing of
marine organic aerosol
N. Meskhidze et al.
Title Page
Abstract Introduction
Conclusions References
Tables Figures
◭ ◮
◭ ◮
Back Close
Full Screen / Esc
Printer-friendly Version Interactive Discussion
Discussion
P
a
per
|
Dis
cussion
P
a
per
|
Discussion
P
a
per
|
Discussio
n
P
a
per
|
and clouds. Therefore, it is plausible that the reduction in CCN number concentration over the land, thousands of kilometers away from the emission sources, is caused by marine-source organic aerosol-induced changes to meteorology and cloud microphysi-cal processes. This hypothesis will be explored in detail in the second part of this study which examines the spatially heterogeneous climate forcing by marine organic aerosol. 5
Overall, Fig. 5 shows that the effects of marine organic aerosol are likely to be global and not merely limited to oceanic regions.
The spatial variations of percentage change in surface CCN number concentration due to marine organics are shown in Fig. 6. Despite marked seasonality in submicron marine OM mass concentration over productive waters of the Northern Pacific and At-10
lantic and the Southern Oceans (see Fig. 3), Fig. 6 shows modest seasonal modulation in percent change of CCN number. The main reason for this is likely to be the colloca-tion of the strongest sources of marine organic aerosol and DMS, i.e., ocean regions with elevated primary productivity. As DMS is one of the main sources of CCN over the remote marine regions, Fig. 6 suggests that the contribution of marine organic aerosol 15
to the CCN budget can be important throughout the whole year. Moreover, according to Eq. (1) the organic mass fraction of sea spray approaches 100 % (pure organics) for particles below 100 nm in dry diameter, reflecting the highest potential enrichment in the organic fraction (Bigg and Leck, 2008). Several studies using laboratory-generated primary marine aerosol proposed that due to their low CCN activity such (sub-200 nm 20
diameter organic particles) are not expected to enhance CCN budget over the oceans (Fuentes et al., 2011). However, Fig. 6 suggests that these submicron-sized marine POA could be of considerable importance to marine CCN budget even if they are emit-ted at a size below the critical diameter for droplet activation at supersaturations found in marine stratus clouds. Such organic particles could serve as nuclei for the growth 25
of sulfate particles from the oxidation of DMS, providing an alternative mechanism to homogeneous nucleation of sulfate particles (Andreae and Rosenfeld, 2008).
The addition of marine SOA and MS−to the model did not make large di
ACPD
11, 18853–18899, 2011Global distribution and climate forcing of
marine organic aerosol
N. Meskhidze et al.
Title Page
Abstract Introduction
Conclusions References
Tables Figures
◭ ◮
◭ ◮
Back Close
Full Screen / Esc
Printer-friendly Version Interactive Discussion
Discussion
P
a
per
|
Dis
cussion
P
a
per
|
Discussion
P
a
per
|
Discussio
n
P
a
per
|
sensitivity of CCN to the marine SOA at low and mid-latitudes indicates the limited in-fluence of marine biogenic trace gases on maritime aerosol size distribution and chem-ical composition. Overall, Figs. 5 and 7 suggest that different marine organic aerosol sources may influence CCN concentration in different regions; secondary aerosols in-crease CCN more in polar regions while POA inin-creases CCN concentrations by the 5
greatest percentage in mid-latitude and tropical oceanic regions.
Figure 7b,c compares the percentage change in CCN concentration between the Default and the G11-Internal and V10-Internal simulations, respectively. These simu-lations do not include SOA and MS− production and marine POA emissions are added as internally-mixed with sea-salt. Figure 7b,c shows that for these two simulations the 10
emission of internally-mixed marine POA provides diverse results with enhancement and reduction in surface CCN concentration relative to the Default. These figures show that when sea spray is treated as an internal mixture of marine organics and sea-salt (no change in number), the model predicts slight reduction in CCN concentration, even over the highly productive waters of the southern ocean. The sign of the CCN change 15
due to the addition of marine organics to sea-salt aerosol is determined by the rel-ative significance of the increase in the mean modal diameter due to the addition of mass and the decrease in particle hygroscopicity. According to Table 4, the addition of internally-mixed marine organic aerosol yields a slight reduction in model-predicted global mean surface CCN concentration. As a supersaturation of 0.2 % corresponds 20
to sea-salt particles with dry diameters of ∼72 nm, i.e., accumulation mode where
ambient measurements show the largest increase in CCN number associated with bi-ologically active regions (Bigg, 2007; Yoon et al., 2007; Rinaldi et al., 2010), treatment of marine POA emissions only as internal mixture is likely to underestimate their cloud microphysical and radiative effects. The large discrepancy in yearly-mean surface CCN 25
ACPD
11, 18853–18899, 2011Global distribution and climate forcing of
marine organic aerosol
N. Meskhidze et al.
Title Page
Abstract Introduction
Conclusions References
Tables Figures
◭ ◮
◭ ◮
Back Close
Full Screen / Esc
Printer-friendly Version Interactive Discussion
Discussion
P
a
per
|
Dis
cussion
P
a
per
|
Discussion
P
a
per
|
Discussio
n
P
a
per
|
5 Conclusions
Marine organic emissions are implemented in CAM5 by adding two different online emission parameterizations of marine POA and offline productions of marine SOA and MS−, derived from phytoplankton-emitted BVOCs. The estimated annual total sub-micron marine POA emissions are 9.4 Tg yr−1 and 7.9 Tg yr−1 using the Vignati et al. 5
(2010) and Gantt et al. (2011) parameterizations, respectively. Over biologically pro-ductive surface ocean waters, model-predicted concentrations of submicron marine-source OM are estimated to be up to 400 ng m−3. Marine POA contributes to the major fraction (up to 250 ng m−3) of the submicron organic aerosol mass over the tropical and mid-latitude areas, while MS−is found to dominate in high latitude regions. Marine 10
SOA from phytoplankton-derived isoprene and monoterpenes contributes to a relatively small fraction (up to 20 %) of the surface concentration of marine-source OM. Extreme scarcity of ground-based long-term measurements of marine organic aerosols does not allow effective evaluations of marine-source surface OM concentrations predicted by the Vignati et al. (2010) and Gantt et al. (2011) emission mechanisms. Nevertheless, 15
comparisons of model-predicted marine-source POA concentrations with observations of WIOM at the Northern and Southern Hemispheric coastal sites show that the Gantt et al. (2011) emission parameterization yields a more accurate representation for the seasonal cycle of marine organic aerosol mass concentrations. Our model simulations show that, when only the terrestrial emissions of POA are accounted for, CAM5 signif-20
icantly under-predicts organic aerosol mass concentration over the remote ocean. Although the global model-predicted surface CCN (at a S=0.2 %) concentration is shown to be relatively insensitive to the addition of marine organic aerosols, ma-rine emissions of organics are shown to influence surface CCN concentration over the localized regions of the remote ocean. The largest increases (up to 20 %) in 25
ACPD
11, 18853–18899, 2011Global distribution and climate forcing of
marine organic aerosol
N. Meskhidze et al.
Title Page
Abstract Introduction
Conclusions References
Tables Figures
◭ ◮
◭ ◮
Back Close
Full Screen / Esc
Printer-friendly Version Interactive Discussion
Discussion
P
a
per
|
Dis
cussion
P
a
per
|
Discussion
P
a
per
|
Discussio
n
P
a
per
|
reductions of CCN concentration over biologically productive parts of the ocean. Based on the experimental evidence for the increased CCN concentration during the peri-ods of higher [Chl-a] levels, our study suggests that it is unlikely that marine organic aerosols are emitted only as an internal mixture with sea-salt, without changing aerosol number. This study also indicates that externally-mixed marine organic aerosol could 5
be of importance to the marine CCN budget, even if they, as originally produced, are below the critical diameter for droplet activation at the supersaturation of 0.2 %. Such particles could serve as nuclei for the growth of sulfate particles from the oxidation of marine biogenic DMS. Neglecting the effects of marine organic aerosols on CCN num-ber concentrations in climate models could, therefore, lead to an under estimation in 10
shallow marine cloud droplet number concentration. Changes in cloud microphysics and climate forcing due to marine organic aerosols using multiple aerosol activation parameterizations, surfactant effect calculations, and hygroscopicity values are further explored in the second part of this study.
Supplementary material related to this article is available online at:
15
http://www.atmos-chem-phys-discuss.net/11/18853/2011/
acpd-11-18853-2011-supplement.pdf.
Acknowledgement. This research was supported by the Office of Science (BER), US
Depart-ment of Energy, Grant No. DE-FG02-08ER64508. BG is also supported by a NASA NESSF. AN acknowledges support from a NASA ACMAP and NSF CAREER award. We also acknowledge 20
ACPD
11, 18853–18899, 2011Global distribution and climate forcing of
marine organic aerosol
N. Meskhidze et al.
Title Page
Abstract Introduction
Conclusions References
Tables Figures
◭ ◮
◭ ◮
Back Close
Full Screen / Esc
Printer-friendly Version Interactive Discussion
Discussion
P
a
per
|
Dis
cussion
P
a
per
|
Discussion
P
a
per
|
Discussio
n
P
a
per
|
References
Abdul-Razzak, H. and Ghan, S. J.: A parameterization of aerosol activation: 2. Multiple aerosol types, J. Geophys. Res., 105(D6), 6837–6844, 2000.
Abdul-Razzak, H., Ghan, S. J., and Rivera-Carpio, C.: A parameterization of aerosol activation: 1. Single aerosol type, J. Geophys. Res., 103(D6), 6123–6131, 1998.
5
Andreae, M. O.: Aerosols before pollution, Science, 315, 50–51, 2007.
Andreae, M. O. and Rosenfeld, D.: Aerosol-cloud-precipitation interactions, Part 1, The nature and sources of cloud-active aerosols: Earth Sci. Rev., 89, 13–41, 2008.
Arnold, S. R., Spracklen, D. V., Williams, J., Yassaa, N., Sciare, J., Bonsang, B., Gros, V., Peeken, I., Lewis, A. C., Alvain, S., and Moulin, C.: Evaluation of the global oceanic isoprene 10
source and its impacts on marine organic carbon aerosol, Atmos. Chem. Phys., 9, 1253– 1262, doi:10.5194/acp-9-1253-2009, 2009.
Barahona, D., West, R. E. L., Stier, P., Romakkaniemi, S., Kokkola, H., and Nenes, A.: Com-prehensively accounting for the effect of giant CCN in cloud activation parameterizations, Atmos. Chem. Phys., 10, 2467–2473, doi:10.5194/acp-10-2467-2010, 2010.
15
Barnes, I., Hjorth, J., and Mihalopoulos, N.: Dimethyl sulfide and dimethyl sulfoxide and their oxidation in the atmosphere, Chem. Rev., 106, 940–975, 2006.
Bates, T. S., Calhoun, J. A., and Quinn, P. K.: Variations in the concentration ratio of methane-sulfonate to sulfate in marine aerosol particles over the South Pacific Ocean, J. Geophys. Res., 97, 9859–9865, 1992.
20
Bates, T. S., Kiene, R. P., Wolfe, G. V., Matrai, P. A., Chavez, F. P., Buck, K. R., Blomquist, B. W., and Cuhel, R. L.: The cycling of sulfur in surface seawater of the Northeast Pacific, J. Geo-phys. Res., 99, 7835–7843, doi:10.1029/93JC02782, 1994.
Bates, T. S., Quinn, P. K., Coffman, D. J., and Johnson, J. E.: Dominance of organic aerosol in the marine boundary layer over the Gulf of Maine during NEAQS 2002 and their rolein 25
aerosol light scattering, J. Geophys. Res., 110, D18202, doi:10.1029/2005/JD005797, 2005. Bigg, E. K.: Sources, nature and influence on climate of marine airborne particles, Environ.
Chem., 4, 155–161, doi:10.1071/EN07001, 2007.
Bigg, E. K. and Leck, C.: The composition of fragments of bubbles bursting at the ocean sur-face, J. Geophys. Res., 113, D11209, doi:10.1029/2007JD009078, 2008
30
ACPD
11, 18853–18899, 2011Global distribution and climate forcing of
marine organic aerosol
N. Meskhidze et al.
Title Page
Abstract Introduction
Conclusions References
Tables Figures
◭ ◮
◭ ◮
Back Close
Full Screen / Esc
Printer-friendly Version Interactive Discussion
Discussion
P
a
per
|
Dis
cussion
P
a
per
|
Discussion
P
a
per
|
Discussio
n
P
a
per
|
Blanchard, D. C.: The electrification of the atmosphere by particles from bubbles in the sea, Prog. Oceanogr., 1, 71–202, 1963.
Blanchard, D. C. and Woodcock, A. H.: Bubble formation and modification in the sea and its meteorological significance, Tellus, 9, 145–158, 1957.
Bond, T. C., Bhardwaj, E., Dong, R., Jogani, R., Jung, S., Roden, C., Streets, D. G., 5
and Trautmann, N. M.: Historical emissions of black and organic carbon aerosol from energy-related combustion, 1850–2000, Global Biogeochem. Cy., 21, GB2018, doi:10.1029/2006GB002840, 2007.
Bonsang, B., Polle, C., and Lambert, G.: Evidence for marine production of isoprene, Geophys. Res. Lett., 19, 1129–1132, 1992.
10
Boucher, O., Moulin, C., Belviso, S., Aumont, O., Bopp, L., Cosme, E., von Kuhlmann, R., Lawrence, M. G., Pham, M., Reddy, M. S., Sciare, J., and Venkataraman, C.: DMS atmospheric concentrations and sulphate aerosol indirect radiative forcing: a sensitivity study to the DMS source representation and oxidation, Atmos. Chem. Phys., 3, 49–65, doi:10.5194/acp-3-49-2003, 2003.
15
Campolongo, F., Saltelli, A., Jensen, N. R., Wilson, J., and Hjorth, J.: The role of multiphase chemistry in the oxidation of dimethylsulfide (DMS). A latitude dependent analysis, J. Atmos. Chem., 32, 327–356, 1999.
Cavalli, F., Facchini, M. C., Decesari, S., Mircea, M., Emblicia, L., Fuzzi, S., Ceburnis, D., Yoon, Y. J., O’Dowd, C. D., Putaud, J.-P., and Dell’Acqua, A.: Advances in characterization 20
of size resolved organic matter in marine aerosol over the North Atlantic, J. Geophys. Res., 109, D24215, doi:10.1029/2004JD005137, 2004.
Ceburnis, D., O’Dowd, C. D., Jennings, G. S., Facchini, M. C., Emblico, L., Decesari, S., Fuzzi, S., and Sakalys, J.: Marine aerosol chemistry gradients: elucidating primary and secondary processes and fluxes, Geophys. Res. Lett., 35, L07804, doi:10.1029/2008GL033462, 2008. 25
Ceburnis, D., Garbaras, A., Szidat, S., Rinaldi, M., Fahrni, S., Perron, N., Wacker, L., Leinert, S., Remeikis, V., Facchini, M. C., Prevot, A. S. H., Jennings, S. G., and O’Dowd, C. D.: Quan-tification of the carbonaceous matter origin in submicron marine aerosol particles by dual carbon isotope analysis, Atmos. Chem. Phys. Discuss., 11, 2749–2772, doi:10.5194/acpd-11-2749-2011, 2011.
30