Annales
Geophysicae
Formation of a strong southward IMF near the solar maximum of
cycle 23
S. Watari1, M. Vandas2, and T. Watanabe3
1Communications Research Laboratory, 4-2-1 Nukuikita, Koganei, Tokyo 184-8795, Japan 2Astronomical Institute, Bocni II 1401, 14131 Praha 4, Czech Republic
3Ibaraki University, 2-1-1 Bunkyo, Mito, Ibaraki 310-8512, Japan
Received: 10 January 2003 – Revised: 7 June 2003 – Accepted: 23 June 2003 – Published: 1 January 2004
Abstract. We analyzed observations of the solar activities and the solar wind parameters associated with large geo-magnetic storms near the maximum of solar cycle 23. This analysis showed that strong southward interplanetary mag-netic fields (IMFs), formed through interaction between an interplanetary disturbance, and background solar wind or be-tween interplanetary disturbances are an important factor in the occurrence of intense geomagnetic storms. Based on our analysis, we seek to improve our understanding of the physi-cal processes in which large negativeBz’s are created which
will lead to improving predictions of space weather.
Key words. Interplanetary physics (Flare and stream dy-namics; Interplanetary magnetic fields; Interplanetary shocks)
1 Introduction
According to Tsurutani and Gonzalez (1997 and references therein), interplanetary events with interplanetary magnetic fields (IMFs),Bz, of less than−10 nT and a duration longer than three hours, tend to cause intense geomagnetic storms. Strong southward IMFs are an important factor in the occur-rence of geomagnetic storms. Tsurutani et al. (1988) have made a study of the causes of the southward Bz
compo-nent responsible for major geomagnetic storms near the pre-vious solar maximum (1978–1979). From their analysis of 10 cases they concluded that the negative Bz was caused
by internal fields of ejecta for only four cases. For others there were various causes such as sheath field ahead of ejecta or shock intensification of pre-existing IMF. McComas et al. (1989) studiedBzperturbations induced by a draped
mag-netic field ahead of fast coronal mass ejections (CMEs). Wu, Dryer, and Wu (1996) and Wu et al. (1996) suggested the formation ofBzcaused by interplanetary shocks using
three-dimensional MHD simulation. On the other hand, Marubashi
Correspondence to:S. Watari ([email protected])
(1997 and references therein) noted the importance of inter-planetary magnetic flux ropes as a source of geomagnetic storms. Cane, Richardson, and St. Cyr (2000) studied all halo/partial, halo coronal mass ejections (CMEs) detected by the LASCO coronagraphs on board the SOHO space-craft during 1996–1999 and compared them to geomagnetic storms. They noted that the southward IMF associated with ejecta determined mainly their geo-effectiveness, regardless of whether ejecta was a magnetic cloud structure or not.
We studied the interplanetary disturbances with strong southward IMF near the maximum of solar cycle 23. Al-most continuous observations of solar wind and solar activi-ties from space near the maximum of solar cycle 23 enabled us to study the relation between solar activities and strong southward IMF. Our analysis is complementary to the study made by Tsurutani et al. (1988) for the previous solar cycle. However, our study includes more cases.
2 Data sources
We analyzed geomagnetic storms with Dst indices of less
than−100 nT between 1998 and 2000. There were 30 such cases which satisfied this criterion. In our analysis, hourly averaged solar wind parameters (magnetic field, speed, den-sity, and temperature) observed by the ACE spacecraft were used to study the cause of strong southward IMFs associated with the geomagnetic storms. The solar observations of the SOHO and Yohkoh spacecrafts were used to identify the so-lar sources of the geomagnetic storms.
Table 1 lists the starting dates of magnetic storms, types of storms, minimum values ofDst index and minimum
val-ues ofBzduring the storms, the causes of strong southward
674 S. W atari et al.: F ormatio n of a stro ng southw ard IMF
Table 1. List of geomagnetic storms ofDst index less than−100 nT (SC: Sudden Commencement of a geomagnetic storm, SG: Gradual commencement of a geomagnetic Storm, CIR: Corotating Interaction Region, CME: Coronal Mass Ejection, DSF: Disappearing Solar Filament).
no. start date of geo- “type of min.Dst min.Bz cause of solar source ocurrence date average speed
magnetic storm storm” (nT) (nT) southwardsBz solar source (km/s)
1 1998/02/17 13:00 SG −100 −13.0 flux rope partial halo CME 1998/02/14 07:00 534
2 1998/03/10 00:00 SG −116 −13.7 CIR cornal hole
3 1998/05/01 21:55 SC −205 −22.9 (flux rope)+shock halo CME (S18E20), cusp 1998/04/29 16:58 787
4 1998/06/25 16:36 SC −101 −13.5 flux rope+shock (DSF, south-west), arcade 1998/06/22 17:57 590
5 1998/08/06 07:35 SC −138 −17.6 (weak shock) arcade (south-west), (SOHO vacation) 1998/08/03 00:00 524
6 1998/08/26 06:50 SC −155 −11.5 sheath+(flux rope) X1.0/3B (N35E09), proton-event, (SOHO vacation) 1998/08/24 21:50 1263
7 1998/09/24 23:45 SC −207 −17.3 sheath+(flux rope) M6.9/3B (N18E09), proton-event, (SOHO vacation) 1998/09/23 06:40 1014
8 1998/10/18 19:54 SC −112 −22.8 flux rope halo CME, DSF (N19E10) 1998/10/15 10:04 509
9 1998/11/07 08:15 SC −149 −11.7 (shock)+flux ropes
10 1998/11/08 04:00 −13.9 halo CME, M8.4/2B (N22W18) 1998/11/05 19:00 731
11 1998/11/13 01:00 SG −131 −17.6 flux rope partial-halo CME, DSF (north-east) 1998/11/09 17:54 527
12 1999/01/13 10:54 SC −113 −15.7 CIR coronal hole
13 1999/02/18 02:46 SC −134 −24.4 sheath+(flux rope) M3.2/SF (S23W41), (SOHO data gap) 1999/02/16 02:49 869
14 1999/04/16 11:24 SC −105 −15.2 flux rope partial-halo CME, EIT wave (south-center) 1999/04/13 03:30 521
15 1999/09/22 11:45 SG −164 −19.2 ejecta halo CME (south-east) 1999/09/20 06:06 777
16 1999/10/21 15:54 SG −231 −28.6 (flux rope)+CIR halo CME 1999/10/18 00:26 476
17 1999/11/12 19:00 SG −100 −11.2 ejecta (flux rope) M1.5/1N (N17W21), (SOHO data gap) 1999/11/10 15:44 813
18 2000/02/11 02:14 −14.7 halo CME, M1.3/1B (N25E26), cusp, EIT wave 2000/02/08 08:42 636
2000/02/11 23:52 SC −169 shock halo CME, C7.4/2F (S17W40 2000/02/09 19:26 795
19 2000/04/06 16:31 SC −321 −22.9 sheath halo CME, DSF, C9.7/2F (N16W66), proton-event 2000/04/04 15:11 845
20 2000/05/23 14:00 SG −147 −22.9 shock(ejecta) partial halo CME, C7.6/1N (S15W08) 2000/05/20 05:26 517
21 2000/07/15 14:38 SC −300 −42.8 (sheath)+flux rope halo CME, X5.7/3B (N22W07), proton-event 2000/07/14 10:03 1458
22 2000/08/10 04:00 SG −103 −13.0 flux rope
23 2000/08/11 18:45 SC −237 −25.8 flux rope halo CME, arcade 2000/08/09 16:30 829
24 2000/09/17 14:24 SG −172 −21.3 sheath+(flux rope) halo CME, M2.0/1N (N12E07) 2000/09/15 14:29 870
25 2000/10/04 07:00 SG −192 −21.4 flux rope+shock X1.2/SF (N07W91) ? 2000/09/30 23:24 523
26 2000/10/12 22:28 SC −110 −13.2 flux rope halo CME, C6.7/1F (N01W14), arcade 2000/10/09 22:32 579
27 2000/10/28 09:52 SC −113 −16.5 flux rope halo CME, C4.0, cusp, proton-event 2000/10/25 08:45 570
28 2000/11/06 09:48 SC −159 −11.5 seath+flux rope halo CME, C3.2/SF (N02W02), arcade 2000/11/03 18:51 662
29 2000/11/10 06:26 SC −104 −7.7 shock halo CME, M7.4/3F (N10W77), arcade, proton-event 2000/11/08 22:42 1313
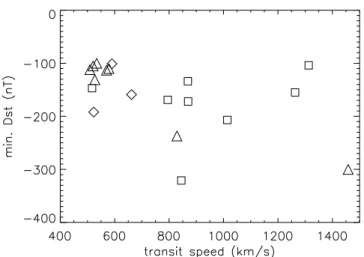
We first investigated the relationship between the transit speeds of the interplanetary disturbances and the minimum values of the Dst indices during the geomagnetic storms.
Figure 1 shows a scatter plot of these parameters for all of the storms listed in Table 1 for which solar sources were identi-fied, sorted on the interplanetary drivers. Squares, triangles, and diamonds represent the storms associated mainly with in-terplanetary magnetic flux ropes, sheath regions (or shocks), and interactions, respectively. According to Fig. 1, a corre-lation between the speed and the magnitude of geomagnetic storms is not clear. The correlation is weak even though the magnetic storms were associated with sheath regions or in-teractions. This result is consistent with the result by Cane, Richardson, and St. Cyr (2000) (see their Fig. 4).
3 Cause of strong southward IMF
In this section we will discuss the various interplanetary causes of the southwardBzlisted in Table 1, illustrating the
categories with examples of the interplanetary data together, with theDst signatures.
3.1 Corotating Interaction Regions (CIRs)
Geomagnetic storms of numbers 2 and 12 listed in Table 1 were associated with CIRs. The number of geomagnetic storms associated with CIRs was small because the studied period was near the maximum of solar cycle 23. Many geo-magnetic storms caused by CIRs are usually observed during the declining phase of solar cycles (Watari, 1997; Watari and Watanabe, 1998).
3.2 Southward IMFs associated with magnetic flux ropes According to Table 1, the magnetic flux ropes were observed in 21 of 30 geomagnetic storms. And they were the main cause of strong southward IMF in 10 out of 30 geomagnetic storms.
Figure 2 showsDstindex and one-hour-shifted solar wind
parameters (magnetic fields, speed, density, temperature,β, and ratio of helium and hydrogen) of storm no. 21 on 15 July 2000. The solar wind parameters were measured at the L1 point, approximately 1.5×10⁶km upstream from the Earth. Hence, we plotted the one-hour-shifted values to compare them with theDst index observed at the Earth. Two
verti-cal solid lines in Fig. 2 indicate the start and end times of the geomagnetic storm. The dashed curve plotted in the tem-perature panel shows the temtem-perature calculated from the so-lar wind speed by using the correlation between soso-lar wind speed and proton temperature (Lopez, 1987). The abnor-mally depressed proton temperature compared with the cal-culated temperature has often been observed in the case of interplanetary magnetic flux ropes or ejecta (Richardson and Cane, 1993). Lowβor higher ratios of helium and hydrogen were other signatures of ejecta (Goldstein, Neugebauer, and Clay, 1998).
Fig. 1.A scatter plot of average transit speed of interplanetary dis-turbances and minimumDstindex of geomagnetic storms (square:
magnetic flux rope, triangle: shock, and diamond: interaction).
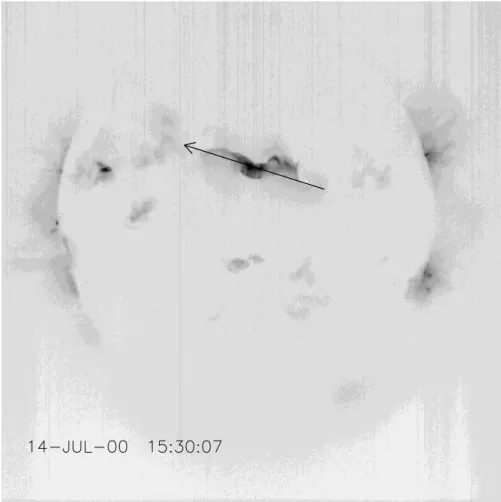
Storm no. 21 is an example of a storm caused by a mag-netic flux rope with a strong axial magmag-netic field (approxi-mately 80 nT) and high speed (more than 1000 km/s). This magnetic flux rope was associated with the halo CME on 14 July 2000 (the so-called “Bastille Day event”) and produced an intense geomagnetic storm. Figure 3 shows a negative im-age of the soft X-ray solar observation associated with this event. This image was taken by the Yohkoh/Soft X-ray Tele-scope (SXT). The soft X-ray arcade expanded in the east-west direction. According to the result of a fitting of the cylindrical magnetic flux model (Marubashi, 1997) to the so-lar wind data, the orientation of the magnetic flux rope was longitude, 34 degrees and latitude, 10 degrees. The projected direction of the magnetic flux rope on the solar surface (the arrow in Fig. 3) is close to the orientation of the observed soft X-ray arcade. This suggests that the orientation of the mag-netic flux rope stayed constant during propagation, and there is a possibility to infer southward IMF inside the magnetic flux rope based on the orientation of soft X-ray arcades or on the solar observations. Watari, Watanabe, and Marubashi (2001) noted that orientations of interplanetary magnetic flux ropes correspond well to the orientation of a stretch soft X-ray solar activities or soft X-X-ray arcades).
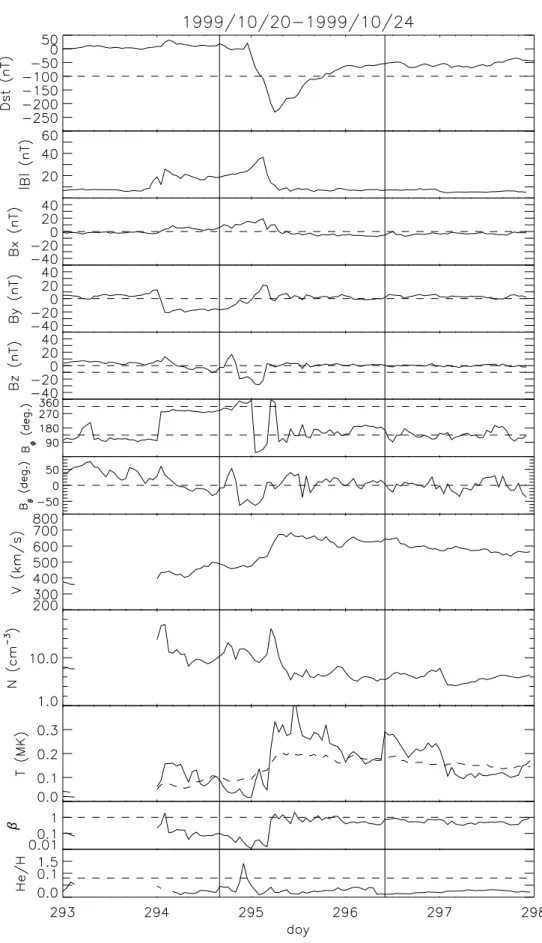
3.3 Interaction between a magnetic flux rope and a CIR Figure 4 shows the solar wind parameters andDst index of
storm no. 16 on 21 October 1999. According to this figure, southward IMF in the slow-speed ejecta was strengthened by the following high-speed solar wind or a CIR. This kind of event has been reported by Watari and Watanabe (1998). 3.4 Interaction between a magnetic flux rope and a
follow-ing shock
mag-676 S. Watari et al.: Formation of a strong southward IMF
Fig. 2.Dstindex and solar wind parameters of storm no. 21. Two vertical solid lines show the duration of the geomagnetic storm. Horizontal
Fig. 3. A negative image of soft X-ray observation of solar activity asso-ciated with storm no. 21. This image was taken by the Yohoh/SXT. The ar-row shows the projected orientation of the magnetic flux rope observed by the ACE spacecraft.
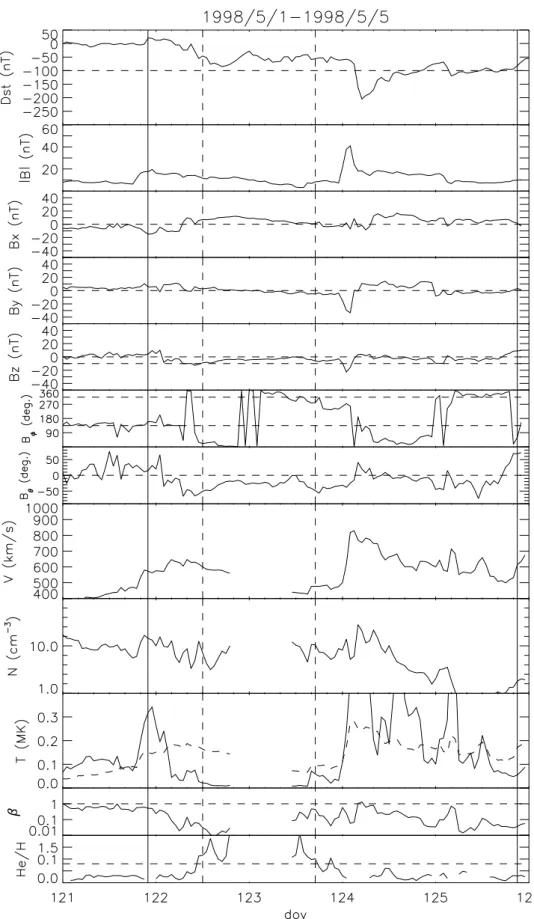
netic flux rope was associated with a halo CME on 29 April 1998. And then another strong shock arrived at the Earth. The strong southward IMF associated with this shock made the storm more intense. This is an example of a double-step storm (Gonzales et al., 2001).
The strong southward IMF of storm no. 4 was observed behind a magnetic flux rope (Fig. 6). In this case, the flux rope itself did not carry the strong southward component of IMF. A shock that penetrated into the flux rope possibly pro-duced the strong southward IMF.
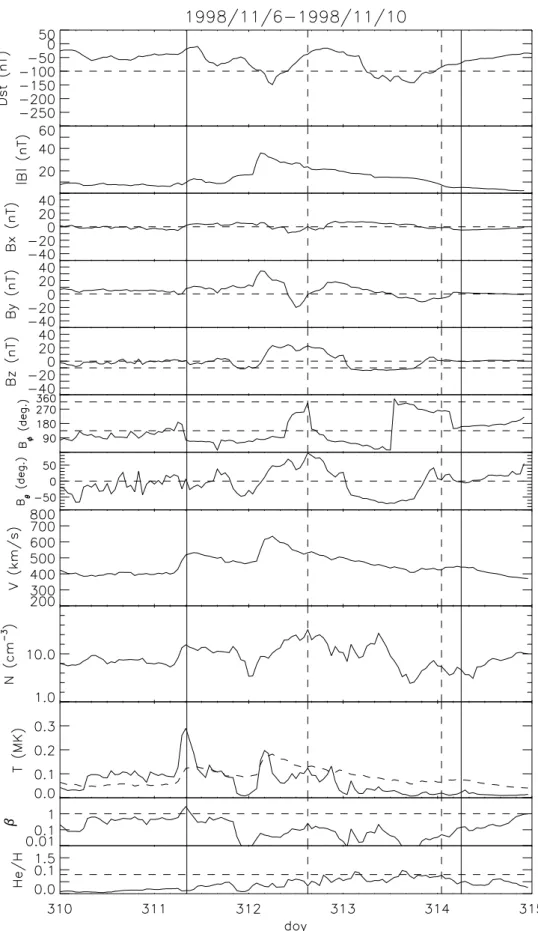
In storm no. 9, there were two major dips in theDstindex,
as shown in Fig. 7. The first dip corresponded to the south-ward IMF of an ejection in front of a strong shock, and the second dip corresponded to the southward IMF caused by a magnetic flux rope.
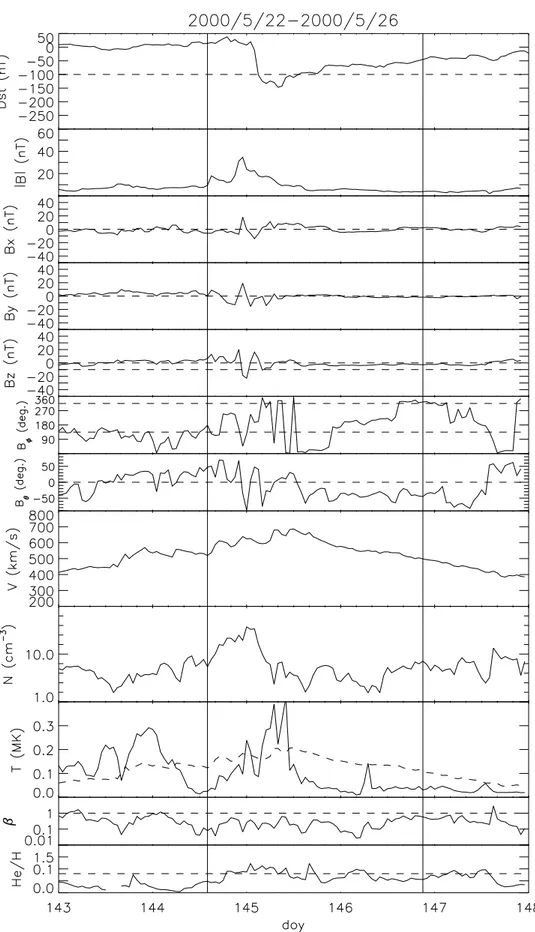
Figure 8 shows the plots for storm no. 20 on 23 May 2000. In this case, the southward IMF was formed between two ejecta. Figure 8 indicates that the collision of the ejecta strengthened the southward IMF.
3.5 Southward IMF in sheath
In storm no. 13, strong southward IMF of more than 20 nT was observed on 18 February 1999. This strong southward IMF was formed in the sheath region, as shown in Fig. 9.
This event was associated with the M3.2/SF flare that oc-curred at S23W41. Figure 10 shows a source surface map produced by the Wilcox Solar Observatory. The solar source of the storm (a circle in Fig. 10) was located in the south-ern solar hemisphere in the away sector and an upper part of ejecta was expected to pass the Earth. The southward IMF in front of ejecta in the upper panel of Fig. 13 can explain the southward IMF of this event. This example suggests that it is possible to infer the southward IMF expected at 1 AU according to the solar observations.
Figure 11 shows the plot for storm no. 24 on 17 Septem-ber 2000. Two dashed lines show a duration of a magnetic flux rope. A high-speed interplanetary disturbance with a speed of more than 800 km/s formed a sheath region with strong southward IMF, and the geomagnetic storm began at the same time as the arrival of this disturbance. Then there was a magnetic flux rope behind the sheath region. However, this magnetic flux rope did not have strong southward IMF in this case.
3.6 Miscellaneous
Figure 12 shows theDst indices and the solar wind
678 S. Watari et al.: Formation of a strong southward IMF
Fig. 5. Dst index and solar wind parameters of storm no. 3. Two vertical solid lines show the duration of the geomagnetic storm and two
680 S. Watari et al.: Formation of a strong southward IMF
Fig. 6. Dst index and solar wind parameters of storm no. 4. Two vertical solid lines show the duration of the geomagnetic storm and two
Fig. 7. Dst index and solar wind parameters of storm no. 9. Two vertical solid lines show the duration of the geomagnetic storm and two
682 S. Watari et al.: Formation of a strong southward IMF
684 S. Watari et al.: Formation of a strong southward IMF
M3.2/ SF flare (S23W14)
Fig. 10.A source surface map produced by the Wilcox Solar Observatory. The circle shows the location of a M3.2/SF flare associated with the geomagnetic storm no. 13.
the magnitude of IMF increased to approximately 20 nT. The speed of the solar wind was approximately 400 km/s during this period. In storms numbers 15 and 17, strong southward IMFs were observed in low temperature ejecta. However, causes of these southward IMFs were uncertain.
4 Possibility to infer southward IMF
There are two main causes of the formation of southward IMF associated with transient events. One possible source is a southward component directly ejected from the Sun as interplanetary magnetic flux ropes. Another is a formation of southward IMF by an interaction between an interplane-tary disturbance and the background solar wind or between interplanetary disturbances.
It is possible, in some cases, to infer orientation of a mag-netic flux rope from solar observations (orientation of solar filaments that disappeared or soft X-ray arcades), by assum-ing that the orientation of the flux rope remains constant dur-ing propagation (see Sect. 3.2, storm no. 21). This means that it is possible to infer southward IMF inside the flux rope.
There are four ways to form southward IMF by interac-tion between ejecta and the IMF of the background solar wind (Fig. 13). In this figure, the ejecta travel from left to right. The southward IMF that forms in front of ejecta is well known (McComas et al; 1989; Wu, Dryer, and Wu, 1996). In contrast, we found the formation of southward IMF in the tail of the ejecta through the interaction with the following CIRs or shocks (see Sects. 3.3 and 3.4). According to Fig. 13, it is possible to infer southward IMF by using the sector of back-ground solar wind if we know which part (e.g. upper part or lower part) of the ejecta passes the Earth. The upper part of the ejecta tends to pass the Earth if the ejecta originates in the southern hemisphere of the Sun. On the other hand, the
lower part of the ejects tends to pass the Earth if the ejecta originates in the northern hemisphere of the Sun. For exam-ple, southward IMF in front of the ejecta observed at 1 AU is formed in the away sector in the upper part of the ejecta and in the towards sector in the lower part of the ejecta (see Sect. 3.5).
5 Discussion and summary
Southward IMF is an important factor in the intensity and duration of geomagnetic disturbances. One purpose of this study was to find a way to infer southBztwo- or three-days in
Fig. 11.Dst index and solar wind parameters of storm no. 24. Two vertical solid lines show the duration of the geomagnetic storm and two
686 S. Watari et al.: Formation of a strong southward IMF
Fig. 13. Formation of southward IMF through the interaction be-tween ejecta and IMF of the background solar wind. The upper panel shows the away sector and the lower panel shows the toward sector. The Sun is on the left-hand side, right is the direction to-wards the Earth, the horizontal gray arrow indicates the direction of the interplanetary magnetic field, the broad gray arrows indicate the direction of the field draped around the ejecta. The ejecta travel from the left side to the right side in this figure. “Bs” means south-ward IMF.
Acknowledgements. We would like to thank the ACE Science Center for the use of solar wind data measured by the ACE spacecraft, D. J. McComas (Los Alamos National Laboratory) for the ACE/SWEPAM data, and N. F. Ness, L’Heureux, and C. W. Smith (Bartol Research Institute) and L. Burlaga and M. Acu˜na (NASA/GSFC) for the ACE/MAG data. SOHO is a joint project of NASA and ESA. Soft X-ray solar images were provided from the Yohoh/SXT team. One of us (M.V.) was supported by project S1003006 form the Academy of Sciences of the Czech Re-public.
The Editor in Chief thanks Z. Smith for his help in evaluating this paper.
References
Cane, H., Richardson, I. G., and St. Cyr, O. C.: Coronal mass ejec-tions, interplanetary ejecta and geomagnetic storms, Geophys. Res. Lett., 27, 5391, 2000.
Goldstein, R., Neugebauer, M., and Clay, D.: A statistical study of coronal mass ejection plasma flows, J. Geophys. Res., 103, 4761, 1998.
Gonzalez, W. D., de Gonzaleze, C., Sobral, J. H. A., Lago, A. D., and Vieira, L. E.: Solar and interplanetary causes of very intense geomagnetic storms, J. Atmos. Solar-Terr. Phys., 63, 403, 2001. Lopez, R.: Solar cycle invariance in solar wind proton temperature
relationships, J. Geophys. Res., 92, 11 189, 1987.
Marubashi, K.: Interplanetary magnetic flux ropes and solar fila-ments, in: Coronal Mass Ejections, Geophys. Monogr. Ser., Vol. 99, edited by Crooker, N., Joselyn, J. A., and Feynman, J., p. 147, AGU, Washington, D. C., 1997.
McComas, D. J., Gosling, J. T., Bame, S. J., Smith, E. J., and Cane, H. V.: A test of magnetic field draping inducedBzperturbations
ahead of fast coronal mass ejecta, J. Geophys. Res., 94, 1465, 1989.
Richardson, I. G. and Cane, H. V.: Signatures of shock drivers and their dependence on the solar source location, J. Geophys. Res., 98, 15 295, 1993.
Tsurutani, B. J., Gonzalez, W. D., Tang, F., Akasofu, S. I., and Smith, E. J.: Origin of interplanetary southward magnetic fields responsible for major magnetic storms near solar maximum (1978–1979), J. Geophys. Res., 93, 8519, 1988.
Tsurutani, B. and W. Gonzalez: The interplanetary causes of mag-netic storms: A review, in: Magmag-netic Storms, edited by Tsuru-tani, B. T., Gonzalez, W. D., Kamide, Y., and Arballo, J. K., Geophys. Mon. Series, 98, 77–89, Washington D. C., 1997. Watari, S.: The effect of the high speed stream following the
coro-tating interaction region: Analysis of large south polar coronal holes observed between December 1993 and June 1994 and long-duration geomagnetic disturbances, Ann. Geophysicae, 15(6), 662–670, 1997.
Watari, S. and Watanabe, T.: The solar drivers of geomagnetic dis-turbances during solar minimum, Geophys. Res. Lett., 25, 2489, 1998.
Watari, S., Watanabe, T., and Marubashi, K.: Soft X-ray activities associated with interplanetary magnetic flux ropes, Solar Phys., 202, 363, 2001.
Wu, C.-C., Dryer, M., and Wu, S. T.: Three-dimensional MHD sim-ulation of interplanetary magnetic field changes at 1 AU as a con-sequence of simulated solar flares, Ann. Geophysicae, 14, 383, 1996.
Wu, C.-C., Dryer, M., Smith, Z., Wu, S. T., and Lyu, L. H.: Recipe for predicting the IMFBzpolarity’s change of direction