www.nat-hazards-earth-syst-sci.net/12/3659/2012/ doi:10.5194/nhess-12-3659-2012
© Author(s) 2012. CC Attribution 3.0 License.
and Earth
System Sciences
Development and implementation of a GIS-based tool for spatial
modeling of seismic vulnerability of Tehran
M. Hashemi and A. A. Alesheikh
Department of Geospatial Information Systems, K. N. Toosi University of Technology, Mirdamad Cross, Valiasr Street, Tehran 19697, Iran
Correspondence to:M. Hashemi ([email protected])
Received: 31 May 2012 – Revised: 3 September 2012 – Accepted: 17 November 2012 – Published: 17 December 2012
Abstract. Achieving sustainable development in countries prone to earthquakes is possible with taking effective mea-sures to reduce vulnerability to earthquakes. In this context, damage assessment of hypothetical earthquakes and plan-ning for disaster management are important issues. Having a computer tool capable of estimating structural and human losses from earthquakes in a specific region may facilitate the decision-making process before and during disasters. In-teroperability of this tool with wide-spread spatial analysis frameworks will expedite the data transferring process. In this study, the earthquake damage assessment (EDA) soft-ware tool is developed as an embedded extension within a GIS (geographic information system) environment for the city of Tehran, Iran. This GIS-based extension provides users with a familiar environment to estimate and observe the prob-able damages and fatalities of a deterministic earthquake sce-nario. The productivity of this tool is later demonstrated for southern Karoon parish, Region 10, Tehran. Three case stud-ies for three active faults in the area and a comparison of the results with other research substantiated the reliability of this tool for additional earthquake scenarios.
1 Introduction
Natural and human-induced disasters, from the Asian tsunami to hurricanes Rita and Katrina to the earthquakes in Pakistan, cause unpredictable losses in terms of human fatal-ities, private and public buildings, infrastructures, and finan-cial assets (Handmer and Dovers, 2007; Tinguaro Rodriguez et al., 2009). It is estimated that natural disasters cause 20 times greater losses in developing countries than in indus-trial countries (Westen, 2004). Disaster management deals
with complex decision making in different time periods and consists of prevention, responding, and recovery from nat-ural and human-made hazards (Michalowski et al., 1991). After the calamity, there is a limited time and possibility to carefully develop a representation of the incident; thus, much effort is devoted to preparation for the emergency situation (Michalowski et al., 1991).
Disaster management is not a simple process (Drabek and Hoetmer, 1991) and requires many experts from different fields to contribute and manage a large amount of data and information – a significant part of which is spatial. Thus, the geospatial information managers have an inevitable position in disaster management groups before, during and after the catastrophes.
The lack of a comprehensive and coherent planning to pre-vent and confront such disasters is a major issue in develop-ing countries (Handmer and Dovers, 2007). A basic require-ment for developing such plans is a damage assessrequire-ment of probable hazards and, more importantly, having a framework to facilitate and expedite such estimations.
Therefore, developing an easy-to-use framework for the assessment of damages and consequences of natural haz-ards is a critical issue in disaster management that may re-sult in more effective sustainable rehabilitation programs and preparedness (Tinguaro Rodriguez et al., 2009). There are several systems worldwide for disaster management. A de-cision support system called NEGOPLAN was introduced by Michalowski et al. (1991) to assist decision-makers for the assessment of their decisions during disasters. In other research, an expert system based on the fuzzy logic and a large database of historical hazards was developed by Tin-guaro Rodriguez et al. (2009) to verify the results of differ-ent disaster scenarios. If these tools were coupled with GIS
(geographic information system) and could receive, work, and generate spatial data, they would be worth more, be-cause not only spatial data are more understandable and user-friendly but also a major part of the involved data in disaster management is spatial.
Because Iran is one of the most earthquake-prone coun-tries on Earth and the cost of damages resulting from a severe earthquake to government, business, and families is very high, this research is devoted to this natural event. Numerous studies have attempted to analyze the histori-cal earthquakes in terms of spatio-temporal indices (e.g., Hashemi and Alesheikh, 2011a), geostatistical models (e.g., Ashtari Jafari, 2010), stochastic modeling (e.g., Zafarani et al., 2009), and geological and seismological inspections (e.g., Hamzehloo et al., 2007; Shabestari et al., 2004) to pre-dict future earthquakes. Additionally, various methods have been proposed and implemented to depict the consequences of hypothetical earthquakes in terms of risks (e.g., Karimi and H¨ullermeier, 2007), structural damages (e.g., Bird and Bommer, 2004; Feyza Cinicioglu et al., 2007; Ansal et al., 2009), fatalities (e.g., Hashemi and Alesheikh, 2011b; Ansal et al., 2009; Coburn and Spence, 2002; JICA, 2000), and the economic costs (e.g., Montoya and Masser, 2005; Ergonul, 2005) all over the world and especially for the city of Tehran (JICA, 2000; Hashemi and Alesheikh, 2011b).
Seismologists believe that Tehran is under threat of an in-tense earthquake in the near future (Ashtari Jafari, 2010; Sa-didkhouy et al., 2008; Yaghmaei-Sabegh and Lam, 2010). The quick urban development in Tehran has resulted in an increase in the levels of urban vulnerability to earthquakes. Tehran is one of the most risky cities in the Middle East re-gion because of the permanent population growth, with inap-propriate land use assignment, improper construction tech-niques, and poor infrastructure systems, accompanied by a high level of earthquake risk. Thus, this study aims to de-velop, implement and apply a GIS-based tool that allows the disaster managers to estimate and observe the structural and human impacts of different deterministic earthquake scenar-ios in the city of Tehran.
The methodology used for estimation of damages has been developed in another study by Hashemi and Alesheikh (2011b) based on the attenuation relation of mod-ified Mercalli intensity (MMI), building fragility curves, and the damages of historical earthquakes. In this paper, we only use the mentioned study for the development of the earthquake damage assessment extension (EDA extension) of ArcMapTM using ArcObjectsTM and Microsoft Visual StudioTM 8. Hashemi and Alesheikh (2011b) did not por-tray the results of their damage assessment methodology for more than one earthquake scenario. Thus, this research aims to extend their method for all the main faults around the city, lessen the time span of the process, and make the extension easy to use by any ArcGIS user.
ArcObjectsTM is chosen because it allows access to functionalities that are not available via ArcMapTM,
ArcCatalogTM, or ArcSceneTM interfaces. It provides cus-tomization of the interface for end users and facilitates adding functionality written by a third party Component Ob-ject Model compliant (COM compliant) programming lan-guage such as Visual Basic .NET, C++, Java, and Python (University of Durham, 2007).
This research is organized in five sections. Section 1 de-scribes the importance of the subject matter and presents an overview of the selected studies related to the purpose of this paper. Additionally, it highlights the productivity of the de-veloped framework in disaster management for facilitating frequently used processes and exposing them to other en-gaged persons and organizations. The methodology of ca-sualty estimation and the postulates of EDA extension are described in Sect. 2. A brief introduction of the applied pro-gramming framework and the workflow of the developed tool are presented in Sect. 3. Section 4 demonstrates the results of the application of EDA tool for six earthquake scenarios in Tehran. Section 5 outlines the conclusions and future works.
Background
Damage estimation methodologies are classified into two main types: regional and building specific. Because our ap-proach belongs to the former category, this section focuses on a few regional earthquake damage assessment method-ologies.
Regional vulnerability evaluation attempts to estimate structural damages for a large number of buildings in a ge-ographical region such as a city (Ramirez, 2009). One of the first attempts to estimate the number of injuries, casu-alties, and economic losses for six earthquake scenarios in the San Francisco Bay was conducted by Algermissen et al. (1972). In 1997, the Federal Emergency Management Agency (FEMA) and the National Institute of Building Sci-ences (NIBS) launched a GIS-based regional loss estima-tion tool called HAZUS (NIBS, 1997). HAZUS is a naestima-tion- nation-ally applicable, standardized methodology and software pro-gram for estimating potential regional losses caused by natu-ral calamities. The HAZUS earthquake loss estimation mod-ule has a building classification system including 36 building types (Aslani, 2005). Bird and Bommer (2004) evaluated the damage to each section of the regional infrastructure from ground shaking. Feyza Cinicioglu et al. (2007) inspected the damages caused by ground shaking, landslide, and liquefac-tion separately and collectively.
The earthquake damage estimation methodologies and computer-based tools are highly dependent on the existence of census, demographic, and building inventories, the level of detail and availability of geographical data, the geology of the region, the structures of the surrounding faults, the historical seismicity, and the social, economic, and political supports. Thus, any methodology or tool that is developed for a geographical region cannot be applied to other districts
with different characteristics, unless precise inspections and modifications are considered.
The dynamic interaction between urban components or subsystems and diverse forms of vulnerability (Rashed, 2003) and the concept of chain of losses and failures (Menoni and Pergalani, 1996) proves that vulnerability is an inher-ently spatial problem. Integrating GIS technology into a field with a drastic requirement to address various spatial problems, analyses, and decisions has motivated many re-searchers to automate the vulnerability estimation procedure by using GIS. Assessing rockfall susceptibility (Lan et al., 2007), landslide susceptibility (Vahidnia et al., 2010; Mowen et al., 2007), wind damage (Zeng et al., 2007), and ground-water containment distribution (Morio et al., 2010; Ali Ak-bar et al., 2011) are only a few attempts to involve GIS in the assessment of vulnerability due to different natural and man-made hazards.
To join this trend and obviate a city-wide problem of au-tomating earthquake damage assessments, this study targets developing a GIS-based tool that may be used before and dur-ing the seismic disasters. The tool can estimate the structural and human losses caused by strong ground motions. If it is used before the event occurs, it allows the municipal man-agers to evaluate the extent of damages and plan to retrofit structures or to prepare for relief. If it is used during the catastrophe, it assists making a primary estimation of ruins.
2 Materials and methods
2.1 Study area
The continental convergence between the Arabian and the Eurasian plates (Sadidkhouy et al., 2008) makes Iran one of the most tectonically active regions of the world. Instru-mental and historical seismicity highlights three belts of ac-tive deformation in Iran: the Zagros range to the southwest, the Alborz range to the north, and the Kopet Dag range to the northeast (Martini et al., 1998). The highly populated metropolis of Tehran is located at the southern foothills of the Alborz Mountains (Ashtari et al., 2005; Doloei and Roberts, 2003; Martini et al., 1998) and is limited to the south by the Bibi-Shahrbanoo Mountain and to the east by the Sepah Mountain (Yaghmaei-Sabegh and Lam, 2010).
Three main active fault zones have surrounded the city: the Mosha Fault, the North Tehran Fault, and the Eyvanekey Fault. Hamzehloo et al. (2007) assigned magnitudes up to M l7.2 to the earthquakes associated with these faults chang-ing based on their lengths.
The Mosha Fault, at approximately 50 km from the cen-ter of Tehran and 200 km long (JIC, 2000; Hashemi and Alesheikh, 2011a), seems to be one of the most active faults in the area. This fault has experienced earthquakes of magni-tudes larger than 6.5 in 958, 1665, and 1830 (Ashtari et al., 2005). Hashemi and Alesheikh (2011a) showed that the
east-ern part of the Mosha Fault is more capable of generating large earthquakes than the other faults in Tehran region by using spatio-temporal analyses of the historical earthquakes. Zafarani et al. (2009) showed that the Mosha Fault is capable of generating earthquakes as large as M l7.4. As the first case study, an M l6.4 earthquake scenario is assigned to this fault, so that we can compare our estimations with Hashemi and Alesheikh (2011b) results.
The North Tehran Fault over 90 km is located between the western part of the Mosha Fault and the metropolis of Tehran, but its northwestern part is pretty far from Tehran. If the North Tehran Fault is activated, the impacts will be heavier than those which would be due to the re-happening of the earthquake in 958 associated with the Mosha Fault, because the North Tehran Fault is located near and inside the city. Zafarani et al. (2009) believed that this fault can cause earthquakes up to a magnitude of M l7.2. The casualties from a hypothetical M l6.4 earthquake originating from this fault are estimated using EDA tool as the next case study.
The Eyvanekey (northern Ray) Fault is located at the southern part of the city, where the soil is soft and the build-ings are more vulnerable. The Eyvanekey Fault, over 60 km long, extends along the Kahrizak (southern Ray) Fault in a distance that ranges from 3 to 5 km. JICA (2000) hypothe-sized that these two faults have the same root and they are branches of one fault. Martini et al. (1998) showed that the Eyvanekey Fault can generate earthquakes as large as M l7.4 in the near future. However, Zafarani et al. (2009) estimated a maximum magnitude of M l6.7 for this fault. EDA GIS ex-tension is used for the assessment of the structural and human tolls of an M l6.4 earthquake associated with this fault as the last case study.
Because we consider the same magnitude for all three earthquake scenarios, the loss estimations of different sce-narios are comparable. Although an extensive building in-ventory and census database compatible with EDA tool is provided for the city of Tehran by the municipality in 2006, only a small part of the data located at the southern Ka-roon parish in Region 10 of Tehran is exposed to this study by the Prevention and Crisis Management Organization of Tehran. This parish is located between the longitudes of 51◦
21′ 50′′
–22′ 12′′
E and latitudes of 35◦ 40′
50′′ –41′
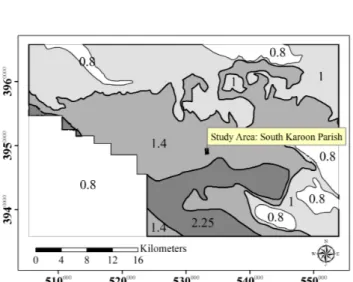
24′′ N. Figure 1 shows the city of Tehran and the main surround-ing faults. The study area is highlighted in this figure. The population of southern Karoon parish is 26 498 people, of which 51 % are male living in 5293 buildings. This area has an old context and urban structure with 61 % adobe build-ings, which makes it too vulnerable to probable future earth-quakes.
Fig. 1.Study area: southern Karoon parish, Tehran, Iran and the surrounding active faults.
2.2 Methodology
The choice of the damage estimation method, available databases, and the seismic hazard records and experiences are the most important causes of great diversity in earth-quake damage studies accomplished in earthearth-quake-prone ar-eas around the world (JICA, 2000; Schneider and Schauer, 2006; Westen, 2004). The dependence of the damage esti-mation method on local characteristics of buildings and soils emphasizes that the damage assessment method must be cus-tomized for each region. That is why this tool is developed based on one of the recent earthquake damage studies by Hashemi and Alesheikh (2011b) in the metropolis of Tehran. What follows are the details of the applied data, damage es-timation method, the way that the method is fragmented into algorithms, and the framework of the tool.
2.2.1 Structural damage estimation methodology
The ground shaking impact of the Mosha Fault is the only considered cause of damage to buildings in the work of Hashemi and Alesheikh (2011b), because it is the most dev-astating seismic hazard (Bird and Bommer, 2004; Feyza Cinicioglu et al., 2007). Hashemi and Alesheikh (2011b) estimated the earthquake intensity at each building location using modified Mercalli intensity (MMI) attenuation relation corrected for local geology. They used Eq. (1) to calculate the ground motion intensity, which is also used by some other re-searchers (Crespellani et al., 1991; Borcherdt, 1997).
MMI=8.6+1.48M−6.4 log(d+14)+
δIMMI
– + 3.48 log (Fv)
tion take into ac
δI (1)
Table 1.Characteristics of different structural types.
1 Steel-1 Steel MRF structure, built after 1992, with 1 to 3 stories 2 RC-0 RC MRF structure, with more than 6 stories
3 Steel-2 Steel MRF structure, built before 1991 or with more than 4 stories
4 Brick and steel, or stone and steel
5 RC-1 RC MRF structure, built after 1991 and with 1 or 2 stories 6 RC-2 RC MRF structure, built before 1991 or with more than 3 stories
7 All wood
8 Cement block, brick and wood, stone and wood, all brick, stone and brick 9 Sun-dried brick and wood, sun-dried brick and mud
Fig. 2.Amplification in the velocity band (Fv)around the city of Tehran and study area.
The MMI values obtained from the above equation take into account the earthquake scenario, earthquake source charac-teristics and site-specific geological and geotechnical data. In the above equation, M indicates the magnitude of the earthquake anddstands for the distance between each build-ing and fault in km. The last term of Eq. (1) represents the MMI increases (δIMMI) due to local geology (Feyza Cini-cioglu et al., 2007). Fv in the last term represents the am-plification in the velocity band. This factor is obtained for each region based on the average shear wave velocity over a depth of 30 m (Feyza Cinicioglu et al., 2007). Shafiee and Azadi (2007) obtained shear-wave velocity characteristics for different geological units throughout Tehran based on Vs(30) values measured in 188 seismic profiles. Addition-ally, site amplification factors for different site conditions are organized by AS/NZS 1170.4 (2005), which are compatible with the information provided by Shafiee and Azadi (2007). Figure 2 depicts amplification in the velocity band (Fv) for different parts of Tehran based on the combined results of the two mentioned studies (Shafiee and Azadi, 2007; AS/NZS 1170.4, 2005). According to this figure, theFv in the study area is 1.4.
The damage to different building categories is estimated by using nine fragility curves (Fig. 3). These curves model the damage ratio to each building type based on the earth-quake intensity at the location of building. They are devel-oped in JICA (2000) project based on damage observations of different building types in historical Iranian earthquakes. They classified buildings into nine groups based on the struc-tural type, number of stories and the construction year. Next, they developed a fragility curve for each group. The de-tailed information of each building category is listed in Ta-ble 1. These fragility curves are adopted in EDA tool for the calculation of ground-shaking–induced damage to buildings.
Algorithm for structural damage estimation
Damage to buildings is calculated in four stages. Because the distance between the desired site and the fault is required in Eq. (1), at the first stage, the user must choose one of the three active faults in the area. The tool then calculates the distance between the fault and each building and stores it for each building as an attribute. Another required parameter,Fv, is obtained from Fig. 2 for each building and stored automat-ically as an attribute of building data set. At the second stage, MMI is calculated from Eq. (1) at each building location. Be-cause the distance to the fault andFvexist from the previous stage, the only parameter that must be specified by the user in this step is the earthquake magnitude. Finally, the calcu-lated earthquake intensity is stored for each building as an attribute.
In the third step, the damage to buildings has to be de-termined based on the building type, related fragility curve, and the MMI at the location that comes from the previ-ous step. For the purpose of this paper, damage estima-tion equaestima-tions for different building types are determined based on the translation of fragility curves (Fig. 3) into pro-grammable polynomials. Next, the appropriate equation for each building is selected based on its type to calculate and store the percent damage. This part of the computations that is more intricate and time-consuming used to be handled in the MATLABTM environment. In the fourth, or last step, the calculated damages are classified into ten equidistance
Fig. 3.Fragility curves indicating damage ratio based on MMI for different structural types in Tehran developed by JICA (2000).
batches and a convenient symbol is assigned to each class. Therefore, the user can observe the results based on a color ramp.
2.2.2 Casualty estimation
Hashemi and Alesheikh (2011b) considered only the build-ing collapse impact on human casualties, because the cha-grining experiences highlight that 69 % of the fatalities of historical earthquakes have been caused by building col-lapses (Daniell et al., 2011). Although there have been many studies and proposed methods of fatality appraisals around the world (Ansal et al., 2009; JICA, 2000; Coburn and Spence, 2002), the Hashemi and Alesheikh (2011b) method is preferred here, because its parameters are customized for the city of Tehran, where EDA tool is assumed to be used. They estimated the number of casualties in each building sep-arately based on its type, percent damage, population, and the day/night fatality ratio in the following manner:
Number of deceased people=Day/night fatality ratio (2)
×Population×Percent damage×Mortality ratio
Number of injured people=Day/night fatality ratio (3)
×Population×Percent damage×Injury ratio
The mortality and injury ratios are presented in Table 2 based on the building type. Although these ratios are obtained for collapsed buildings of each type, they will be adjusted by the percent damage in Eqs. (2) and (3). In addition, these ratios are determined pessimistically (i.e., a higher weight is given to the worse cases). Figure 4 shows the relationship between MMI and the fatality ratio in daytime to nighttime developed based on the previous actual damages in Iran by Hashemi and Alesheikh (2011b).
Because the fatality ratio for the nighttime scenario, when the residents are in their houses, is considered 1 in this article, the ordinate of the above diagram may directly indicate the fatality ratio for the daytime scenarios of different MMIs. For example, the daytime fatality ratio is 0.92 for an MMI of 6.4.
0 0.2 0.4 0.6 0.8 1 1.2
6 7 8 9 10
day/night ratio
MMI
Fig. 4.Daytime/nighttime fatality ratio obtained from historical Ira-nian earthquakes (Hashemi and Alesheikh, 2011b).
Table 2.Mortality and injury ratios for different building types in Tehran, Iran (Hashemi and Alesheikh, 2011b).
Building Type Mortality ratio Injury ratio
RC buildings with 4 stories or more 1 0
RC buildings with less than 4 stories 0.8 0.2 Masonry buildings with 4 stories or more 0.6 0.4 Masonry buildings with less than 4 stories 0.5 0.5 Steel buildings with 4 stories or more 0.5 0.4 Steel buildings with less than 4 stories 0.4 0.4
Timber frame buildings 0.3 0.4
Algorithm for casualty estimation
This part of the program is divided into four steps. The first step determines the day/night fatality ratios for each build-ing. As Fig. 4 shows, this parameter depends on the occur-rence time and MMI. The MMI at the location of each build-ing is already calculated and available. The time of the event is received from the user by the designed user interface. If the user selects the night as the time of the incident, the day/night fatality ratio is considered 1, because it is assumed that all residents are at their houses. If the day is selected, the day/night fatality ratio is determined from Eq. (4) which converts the diagram in Fig. 4 to a linear equation.
Day/night fatality ratio=(−0.2×MMI)+2.2 (4) In the second step, the mortality and injury ratios from Ta-ble 2 are assigned to each building based on its type. Because all variables in Eqs. (2) and (3) are calculated and existent for each building, the third stage estimates and stores the num-ber of killed and injured people in each building. Fourth step aims to represent the fatalities in each building based on a graduated color ramp. For this purpose, first the total num-ber of killed and injured people in each building is calculated and stored as a new attribute of the building. Next, the re-sults are categorized and an appropriate symbol is assigned to each category. Thus, the user can observe the human losses visually.
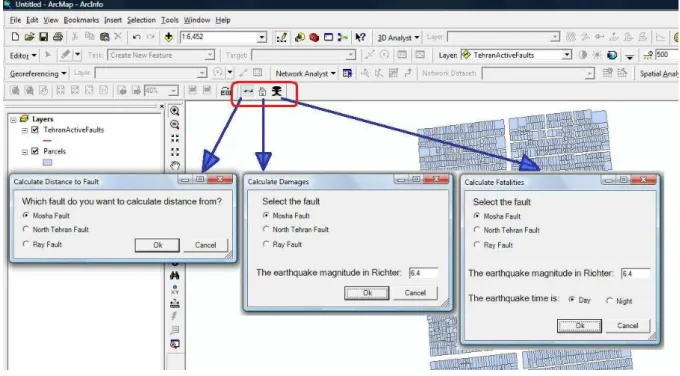
Fig. 5.Earthquake damage assessment (EDA) tool: commands and associated window forms.
3 Framework of EDA tool
Using a programming language integrated in GIS has ad-vantages for spatial modeling that are discussed by miscel-laneous experts (Karssenberg, 2002; Karssenberg and De Jong, 2005). ArcObjectsTM and Microsoft Visual StudioTM 8 are used to develop the windows-based system. The topic of ArcObjectsTM usually appears when users comprehend that programming ArcObjectsTM can actually decrease the amount of repetitive work, streamline the workflow, and even generate functionalities that are not readily available in Ar-cGIS (Chang, 2007). ArcObjectsTMis built using Microsoft’s Component Object Model (COM) technology. Therefore, it is possible to extend ArcObjectsTM by writing COM com-ponents using any COM-compliant development language (Zeller, 2001). Here, we used an external development en-vironment named C#. Additionally, while loosely coupled models require the model to exchange data with the GIS, ArcObjectsTM, a quite tightly coupled approach with the GIS, allows the model to access and manipulate spatial and attribute data that ArcMapTM(an application of ArcGIS) has opened in memory (Stevens et al., 2007).
The total module of EDA tool is created as a base toolbar (DLL) embedded into the ArcMapTM. The tool consists of three base commands, each of which has an appropriate user interface in the format of window forms. The user interfaces assist the user to develop his/her favorite scenario in three steps: (1) selecting one of the faults, (2) choosing a magni-tude for the hypothetical earthquake, and (3) selecting the
time of the occurrence. EDA toolbar and the window forms associated with each command are shown in Fig. 5.
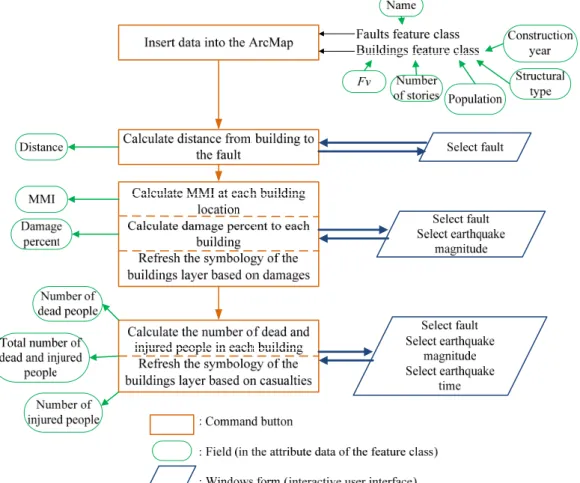
The user interfaces have the flexibility to guide and alarm the user if there is a problem during the process, such as lack of the required attributes in the building data set, defining a repetitive earthquake scenario, or not using the commands in the specified order. The overall workflow of EDA tool is shown in Fig. 6. The information required or produced at each command is represented by ellipses. This new informa-tion is stored as new fields (column) in the attribute table of the feature class.
Command 1: Calculate distance to fault
This command requires the geometry field of both fault and building feature classes. It generates a new numerical field in the attribute data table of the building feature class. The distance between the building and the selected fault is stored in this field.
Command 2: Calculate damages
The user interface of this command asks the user to select a fault and specify a magnitude. If there is a field in the at-tribute table of the building feature class showing the dis-tance to the fault and another field showing the Fv at the location, this command adds two new fields to the attribute table of the building feature class: (1) MMI at each building location and (2) percent damage to each building. At the end of the process, the results are shown to the user graphically.
Fig. 6.Workflow of earthquake damage assessment (EDA) tool.
Command 3: Calculate fatalities
The user interface of this command asks the user to select a fault, specify a magnitude, and choose a time for the hypo-thetical earthquake. The defined earthquake scenario in the user interface must not be repetitive; otherwise an alert will inform the user that the results of this scenario have been al-ready calculated and available in the attribute data table of the building feature class. In addition, to calculate the num-ber of fatalities, this command requires the percent damage of each building. The percent damage must be calculated via the previous command and available via attribute data table of the building feature class. Therefore, if the user has not executed the previous command before this one, an alert will refer him/her to the appropriate command. If the scenario is not repetitive and the order of commands is observed, three new fields are generated and filled in the attribute data table of the building feature class: (1) the number of killed people, (2) the number of injured people, and (3) the total number of killed and injured people. Finally, the human losses are presented graphically using a color ramp.
It was possible to program or code the entire process in only one command. In other words, it was possible to
cal-culate the distances, damages, and fatalities, all in the last command. However, separating the components makes them reusable for other purposes. For example, another tool or command may benefit from the components of the current program or even the user may utilize the first or second com-mands of EDA tool for other purposes. That is why the user is required to enter the fault and the magnitude of the scenario in each step.
4 Demonstration and validity of EDA tool
Three case studies are considered for three main faults around the city, each of which implemented for either day and nighttime scenarios. The first case study belongs to an M l6.4 earthquake generated by rupture of the Mosha Fault. The damages to buildings and casualties for the daytime sce-nario are depicted in Fig. 7.
Damage to 32 % of the buildings is between 11 to 32 %, damage to 6 % of the buildings between 62 to 71 % and the rest of the buildings experience a total collapse. According to the estimations, 9183 people for the nighttime scenario and 5893 people for the daytime scenario out of 26 498 people are
(a) (b)
Fig. 7. (a)Structural damages due to an M l6.4 earthquake associated with the Mosha Fault and(b)casualties for the daytime scenario.
(a) (b)
Fig. 8.Casualties due to an M l6.4 earthquake associated with the North Tehran Fault:(a)nighttime scenario;(b)daytime scenario.
killed and 8139 people for the nighttime scenario and 4953 people for the daytime scenario are severely injured.
Evaluation of the proposed method requires the detailed statistical information about the structural damages and hu-man losses of a real earthquake in the study area. Although there are some historical earthquakes in this region or nearby areas, the statistical information about the consequences does not exist or is very general and not reliable. For example, the most recent damaging earthquake in Tehran goes back to 1830, when there were not any recorded census data before and after the calamity. Therefore, a real investigation of this method is postponed to future.
Because the nighttime scenario of this hypothetical earth-quake completely matches the case study in the Hashemi and Alesheikh (2011b) project, it may be used to evaluate the accuracy of the results. They estimated the following: “32 % of buildings experienced 12–33 % damage, 5 % ex-perienced 64–72 % damage and the remainder exex-perienced more than 91 % damage. Approximately 8655 people out of 26 498 were killed and 7279 suffered injuries.” Because the results of this case study are almost the same in both studies, we can claim that our tool performs its duty at an accept-able level of accuracy. However, this cannot substantiate the precision of the tool, because the results are considerably de-pendent on the accuracy of the inputs and the precision of the method.
An M l6.4 earthquake assigned to the North Tehran Fault is the second case study. The results show that this earth-quake could destroy all the buildings, kill 13 985 and injure 11 286 people for the nighttime scenario and 3566 and 2877 people for the daytime scenario. Casualties for either day and nighttime scenarios are depicted in Fig. 8.
The third case study belongs to an earthquake with a mag-nitude of 6.4 generated by the Eyvanekey Fault. According to EDA tool estimations, all buildings are completely ruined, 13 985 and 11 286 people for the nighttime scenario and 3460 and 2792 people for the daytime scenario are killed and in-jured, respectively. For the nighttime scenario, the estimated numbers of casualties are the same as the North Tehran Fault earthquake scenario (previous case study), because the casu-alties are estimated based on the structural damages, which are the same for both scenarios; the MMI does not have a di-rect role in nighttime scenarios. However, there is a small dif-ference in daytime casualties between current and previous case studies. Although the structural damages are the same, the MMIs are different and the daytime casualties depend on the MMI (refer to Fig. 4 and Eq. 4). If someone wants to compare the intensities of these two earthquake scenarios, he/she must refer to their MMI fields. The MMIs generated by the North Tehran Fault earthquake are 0.04 larger than those produced by the Eyvanekey Fault earthquake on aver-age, because the North Tehran Fault is closer to the study area.
The comparison of the consequences of these scenarios and the investigation of severity of them are very important,
but delayed for another work. In addition, the application of EDA tool for entire metropolis of Tehran may be very infor-mative for earthquake disaster mitigation purposes and effec-tive in developing a city-wide disaster management plan, but it requires the detailed building and census data.
5 Conclusions
The structural and human consequences of a specific earth-quake scenario in the highly populated metropolis of Tehran used to be estimated by a very time-consuming process in the ArcMapTM and MATLABTM environments involving sev-eral experts. This process constrained users to transfer a large amount of data between these two software environments and entangled users in complicated computations. With the pre-sentation of earthquake damage assessment (EDA) tool that can be installed on ArcMapTM, the above process is fulfilled in less than an hour by any amateur ArcGIS user.
There are three basic commands in EDA toolbar, each of which has a convenient user interface interacting with the user during the execution of the requested scenario. The results are displayed in the user-friendly interface of the ArcMapTM application automatically. In the first step, the distance between the building and the selected fault is cal-culated and stored in a new field added to the attribute data table of the building data set. In the second step, the earth-quake intensity at each building location is estimated by us-ing the MMI attenuation relationship. Next, the damage to each building is calculated based on the obtained MMI and the customized fragility curves. In the third step, the number of fatalities due to the building collapses is calculated using customized functions for the city of Tehran. Finally, the re-sults are presented to the user both graphically and in tabular format.
Although the equations used in this study are extracted from other projects, they are illustrated, expanded for other faults and sites, converted to programmable algorithms, and coded in ArcObjectsTM. In addition, EDA tool is applied for a small region in Tehran, Iran, and the structural and human losses of six earthquake scenarios are investigated. The com-parison of one of the case studies with the results of other research proved the accuracy of EDA tool, but it cannot in-dicate the precision of the method in predicting the impacts of a real earthquake. Besides, the precision of the inputs, ge-ological factors and variations, and fault traits, which are not considered in the current method, may affect the results of EDA tool.
The methodology may be refined in certain ways. First of all, the building damages are calculated based on the MMI as an intensity scale, but it requires being replaced by a factor that is better linked with different building types and heights, such as peak ground acceleration (PGA) or spectral acceler-ation (SA). In addition, different steps of damage estimacceler-ation are accompanied by uncertainties, which must be modeled
in future versions. On the other hand, the estimated number of fatalities by this tool will constitute most but not all of the expected casualties, because, in addition to the structural failure caused by the strong ground motions, there are many other direct and indirect causes of damage consisting of ma-jor tsunamis, landslides, liquefactions, and wide-spread fires, which are neglected in the presented methodology. Improve-ment of the damage assessImprove-ment method by considering the above issues and exerting the changes on EDA tool may be some topics of the subsequent research.
Acknowledgements. We would like to express our gratitude to the
Editor, B. D. Malamud, and the venerable reviewers of this article, C. Emrich and one anonymous referee, who shared their knowledge and experiences with us to improve the paper.
Edited by: B. D. Malamud
Reviewed by: C. Emrich and one anonymous referee
References
Algermissen, S. T., Rinehart, W. A., Dewey, J., Steinbrugge, K. V., Degenkolb, H. J., Cluff, L. S., McClure, F. E., and Gordon, R. F.: A study of earthquake losses in the San Francisco bay area: data and analysis, Rockville, MD: Environmental Research Lab-oratories of National Oceanic and Atmospheric Administration, prepared for the Office of Emergency Preparedness, US Depart-ment of Commerce, 1972.
Ali Akbar, T., Lin, H., and DeGroote, J.: Development and evalu-ation of GIS-based ArcPRZM-3 system for spatial modeling of groundwater vulnerability to pesticide contamination, Comput-ers and Geosciences, 37, 822–830, 2011.
Ansal, A., Akinci, A., Cultrera, G., Erdik, M., Pessina, V., Tonuk, G., and Ameri, G.: Loss estimation in Istanbul based on de-terministic earthquake scenarios of the Marmara Sea region (Turkey), Soil Dyn. Earthq. Eng., 29, 699–709, 2009.
AS/NZS 1170.4: Draft Australian/New Zealand Standard for Struc-tural Design Actions, Part 4: Earthquake Actions in Australia, (Document No. D5212-5.1 issued in June 2005), Standards Aus-tralia and Standards New Zealand, 2005.
Ashtari Jafari, M.: Statistical prediction of the next great earthquake around Tehran, Iran, J. Geodyn., 49, 14–18, 2010.
Ashtari, M., Hatzfeld, D., and Kamalian, N.: Microseismicity in the region of Tehran, Tectonophysics, 395, 193– 208, 2005. Aslani, H.: Probabilistic earthquake loss estimation and loss
disag-gregation in buildings, Ph.D. dissertation, University of Stanford, Department of Civil and Environmental Engineering, 2005. Bird, J. F. and Bommer, J. J.: Earthquake losses due to ground
fail-ure, Eng. Geol., 75, 147–179, 2004.
Borcherdt, R. D.: Spatial ground motion amplification analysis, Pro-ceedings of Geo-Logan′97, 56–69, 1997.
Chang, K. T.: Programming ArcObjects with VBA (2nd Edn.), Boca Raton: CRC Press, 2007.
Coburn, A. and Spence, R.: Earthquake protection (2nd Edn.), West Sussex, England, Wiley, 2002.
Crespellani, T., Vannuchi, G., and Zeng, X.: Seismic hazard anal-ysis, Seismic hazard and site effects in the Florence Area, Xth
European Conference on Soil Mechanics and Foundation Engi-neering, 11–31, 1991.
Daniell, J. E., Khazai, B., Wenzel, F., and Vervaeck, A.: The CAT-DAT damaging earthquakes database, Nat. Hazards Earth Syst. Sci., 11, 2235–2251, doi:10.5194/nhess-11-2235-2011, 2011. Doloei, J. and Roberts, R.: Crust and uppermost mantle structure of
Tehran region from analysis of teleseismic P-wave form receiver functions, Tectonophysics, 364, 115–133, 2003.
Drabek, T. E. and Hoetmer, G. J.: Emergency management: Princi-ples and practice for local government, Washington, DC: Inter-national City Management Association, 1991.
Ergonul, S.: A probabilistic approach for earthquake loss estima-tion, Structural Safety , 27, 309–321, 2005.
Feyza Cinicioglu, S., Bozbey, I., Oztoprak, S., and Kubilay Kele-soglu, M.: An integrated earthquake damage assessment method-ology and its application for two districts in Istanbul, Turkey, Eng. Geol., 94, 145–165, 2007.
Hamzehloo, H., Vaccari, F., and Panza, G. F.: Towards a reliable seismic microzonation in Tehran, Iran, Eng. Geol., 93, 1–16, 2007.
Handmer, J. and Dovers, S.: Handbook of disaster and emergency policies and institutions, Earthscan Publications, 2007.
Hashemi, M. and Alesheikh, A. A.: Spatio-temporal analysis of Tehran’s historical earthquakes trends, in: Proceedings of the 14th AGILE Conference on Advancing Geoinformation Science for a Changing World, edited by: Geertman, S., Reinhardt, W., and Toppen, F., Springer, Utrecht, The Netherlands, 3–20, 2011a. Hashemi, M. and Alesheikh, A. A.: A GIS-based earthquake dam-age assessment and settlement methodology, Soil Dyn. Earthq. Eng., 31, 1607–1617, 2011b.
Japan International Cooperation Agency (JICA) and Center for Earthquake and Environmental Studies of Tehran (CEST) and Tehran Municipality: The study on seismic microzoning of the Greater Tehran area in the Islamic Republic of Iran, Final report, 2000.
Karimi, I. and H¨ullermeier, E.: Risk assessment system of natural hazards: A new approach based on fuzzy probability, Fuzzy Set Syst., 158, 987–999, 2007.
Karssenberg, D.: The value of environmental modeling languages for building distributed hydrological models, Hydrol. Process., 16, 2751–2766, 2002.
Karssenberg, D. and De Jong, K.: Dynamic environmental model-ing in GIS: 1, Modelmodel-ing in three spatial dimensions, Int. J. Geogr. Inf. Sci., 19, 559–579, 2005.
Lan, H., Martin, C. D., and Lim, C.: RockFall analyst: A GIS ex-tension for three-dimensional and spatially distributed rockfall hazard modeling, Comput. Geosci., 33, 262–279, 2007. Martini, P. M., Hessami, K., Pantosti, D., D’Addezio, G., Alinaghi,
H., and Ghafory-Ashtiani, M.: A geologic contribution to the evaluation of the seismic potential of the Kahrizak fault (Tehran, Iran), Tectonophysics, 287, 187–199, 1998.
Menoni, S. and Pergalani, F.: An attempt to link risk assessment with landuse planning: A recent experience in Italy, Disaster Pre-vention and Management, 5, 6–21, 1996.
Michalowski, W., Kersten, G., Koperczak, Z., and Szpakowicz, S.: Disaster management with NEGOPLAN, Expert Sys. Appl., 2, 107–120, 1991.
Montoya, L. and Masser, I.: Management of natural hazard risk in Cartago,Costa Rica, Habitat Int., 29, 493–509, 2005.
Morio, M., Finkel, M., and Martac, E.: Flow guided interpolation - A GIS-based method to represent contaminant concentration distributions in groundwater, Environ. Modell. Softw., 25, 1769– 1780, 2010.
Mowen, X., Esaki, T., Cheng, Q., and Lin, J.: Spatial three-dimensional landslide susceptibility mapping tool and its appli-cations, Earth Sci. Front., 14, 73–84, 2007.
National Institute of Building Science: Earthquake loss estima-tion methodology, HAZUS97: Technical manual, Washington DC: Report prepared for the Federal Emergency Management Agency, 1997.
Ramirez, C. M.: Building-specific loss estimation methods and tools for simplified performance-based earthquake engineering, Ph.D. dissertation, University of Stanford, Department of Civil and Environmental Engineering, 2009.
Rashed, T. M.: Measuring the environmental context of social vul-nerability to urban earthquake hazards: An integrative remote sensing and GIS approach, Ph.D. dissertation, University of Cal-ifornia, Santa Barbara, Department of Geography, 2003. Sadidkhouy, A., Javan-Doloei, G., and Siahkoohi, H. R.: Seismic
anisotropy in the crust and upper mantle of the Central Alborz Region, Iran, Tectonophysics, 456, 194–205, 2008.
Schneider, P. J. and Schauer, B. A.: HAZUS – Its development and its future, Nat. Hazard Rev., 7, 40–44, 2006.
Shabestari, K. T., Yamazaki, F., Saita, J., and Matsuoka, M.: Estima-tion of the spatial distribuEstima-tion of ground moEstima-tion parameters for two recent earthquakes in Japan, Tectonophysics, 390, 193–204, 2004.
Shafiee, A. and Azadi, A.: Shear-wave velocity characteristics of geological units th roughout Tehran City, Iran, J. Asian Earth Sci., 29, 105–115, 2007.
Stevens, D., Dragicevic, S., and Rothley, K.: iCity: A GIS-CA mod-elling tool for urban planning and decision making, Environ. Modell. Softw., 22, 761–773, 2007.
Tinguaro Rodriguez, J., Vitoriano, B., and Montero, J.: A general methodology for data-based rule building and its application to natural disaster management, Comput. Oper. Res., 39, 863–873, 2009.
University of Durham: Programming in ArcGIS using ArcObjects and AML, Durham, England, University of Durham Information Technology Service, 2007.
Vahidnia, M. H., Alesheikh, A. A., Alimohammadi, A., and Hos-seinali, F.: A GIS-based neuro-fuzzy procedure for integrating knowledge and data in landslide susceptibility mapping, Com-put. Geosci. , 36, 1101–1114, 2010.
Westen, C. V.: Geoinformation science and earth observation for municipal risk management; The SLARIM project. International Instititute for Geoinformation Science and Earth Observation, ITC, 2004.
Yaghmaei-Sabegh, S. and Lam, N. T.: Ground motion modelling in Tehran based on the stochastic method, Soil Dyn. Earthq. Eng., 30, 525–535, 2010.
Zafarani, H., Noorzad, A., Ansari, A., and Bargi, K.: Stochastic modeling of Iranian earthquakes and estimation of ground mo-tion for future earthquakes in Greater Tehran, Soil Dyn. Earthq. Eng., 29, 722–741, 2009.
Zeller, M.: Exploring ArcObjects, Redlands, California, Esri, 2001. Zeng, H., Talkkari, A., Peltola, H., and Kellomaki, S.: A GIS-based decision support system for risk assessment of wind damage in forest management, Environ. Modell. Softw., 22, 1240–1249, 2007.