www.atmos-chem-phys.net/13/7321/2013/ doi:10.5194/acp-13-7321-2013
© Author(s) 2013. CC Attribution 3.0 License.
Atmospheric
Chemistry
and Physics
Geoscientiic
Geoscientiic
Geoscientiic
Geoscientiic
Ozone photochemistry in boreal biomass burning plumes
M. Parrington1, P. I. Palmer1, A. C. Lewis2, J. D. Lee2, A. R. Rickard3,4, P. Di Carlo5,6, J. W. Taylor7, J. R. Hopkins2, S. Punjabi8, D. E. Oram9, G. Forster9, E. Aruffo5,6, S. J. Moller2, S. J.-B. Bauguitte10, J. D. Allan7,11, H. Coe7, and R. J. Leigh12
1School of GeoSciences, The University of Edinburgh, Edinburgh, UK
2National Centre for Atmospheric Science, Department of Chemistry, University of York, York, UK 3National Centre for Atmospheric Science, School of Chemistry, University of Leeds, Leeds, UK
4now at the National Centre for Atmospheric Science, Department of Chemistry, University of York, York, UK 5Center of Excellence CETEMPS, University of L’Aquila, L’Aquila, Italy
6Department of Physical and Chemical Sciences, University of L’Aquila, L’Aquila, Italy
7School of Earth, Atmospheric and Environmental Sciences, University of Manchester, Manchester, UK 8Department of Chemistry, University of York, York, UK
9National Centre for Atmospheric Science, School of Environmental Sciences, University of East Anglia, Norwich, UK 10Facility for Airborne Atmospheric Measurements, Bedford, UK
11National Centre for Atmospheric Science, University of Manchester, Manchester, UK 12Department of Physics and Astronomy, University of Leicester, Leicester, UK
Correspondence to:M. Parrington (mark.parrington@ed.ac.uk)
Received: 26 December 2012 – Published in Atmos. Chem. Phys. Discuss.: 17 January 2013 Revised: 24 June 2013 – Accepted: 25 June 2013 – Published: 1 August 2013
Abstract.We present an analysis of ozone (O3)
photochem-istry observed by aircraft measurements of boreal biomass burning plumes over eastern Canada in the summer of 2011. Measurements of O3and a number of key chemical species
associated with O3 photochemistry, including non-methane
hydrocarbons (NMHCs), nitrogen oxides (NOx) and total
ni-trogen containing species (NOy), were made from the UK
FAAM BAe-146 research aircraft as part of the “quantifying the impact of BOReal forest fires on Tropospheric oxidants over the Atlantic using Aircraft and Satellites” (BORTAS) experiment between 12 July and 3 August 2011. The loca-tion and timing of the aircraft measurements put BORTAS into a unique position to sample biomass burning plumes from the same source region in Northwestern Ontario with a range of ages. We found that O3 mixing ratios measured
in biomass burning plumes were indistinguishable from non-plume measurements, but evaluating them in relationship to measurements of carbon monoxide (CO), total alkyl nitrates (6AN) and the surrogate species NOz (=NOy−NOx)
re-vealed that the potential for O3 production increased with
plume age. We used NMHC ratios to estimate
photochemi-cal ages of the observed biomass burning plumes between 0 and 10 days. The BORTAS measurements provided a wide dynamic range of O3 production in the sampled biomass
burning plumes with1O3/1CO enhancement ratios
increas-ing from 0.020±0.008 ppbv ppbv−1in plumes with photo-chemical ages less than 2 days to 0.55±0.29 ppbv ppbv−1 in plumes with photochemical ages greater than 5 days. We found that the main contributing factor to the variability in the 1O3/1CO enhancement ratio was 1CO in plumes
with photochemical ages less than 4 days, and that was a transition to 1O3 becoming the main contributing
fac-tor in plumes with ages greater than 4 days. In compar-ing O3 mixing ratios with components of the NOy
bud-get, we observed that plumes with ages between 2 and 4 days were characterised by high aerosol loading, relative humidity greater than 40 %, and low ozone production effi-ciency (OPE) of 7.7±3.5 ppbv ppbv−1relative to6AN and
1.6±0.9 ppbv ppbv−1relative to NOz. In plumes with ages
greater than 4 days, OPE increased to 472±28 ppbv ppbv−1 relative to6AN and 155±5 ppbv ppbv−1 relative to NOz.
plumes with low aerosol loading were close to being in photostationary steady state and O3 production in younger
plumes was inhibited by high aerosol loading and greater production of 6AN relative to O3. The BORTAS
mea-surements of O3 photochemistry in boreal biomass burning
plumes were found to be consistent with previous summer-time aircraft measurements made over the same region dur-ing the Arctic Research of the Composition of the Tropo-sphere (ARCTAS-B) in 2008 and Atmospheric Boundary Layer Experiment (ABLE 3B) in 1990.
1 Introduction
The quantifying the impact of BOReal forest fires on Tropo-spheric oxidants over the Atlantic using Aircraft and Satel-lites (BORTAS) experiment was conducted in two phases: July–August 2010 (phase A) and 2011 (phase B) (Palmer et al., 2013). The overarching objective of BORTAS was to better understand the chemical evolution of plumes emit-ted from wildfires in boreal regions, with a particular em-phasis on the net production of tropospheric O3and
down-wind impacts on air quality. The first phase of the experiment (BORTAS-A) comprised of ground-based, ozonesonde, and satellite measurements over eastern Canada in the summer of 2010, the results from which were reported by Parrington et al. (2012). The second phase of the experiment (BORTAS-B) was an aircraft measurement campaign based out of Hal-ifax, Nova Scotia, Canada, between 12 July and 3 August 2011, supported by ground-based, ozonesonde, and satellite measurements. An overview of the BORTAS-B campaign is given by Palmer et al. (2013). In this paper we analyse O3
photochemistry in the biomass burning plumes sampled by the aircraft during BORTAS-B.
Tropospheric O3 is a secondary pollutant formed by the
photo-oxidation of carbon monoxide (CO) and volatile or-ganic compounds (VOCs) in the presence of nitrogen oxides (NOx) and transport from the stratosphere. Removal of O3
from the troposphere is through dry deposition and photo-chemical destruction. Tropospheric O3 plays an important
role in the contexts of climate and air quality. Emissions of O3 precursors (i.e. NOx and VOCs) can be anthropogenic
in origin and can also have natural sources such as bio-genic processes and biomass burning. A number of previous measurement campaigns have made in situ observations of photochemistry within boreal biomass burning outflow and evaluated the associated O3production and loss. The NASA
Atmospheric Boundary Layer Experiment (ABLE) included two high-latitude aircraft measurement campaigns in the summers of 1988 (ABLE 3A) and 1990 (ABLE 3B) (Har-riss et al., 1992, 1994). Analysis of the ABLE 3A measure-ments, made over northern and western Alaska, found O3
production in haze layers associated with fires to be ineffi-cient with less than 0.1 molecules of O3formed per molecule
of CO (Wofsy et al., 1992). However, the ABLE 3B mea-surements, made over central and eastern Canada, observed O3enhancements of 5–15 ppbv in aged (>2 days) biomass
burning plumes (Anderson et al., 1994). Aircraft measure-ments made over the North Atlantic Ocean during the Inter-continental Transport of Ozone and Precursors (ITOP) cam-paign (Lewis et al., 2007), which was part of the wider In-ternational Consortium for Atmospheric Research on Trans-port and Transformation (ICARTT) (Fehsenfeld et al., 2006) in the summer of 2004, sampled biomass burning plumes associated with fires in Alaska. Examples of elevated O3
were observed in individual plumes with elevated CO during ITOP but there was no single canonical relationship (Lewis et al., 2007). More recently the NASA Arctic Research of the Composition of the Troposphere from Aircraft and Satellites (ARCTAS) campaign in the spring and summer of 2008 made measurements of biomass burning plumes in central Canada. Analysis of the ARCTAS aircraft measure-ments showed little evidence for O3 formation within the
plumes (Alvarado et al., 2010) other than when the plumes were mixed with outflow from urban pollution (Singh et al., 2010). Ground-based measurements of outflow from boreal biomass burning have also been routinely made at the Pico Mountain Observatory in the mid-Atlantic (Lapina et al., 2006; Val Martin et al., 2006; Helmig et al., 2008). Years with high boreal fire activity have been shown to increase O3mixing ratios in the free troposphere over this site by up
to 10 ppbv (Lapina et al., 2006) with photochemically aged biomass burning plumes influencing tropospheric oxidant chemistry after 1–2 weeks of transport to the region (Helmig et al., 2008).
Model analyses of photochemistry in boreal biomass burn-ing plumes have also been performed to evaluate O3
produc-tion and loss. Mauzerall et al. (1996) performed 1-D model simulations to calculate in situ production and loss of O3
based on the ABLE 3B measurements in the summer of 1990. They found biomass burning emissions to be a rel-atively negligible, contributing less than 2 % to the calcu-lated O3budget. McKeen et al. (2001) used a 3-D chemistry
transport model (CTM) to evaluate the influence of Canadian biomass burning emissions on O3 production over
north-eastern USA using measurements made from the National Oceanographic and Atmospheric Administration (NOAA) WP-3 aircraft in the summer of 1995. O3enhancements of
between 10 and 30 ppbv throughout the central and eastern US were attributed to the fires, with the model simulations being sensitive to NOx/CO and VOC/CO emission ratios.
The influence of emissions from forest fires in Alaska and Canada on tropospheric O3production during summer 2004
was the subject of model studies by Pfister et al. (2006); Real et al. (2007); Cook et al. (2007). Pfister et al. (2006) utilised the MOZART-4 CTM to evaluate O3production in the
enhancements relative to CO of 0.25 ppbv ppbv−1,
contribut-ing approximately 3 % of the Northern Hemispheric tropo-spheric O3budget. Lagrangian model studies of the outflow
over the North Atlantic Ocean (Real et al., 2007) reported that although an O3 enhancement of 17 ppbv was observed
after 5 days, net O3 loss could occur in the plumes due to
biomass burning aerosols in the plume reducing the photoly-sis rates of O3and NO2.
An overview of observed and model estimates of O3
pro-duction in boreal biomass burning plumes was recently pre-sented by Jaffe and Wigder (2012). A common feature of observation and model studies of O3production in biomass
burning outflow is the use of O3 enhancement ratios
rela-tive to CO (1O3/1CO) to determine O3 production. Jaffe
and Wigder (2012) broadly showed that the1O3/1CO
ra-tio increases with plume age. In this paper we diagnose O3
production in biomass burning plumes using in situ aircraft measurements made over eastern Canada in the summer of 2011. We evaluate a number of different metrics, including 1O3/1CO and O3production efficiency relative to the NOy
budget. An overview of the aircraft measurements and chem-ical processes influencing O3 photochemistry are presented
in Sect. 2. Section 3 presents the O3distribution over
east-ern Canada observed by the aircraft over the campaign pe-riod. Section 4 presents an analysis of observed plume pho-tochemistry using photochemical age calculations derived from NMHC ratios, O3 production efficiencies relative to
NOy partitioning, and photostationary steady state
calcula-tions. We conclude in Sect. 5.
2 Airborne photochemical measurements during BORTAS-B
In this section we present a brief overview of tropospheric O3
photochemistry and the relevant measurements made from the BAe-146 aircraft during the BORTAS-B aircraft mea-surement campaign, which are used in our analysis.
2.1 Plume photochemistry
The simplest model of O3photochemistry in the atmosphere
can be represented by the rapid oxidation of nitrogen oxides, NOx, which represents the sum of nitric oxide (NO) and
ni-trogen dioxide (NO2), in the presence of sunlight through the
following null cycle:
NO+O3→NO2+O2 (R1)
NO2+hν→NO+O (R2)
O+O2 M
→O3. (R3)
In polluted air masses such as biomass burning plumes, per-turbations of this cycle through additional reactions of NO with peroxy radicals (RO2 or HO2) produced by the
oxi-dation of VOCs provide additional pathways for converting NOx into O3. Figure 1 shows a schematic of the simplified
RO2
ROOH+O2
Wet/dry deposition
ROONO2
R !"# $!"#
%!"#
VOC+
{OH,NO3,O3} RONO2
RO + NO2 (...O3) alcohol, carbonyl
RO2
NO
Fig. 1.Schematic of the atmospheric O3-NOx-hydrocarbon
chem-istry cycle studied by BORTAS.
O3-NOx-VOC chemistry in the atmosphere. The chain of
reactions leading to O3formation is initiated by the
photo-oxidation of a VOC (RH) and its rapid subsequent reac-tion with molecular oxygen to produce alkyl peroxy radicals (RO2), for example
RH+OH→O2 RO2+H2O. (R4)
Under tropospheric conditions, as indicated by the blue ar-rows in Fig. 1, alkyl peroxy radicals can react with NO2via
a three body reaction to form peroxynitrates (RO2NO2):
RO2+NO2 M
→RO2NO2, (R5)
which will decompose back into the constituent RO2 and
NO2under the right environmental conditions (i.e. near
sur-face temperatures) but can also be subject to transport away from the source region as they are thermally stable at lower temperatures, such as those in the free troposphere.
Peroxy radicals are also subject to reaction with NO and can follow two different pathways:
RO2+NO→RO+NO2 (R6)
RO2+NO M
→RONO2 (R7)
Reaction (R6) results in the formation of O3 molecules via
photolysis of NO2. Comparison of reactions (R6) and (R7)
indicates that O3production in biomass burning plumes
ini-tiated by photo-oxidation of VOCs is in competition with production of alkyl nitrates (RONO2); evaluating the
rela-tionship between the measured O3 and RONO2 mixing
ra-tios provides an indication of the potential for O3production
related to the above mechanism (e.g. Perring et al., 2010). The potential of the above reactions to produce O3
in biomass burning plumes is dependent on the avail-ability of nitrogen oxides, NOx (= NO + NO2). A
sur-rogate species, NOy, is used to represent the sum
of all reactive and oxidised nitrogen species in an air mass: NOy= NOx+6RO2NO2+6RONO2+ HNO3+
HONO + NO3+ 2N2O5+ NO3−), where 6RO2NO2
repre-sents the total peroxynitrates (6PN) and6RONO2
A second surrogate species, NOz(= NOy−NOx), can be
de-fined that represents the sum of the photo-oxidation products of NOx(Olszyna et al., 1994). Since NOyis representative
of all NOxemissions, NOzprovides a measure of the
num-ber of NOxmolecules that have undergone photo-oxidation.
Several studies have shown that the O3 abundance in
pol-luted air masses is linearly related to the abundance of NOz
(e.g., Trainer et al., 1993; Kleinman, 2000). The enhance-ment of O3abundance relative to NOz(i.e.1O3/1NOz)
pro-vides a measure of O3production related to photo-oxidation
of NOx molecules, sometimes referred to as the ozone
pro-duction efficiency (OPE) (Ryerson et al., 1998; Rickard et al., 2002).
2.2 BORTAS measurements
Measurements of the key tracers relevant to the O3
photo-chemistry outlined above were made from the BAe-146 air-craft over the course of the BORTAS-B measurement cam-paign. Full details of the BAe-146 payload are presented in Table 2 of Palmer et al. (2013) and we provide here brief details of the measurements used in this study.
Measurements of O3were made using a TECO 49
ultra-violet absorption instrument (Wilson and Birks, 2006) op-erated by the UK Facility for Airborne Atmospheric Mea-surements (FAAM) with an average time of 3 Hz, at a pre-cision of 1 ppbv and accuracy of±5 %. Measurements used for identification of biomass burning plume air masses in-cluded acetonitrile (CH3CN) and CO. A proton transfer
re-action mass spectrometer (PTR-MS) (Murphy et al., 2010) provided measurements of CH3CN with an average time of
1 s and mean precision of 37 pptv over all BORTAS flights. CO was measured using a vacuum-UV resonance fluores-cence instrument (Gerbig et al., 1999) with an average time of 1 s, precision of 1 ppbv, and accuracy of 3 %. We de-termined the aerosol loading within the sampled plume air with measurements of refractory black carbon using a sin-gle particle soot photometer (SP2) and measurements of total scattering coefficient at 550 nm using a TSI Inc. 3563 three-wavelength nephelometer (Anderson and Ogren, 1998). The SP2 uses laser-induced incandescence to measure refractory black carbon on a single particle basis (Schwarz et al., 2006); the inlet and instrumental setup on the BAe-146 are de-scribed by McMeeking et al. (2010). The statistical uncer-tainty in BC mass concentration was 5 % for an average time of 15 s, and accuracy was within 20 % due to possible dif-ferences between the instrumental response to biomass burn-ing BC and the calibrant (Laborde et al., 2012). Measure-ment of NO2 photolysis rates were made using upper and
lower fixed bandwidth radiometers at wavelengths predomi-nantly between 208 and 500 nm, at a frequency of 1 Hz and with accuracy of 10 % (Volz-Thomas et al., 1996). Measure-ments of VOCs used in this study were made using a dual channel gas chromatograph system with flame ionisation de-tection (GC-FID) (Hopkins et al., 2003, 2011) to analyse
whole air canister samples taken during each flight. Each canister sample was taken over a 30 s period at points of particular interest along the flight track. The precision and accuracy of the GC-FID measurements are species depen-dent but typical values are 1–5 pptv and 5 %, respectively. Measurements of NO and NO2 were made using a single
channel chemiluminesence instrument manufactured by Air Quality Design (AQD) Inc., USA, as described by Lee et al. (2009). The accuracy of the AQD NO and NO2
measure-ments was 10 pptv. Measuremeasure-ments of NO2, total NOy,
to-tal peroxyacetyl nitrates (6PN=6RO2NO2), and total alkyl
nitrates (6AN=6RONO2) were made using a Thermal
Dissociation-Laser Induced Fluorescence (TD-LIF) instru-ment (Dari-Salisburgo et al., 2009; Di Carlo et al., 2013) with accuracies of 10 %, 22 %, 34 %, and 46 %, respectively.
For the analysis presented here we calculated mixing ratios of NOx, and subsequently NOz, from the aircraft
measure-ments of NO, NO2and NOydescribed above. The NOx
mix-ing ratio was calculated usmix-ing NO measured by the AQD in-strument and NO2measured by the TD-LIF instrument. The
AQD instrument measures NO2indirectly, after it has
under-gone photo dissociation to form NO in the presence of UV radiation (Lee et al., 2009), whereas the TD-LIF instrument measures NO2directly; we use the TD-LIF in the NOx
calcu-lation to reduce uncertainties and possible interferences. NOz
was then calculated by subtracting the AQD/LIF NOxvalues
from the LIF total NOymeasurements. We calculated
aver-age uncertainties of 13±6 % in the range 6–45 % for NOx
and 51±4 % in the range 47–84 % for NOz. For both NOx
and NOz, calculated uncertainties more than 2σstandard
de-viations above the average occurred for approximately 5 % of the plume measurements with the lowest calculated NOx
and NOzmixing ratios.
To distinguish measurements made in biomass burning plumes from those made in clean air, we use the threshold of 150 pptv of CH3CN determined by Palmer et al. (2013)
from the 99 percentile of measurements made on flight B625. CH3CN is predominantly emitted from biomass burning and
removed from the atmosphere through uptake by the oceans and reaction with OH, with an atmospheric lifetime of ap-proximately 25 days (Bange and Williams, 2000); therefore, CH3CN is an excellent tracer for identifying plume
measure-ments.
3 Observed O3distribution over eastern Canada
In this section we present an overview of the O3distribution
observed from the BAe-146 aircraft during the BORTAS-B measurement campaign. Figure 2 shows the relative fre-quency distribution of O3mixing ratios, divided into 1 ppbv
bins, measured from the BAe-146 during the eleven research flights undertaken 15–31 July 2011 (Table 1). The frequency distribution of the O3measurements made both in and out of
0 20 40 60 80 100 120 O3 / ppbv
0.00 0.01 0.02 0.03 0.04 0.05 0.06
Relative Frequency
All data, n = 3536
CH3CN > 150 pptv, n = 1163
CH3CN < 150 pptv, n = 1557
Fig. 2.Frequency distribution of O3mixing ratios measured from
the BAe-146 on all research flights during the BORTAS campaign period (15 to 31 July 2011). Frequencies are calculated for 1 ppbv
bins. The black line shows the distribution of all the measured O3
mixing ratios, the red line shows the distribution of measurements
identified as biomass burning plumes using a threshold of CH3CN
mixing ratios greater than 150 pptv, and the blue line shows
mea-surements made in air masses with CH3CN mixing ratios less than
150 pptv. The number of data points,n, for each distribution are
shown in the legend.
25 and 50 ppbv. The peak in O3 mixing ratio at 25 ppbv is
attributable to measurements made at altitudes below 3 km. The O3measurements made during BORTAS-B show a
sim-ilar distribution to that observed over central and eastern Canada during the ABLE 3B measurement campaign in the summer of 1990 (Anderson et al., 1994).
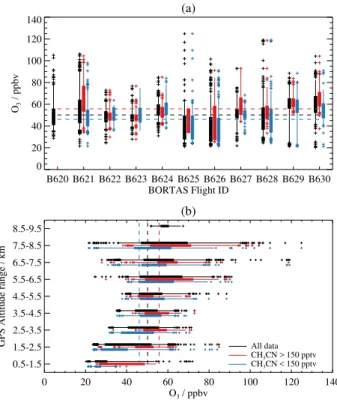
The statistical distribution of O3mixing ratios measured
on each of the BORTAS campaign flights (Table 1) is shown in Fig. 3a. Each flight shows a wide range of measured O3
mixing ratios between 20 and 125 ppbv, reflecting the vari-ability in O3over the geographical area and altitude ranges
covered by the aircraft over the course of the campaign. The mean O3 mixing ratio measured over the whole campaign
was 50 ppbv, which was reduced to 46 ppbv for measure-ments made in non-plume (CH3CN<150 pptv) air masses
and increased to 57 ppbv for plume air measurements. In gen-eral, O3mixing ratios were less than the campaign mean of
the plume measurements. Figure 3b shows the statistical dis-tribution of the measured O3mixing ratios as a function of
the aircraft GPS altitude, divided into 1 km wide bins. Us-ing the medians for each altitude bin, the O3 mixing ratio
increased from less than 40 ppbv between 0.5 and 1.5 km to approximately 60 ppbv between 7.5 and 8.5 km. Plume mea-surements were higher on average than non-plume measure-ments, apart from the altitude range between 4.5 and 5.5 km, and measurements were typically less than the campaign mean of the plume data below 5.5 km. Three research flights (B621, B629 and B630) measured O3mixing ratios that were
(a)
0 20 40 60 80 100 120 140
O3
/ ppbv
B620 B621 B622 B623 B624 B625 B626 B627 B628 B629 B630 BORTAS Flight ID
(b)
0 20 40 60 80 100 120 140
O3 / ppbv
0.5-1.5 1.5-2.5 2.5-3.5 3.5-4.5 4.5-5.5 5.5-6.5 6.5-7.5 7.5-8.5 8.5-9.5
GPS Altitude range / km All data
CH3CN > 150 pptv
CH3CN < 150 pptv
Fig. 3.Box and whisker plots showing the statistical distribution of
O3measurements made from the BAe-146 during BORTAS as a
function of(a)research flight (see Table 1 and Palmer et al., 2013),
and(b) aircraft GPS altitude. In both plots solid boxes show the
range of the 25th to 75th percentiles and whiskers show the range of the 5th to 95th percentiles with outliers shown as plus symbols. Black boxes and whiskers show all measured values, red boxes and whiskers show plume measurements determined from
mea-sured CH3CN mixing ratios in excess of 150 pptv, and blue boxes
and whiskers show non-plume measurements (i.e. CH3CN less than
150 pptv). Dashed lines in each panel indicate the campaign mean
O3mixing ratio for each group of data points.
on average greater than the campaign mean. These measure-ments were typically made at higher altitudes, above 5.5 km, as reflected in Fig. 3b. A number of outlying O3mixing ratios
were made below the 5th percentile and above the 95th per-centile of the observed statistics on each flight, reflecting the wide range of altitudes over which the measurements were made on each flight.
4 Observed boreal biomass burning outflow
In this section we evaluate the processes influencing the O3
distribution in biomass burning plume air sampled by the BAe-146 over the course of the BORTAS campaign. Figure 4 shows the relative distributions of 60 s averaged O3and CO
mixing ratios measured from the aircraft. Figure 2 shows that there is no discernible difference between O3measurements
Table 1.Flight IDs, dates, and location of research flights made by the BAe-146 during the BORTAS aircraft measurement campaign in 2011. The relative locations of each flight are shown in Palmer et al. (2013).
Flight ID Date (Day of Year) Location
B620 15 July (196) Eastern Quebec
B621 18 July (199) Newfoundland and Labrador
B622 20 July (201) Southern Quebec
B623 20 July (201) Quebec City to Halifax
B624 21 July (202) Atlantic Ocean to east of Island of Newfoundland
B625 24 July (202) Gulf of St. Lawrence
B626 26 July (207) Northwestern Ontario
B627 27 July (208) Thunder Bay ON to Goose Bay NL
B628 28 July (209) Labrador coast
B629 31 July (212) Gulf of St. Lawrence
B630 31 July (212) Nova Scotia and Island of Newfoundland
0 200 400 600 800 1000
CO / ppbv 0
20 40 60 80 100 120 140
O3
/ ppbv
CH3CN < 150 pptv, n = 2326
CH3CN > 150 pptv, n = 1146
Fig. 4.Scatter plot of 60 s averaged O3 versus CO mixing ratios
in ppbv measured from the BAe-146 during the BORTAS cam-paign period. Black symbols show all measured data and red sym-bols show the data points identified as biomass burning outflow. The
number of data points,n, are shown in the legend.
ratios in excess of 300 ppbv, O3 mixing ratios lie within a
range between approximately 40 and 60 ppbv. In the follow-ing subsections we examine O3production and
photochem-istry measured in boreal biomass burning plumes.
4.1 Photochemical ageing of biomass burning plumes
We first investigate photochemical processing within biomass burning plumes sampled by the aircraft through cal-culation of a photochemical age, i.e. the time taken for a par-ticular measured tracer to be removed chemically from an air mass after emission. We calculate photochemical ages based on ratios of non-methane hydrocarbons (NMHCs) (Parrish et al., 2007). The NMHCs used in this calculation are ethane (C2H6), propane (C3H8) andn-butane (C4H10)
mea-sured by GC-FID from whole air canister samples taken over the course of the BORTAS campaign. Figure 5 shows
-3 -2 -1 0 1
ln([C3H8]/[C2H6]) -6
-4 -2 0
ln([C
4
H10
]/[C
2
H6
])
CH3CN < 150 pptv CH3CN > 150 pptv Initial mixing ratios
Slope = 1.55 r2
= 0.89
Fig. 5. Scatter plot of the natural logarithms of the ratios of
[C4H10]:[C2H6] and [C3H8]:[C2H6] measured from whole air
can-ister samples taken by the BAe-146 during the BORTAS campaign period. All measured data are shown as black diamonds with red diamonds showing measurements made in boreal biomass burning plumes. The green square shows the ratios of the initial concentra-tions of the three alkanes used in the plot, estimated from BOR-TAS flight B626 over the burning source region in Northwestern Ontario. The solid red bounding lines represent the behaviour of the hydrocarbon ratios: the steeper slope assumes only oxidation of the alkanes with OH (kinetic slope); the shallower slope assumes only mixing of fresh emissions with background air (mixing slope). The dashed red line shows a linear fit to the plume measurements.
the relationship between natural logarithms of the observed [C4H10]:[C2H6] and [C3H8]:[C2H6] ratios, where [X]
the higher values of the natural logarithm of the NMHC ratios from flight B626 are representative of the ratios of the freshest emissions of these NMHCs, and are shown as the solid green square in Fig. 5. We also assume that this ratio is representative of the initial mixing ratios of these NMHCs emitted from forest fire emissions across bo-real North America, based on the similarity of vegetation cover over the region (Latifovic et al., 2004). The major-ity of NMHC ratios measured in biomass burning plumes during BORTAS lie to the left and below this point, indi-cating that the estimated initial concentrations are a suit-able reference point for calculating the relative photochem-ical ageing of the biomass burning plumes sampled dur-ing the campaign. Followdur-ing Parrish et al. (2007), we show bounding limits for oxidation by OH and dilution or mix-ing of fresh emissions into aged air masses as solid lines in Fig. 5. The steeper of these lines represents ageing of plume air if oxidation of the NMHCs was the only pro-cess influencing their concentration. This is sometimes re-ferred to as the “kinetic” line (Parrish et al., 2007; Helmig et al., 2008), and in our study its slope is calculated from the kinetic reaction rate coefficients of the measured NMHCs with OH. Assuming a typical free tropospheric temperature of 273 K and taking reaction rate coefficients from Atkin-son and Arey (2003), we calculate a kinetic slope of 2.61. The less steep of the solid lines in Fig. 5 can be considered a “dilution” line and represents dilution of a plume, start-ing with the same initial mixstart-ing ratios through mixstart-ing with background air that is sufficiently aged so that only the least reactive NMHC (i.e. C2H6) remains at significant
concen-trations. The mixing causes the ratio of the NMHC ratios to decrease with a slope of unity (Parrish et al., 2007). In general, NMHC ratios calculated from the BORTAS mea-surements lie between−3 and−1 for ln([C3H8]/[C2H6]) and
between−6 and−2.5 for ln([C4H10]/[C2H6]) and are
con-sistent with previous observations of NMHC ratios (Rudolph and Johnen, 1990; Parrish et al., 1992; Jobson et al., 1994; Parrish et al., 2007; Helmig et al., 2008). These data points lie within the bounds of the dilution and kinetic slopes, indicating that NMHC concentrations in the measured air masses were subject to a combination of oxidation and mix-ing between fresh emissions and background air. This is also consistent with the previous studies listed above and is not unexpected given that the BORTAS measurements were made between 1000–3000 km downwind of the emis-sion sources. The gradient of the line of best fit to the data is 1.55, further supporting the assumption that the observa-tions were subject to mixing and photochemical processing. Outliers in Fig. 5, i.e. where ln([C3H8]/[C2H6])>−1 and
ln([C4H10]/[C2H6])>−2, show measurements
representa-tive of different emission sources and are beyond the scope of the work presented here.
We estimate plume ages in days for the plume air masses sampled during the BORTAS campaign using the ln([C3H8]/[C2H6]) ratio and assuming a constant average
OH concentration of 2×10⁶molecules cm−3. As no OH
measurements were made from the BAe-146 during the campaign, this value was chosen to be representative of a northern mid-latitude summertime OH concentration (Spi-vakovsky et al., 2000). Varying the average OH concentra-tion in the photochemical age calculaconcentra-tions from half to dou-ble the assumed value would doudou-ble or halve the age, re-spectively. The photochemical ages we calculate from the BORTAS measurements using this assumed OH concentra-tion were similar to transport timescales from the emission source determined by back trajectory calculations (not pre-sented here), providing confidence in our assumption. Esti-mating the photochemical plume age in this way allows us to compare O3production in boreal biomass burning plumes
measured over the BORTAS campaign to similar measure-ments used in previous studies.
4.2 O3enhancements in biomass burning plumes
Figure 6 shows the relationships between O3and CO
sured in biomass burning plumes during the BORTAS mea-surement campaign to the calculated photochemical ages, sampled at the times of the whole air canister samples. O3
mixing ratios measured in boreal biomass burning plumes, Fig. 6a, show no clear relationship to the calculated pho-tochemical age over the whole BORTAS campaign period. The O3measurements made on flight B626 are distinguished
from those made on the other research flights by mixing ra-tios less than 30 ppbv. It should be noted that the measure-ments made in biomass burning plumes on flight B626 were made at lower altitudes (below 1.5 km) than on other flights. Measurements with higher CH3CN mixing ratios typically
show moderate O3 mixing ratios between 40 and 70 ppbv
with photochemical ages between 1.5 and 4.5 days. The mea-surements made with lower CH3CN exhibit a wider range
of O3 mixing ratios, from 40 to 110 ppbv, and
photochem-ical ages, from 0 to 10 days. The CO mixing ratios mea-sured in boreal biomass burning plumes, Fig. 6b, typically show higher values (between 200 and 1100 ppbv) at pho-tochemical ages of between 2 and 4 days and are coinci-dent with the higher values of CH3CN. These measurements
were made at aircraft altitudes below 3 km during flights B622–B624 on 20 and 21 July in plumes from the fires in Northwestern Ontario with approximate transport times of 2–3 days, calculated by Lagrangian backward trajectories (not shown). Measurements of CO mixing ratios less than 200 ppbv have a wider range of photochemical ages, between 0 and 10 days. On flight B626, CO mixing ratios were mea-sured between 150 and 400 ppbv with photochemical ages from 0 to 8.5 days.
The relationship between the measured O3and CO
(a)
0 2 4 6 8 10
Photochemical age / days 0
20 40 60 80 100 120
O3
/ ppbv
(b)
0 2 4 6 8 10
Photochemical age / days 0
200 400 600 800 1000 1200
CO / ppbv
[CH3CN] < 300 pptv
[CH3CN] > 300 pptv
Flight B626
(c)
0 200 400 600 800 1000 CO / ppbv
0 20 40 60 80 100 120
O3
/ ppbv
y = 1.249x - 100 y = 0.016x + 42 y = 0.009x + 25
(d)
0 2 4 6 8 10
Photochemical age / days 0.01
0.10 1.00
∆
O3
/
∆
CO / ppbv ppbv
-1
Fig. 6.Relationship between O3 and CO mixing ratios measured from the BAe-146 and sampled at the WAS measurement times, and
photochemical ages calculated from the ln(C3H8/C2H6) ratio in boreal biomass burning plumes throughout the BORTAS-B measurement
campaign and assuming an OH concentration of 2×10⁶molecules cm−3.(a)and(b)show the measured O3and CO mixing ratios,
respec-tively, in units of ppbv as a function of the calculated photochemical age in days.(c)shows the scatter of O3versus CO with straight lines
showing linear fits to each population of data points.(d)shows the enhancement of O3relative to CO (1O3/1CO) as a function of
photo-chemical age. In all plots the data are filtered according to their relative abundance of CH3CN, with black diamonds representing CH3CN
mixing ratios between 150 and 300 pptv and red diamonds representing CH3CN mixing ratios in excess of 300 pptv. Measurements made on
flight B626 over the fire region in Northwestern Ontario are treated separately and are represented by green circles.
data. The three populations of data points defined for flight B626, and moderate and high CH3CN, show clear
distinc-tions from one another. Straight lines fitted to each pop-ulation and their slopes provide an indication of O3
pro-duced since the fire emissions of CO and other precursors at the source, i.e. 1O3/1CO (Parrish et al., 1993; Pfister
et al., 2006). Measurements of fresh biomass burning air masses were made during flight B626, indicated by a slope of 0.009±0.001 ppbv ppbv−1. Of the measurements made on the other BORTAS research flights, those with the high-est CH3CN mixing ratios were made in moderately fresh
plume air masses with photochemical ages of 2–4 days. The gradient of the straight line fitted to these data points is 0.016±0.001 ppbv ppbv−1, suggesting a slight increase in O3production downwind of the emission source.
Measure-ments with moderate CH3CN are typically more aged
(pho-tochemical ages>4 days) and indicate increased O3
produc-tion relative to the other two populaproduc-tions, as reflected in the gradient of the straight line fitted to these data points of
1.292±0.007 ppbv ppbv−1. Figure 6d shows enhancement ratios of O3 relative to CO as a function of photochemical
age. Enhancements of O3and CO (i.e.1O3and1CO) are
calculated relative to background values determined from the distribution of clean air measurements defined by CH3CN
mixing ratios less than 100 pptv and CO mixing ratios less than 100 ppbv. Average O3and CO mixing ratios in the clean
air measurements were 42.0±14.3 ppbv in the range 21.5– 124.8 ppbv, and 87.8±6.6 ppbv in the range 70.1–99.9 ppbv, respectively. We calculate background O3and CO mixing
ra-tios, using the 25th percentile of the distribution of the clean air measurements, to be 25 and 81 ppbv, respectively.
The 1O3/1CO ratios for the three populations of data
show a similar trend to the gradients calculated for the O3
to CO relationship in Fig. 6c, with the value of1O3/1CO
increasing from the measurements made on flight B626 through the high CH3CN measurements to the
moder-ate CH3CN measurements. The measurements made on
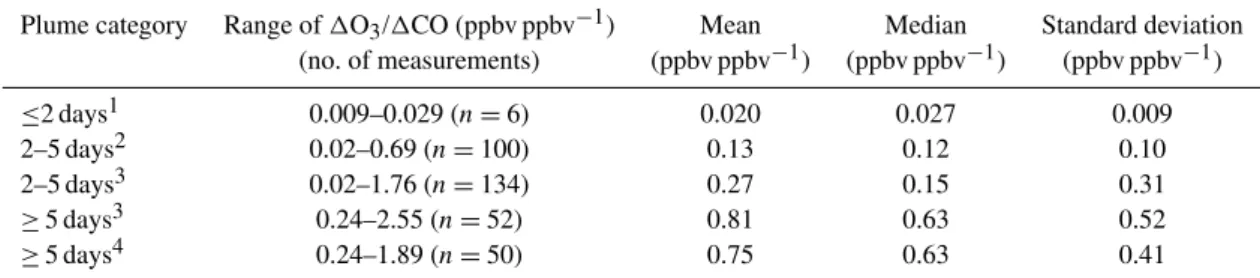
Table 2.Observed 1O3/1CO in biomass burning plumes sampled during BORTAS filtered by photochemical age, following Jaffe and
Wigder (2012).
Plume category Range of1O3/1CO (ppbv ppbv−1) Mean Median Standard deviation
(no. of measurements) (ppbv ppbv−1) (ppbv ppbv−1) (ppbv ppbv−1)
≤2 days1 0.009–0.029 (n=6) 0.020 0.027 0.009
2–5 days2 0.02–0.69 (n=100) 0.13 0.12 0.10
2–5 days3 0.02–1.76 (n=134) 0.27 0.15 0.31
≥5 days3 0.24–2.55 (n=52) 0.81 0.63 0.52
≥5 days4 0.24–1.89 (n=50) 0.75 0.63 0.41
1Flight B626; 2[CH
3CN]>300 pptv; 3[CH
3CN]>150 pptv; 41O
3/1CO<2 ppbv ppbv−1.
0.01 0.10 1.00 10.00
∆O3/∆CO / ppbv ppbv -1
-3 -2 -1 0 1 2
log
10
(
∆
O3
-
∆
CO)
0-2 days 2-4 days 4-6 days > 6 days
Fig. 7.Scatter plot of log10of the difference between O3and CO enhancements in biomass burning plumes relative to background
values (i.e.1O3 and 1CO) as a function of the1O3/1CO
en-hancement ratio. The data are filtered based on photochemical ages
calculated from the ln(C3H8/C2H6) ratio. The horizontal and
ver-tical dotted lines show the zero difference and unit ratio values, re-spectively.
0.015 and 0.05 ppbv ppbv−1 over a range of photochemi-cal ages between 0 and 8 days. The 1O3/1CO ratio
de-creases from 0.03 to 0.01 ppbv ppbv−1between 0 and 2 days of photochemical ageing, with the lowest values associated with higher CO mixing ratios in excess of 250 ppbv, creasing from approximately 150 ppbv (Fig. 6b), and in-creases from 0.03 to 0.05 ppbv ppbv−1between 5 and 8 days
of photochemical ageing. The high CH3CN measurements
show a wide range of 1O3/1CO ratios, from 0.02 to
0.3 ppbv ppbv−1, between 2 and 4 days of photochemical ageing. A few high CH3CN measurements with
photochem-ical ages between 4 and 8 days have higher1O3/1CO
ra-tios from 0.2 to 0.5 ppbv ppbv−1. In general, the moder-ate CH3CN measurements have photochemical ages greater
than 4 days and exhibit higher 1O3/1CO ratios between
0.1 and 1.0 ppbv ppbv−1. Some measurements with moderate CH3CN have photochemical ages less than 4 days, although
this does not appear to significantly affect the 1O3/1CO
ratio in these air masses. The measurements made with less than 2 days photochemical ageing and1O3/1CO ratios
greater than 0.07 ppbv ppbv−1 may be attributable to a fire
source with different initial NMHC mixing ratios than those used in the photochemical age calculation or could be aged air masses that have experienced mixing with air of different origin which has influenced the NMHC abundance. Further analysis of these data points is beyond the scope of the anal-ysis presented here.
Figure 7 shows that the main contributing factor to the variability in the1O3/1CO ratios observed in biomass
burn-ing plumes changes as a function of the plume photochem-ical age. As reflected in Fig. 4a and b, variability in 1O3
increases as a function of 1O3/1CO while variability in
1CO decreases to a point where the main contributing factor changes from1CO to1O3. For air masses with
photochem-ical ages of less than 4 days,1O3is generally less than1CO
(i.e. log10(1O3–1CO)<0 and1O3/1CO<1) and the
vari-ability in1O3/1CO is controlled by1CO. At
photochem-ical ages greater than 4 days, the variability in 1O3/1CO
is controlled by a combination of1CO, for1O3/1CO
be-tween 0.1 and 1.0, and1O3, for1O3/1CO greater than 1.0.
A review of O3production in the outflow from wildfires,
including boreal regions, was recently presented by Jaffe and Wigder (2012). Table 2 presents statistics of1O3/1CO
ratios in boreal biomass burning plumes sampled during BORTAS, arranged by photochemical age following Jaffe and Wigder (2012). The BORTAS results show that the 1O3/1CO ratio increases with plume age in both the range
and average (mean and median) values, indicating that O3
production is enhanced in plumes that have undergone more photochemical processing as they are transported away from the source region. For plume ages less than 2 days, the BOR-TAS 1O3/1CO ratios are within the range of ARCTAS
is comparable to the mean of 0.018 ppbv ppbv−1
calcu-lated by Jaffe and Wigder (2012) from studies by Alvarado et al. (2010), Goode et al. (2000), Singh et al. (2010) and DeBell et al. (2004). For plume ages between 2 and 5 days the range of BORTAS 1O3/1CO ratios are
com-parable to the ranges determined for boreal biomass burn-ing plumes from eastern Canada (Mauzerall et al., 1996) and Siberia (Tanimoto et al., 2008). The mean ratio of 0.13±0.10 ppbv ppbv−1for the high CH3CN measurements
is comparable to the average ratio of 0.15 ppbv ppbv−1 cal-culated by Jaffe and Wigder (2012) for this plume category. For the moderate CH3CN measurements the mean ratio
in-creases to 0.27±0.31 ppbv ppbv−1, which is also compa-rable to the mean, although with a much wider range of values (ratio reported by (Jaffe and Wigder, 2012)). For plume ages greater than 5 days, the BORTAS 1O3/1CO
ratios are typically within the range of values presented by Jaffe and Wigder (2012). The mean 1O3/1CO ratio
of 0.81±0.52 ppbv ppbv−1for BORTAS is higher than the mean values of approximately 0.25 ppbv ppbv−1 for North American boreal biomass burning plumes (Pfister et al., 2006; Val Martin et al., 2006) and is more comparable to similarly aged plumes originating in Siberia (Bertschi and Jaffe, 2005; Honrath et al., 2004). The observed upper-limit of 2.55 ppbv ppbv−1 in the range of 1O3/1CO
ra-tios for these measurements is much higher than for the data presented by Jaffe and Wigder (2012). Restricting this upper-limit to 2 ppbv removes two data points from the BORTAS statistics, reducing the mean value from 0.81±0.57 ppbv ppbv−1 to 0.75±0.41 ppbv ppbv−1. The
observed increase in1O3/1CO ratios calculated from the
BORTAS plume measurements with longer photochemical ages and moderate CH3CN reflects plume dilution and
effi-cient O3production at low NOxmixing ratios (Bertschi and
Jaffe, 2005; Jaffe and Wigder, 2012).
4.3 O3photochemistry in boreal biomass burning
outflow
The1O3/1CO ratios presented above assume that
enhance-ments in plume air over background values provide an in-dication of O3 production in biomass burning plumes and
that variations in the1O3/1CO ratio are due to variability
in1O3. However, this ratio provides limited information on
the photochemistry occurring in the plume air masses. We now evaluate O3mixing ratios measured in boreal biomass
burning plumes during the BORTAS campaign against mea-surements of other chemical species associated with O3
pho-tochemistry.
4.3.1 Ozone production efficiency
A useful concept for understanding O3 formation in
pol-luted air masses is the ozone production efficiency (OPE) which is defined as the number of O3 molecules produced
per molecule of NOx that is oxidised (e.g. Trainer et al.,
1993; Olszyna et al., 1994; Ryerson et al., 1998). We eval-uate OPE in the plumes sampled during the BORTAS cam-paign through comparison of the measured O3 mixing
ra-tios to measurements of alkyl nitrates and the surrogate species NOz. Photochemical production of O3 in polluted
air masses is dependent on the interaction between VOC and NOxchemistry as shown in Fig. 1 and Reactions (R4)–
(R6)/(R7). Thus, comparing the products of Reactions (R6) and (R7) provides an indication of the potential for O3
for-mation in an air mass based on the relative concentrations of alkyl nitrates (RONO2 in Reactions (R6) and (R7) and
referred to as 6AN from hereon in) and the level of oxi-dant (Ox= O3+ NO2). Similarly, the surrogate species NOz
(=NOy−NOx) represents the photo-oxidation products of
reactive nitrogen species (i.e. NOx) and evaluating Oxin
re-lation to NOz will provide an indication of the potential for
O3formation in an air mass.
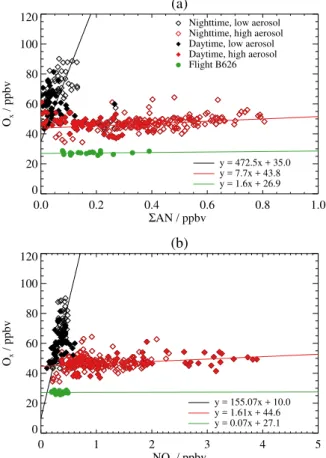
Figures 8a and b show the distribution of Ox relative to
6AN and NOzmeasured in boreal biomass burning plumes
during BORTAS, respectively. In both cases three main pop-ulations of data points can be clearly defined with a dis-tinctive “L-shape” distribution for measurements made on all BORTAS research flights, not including flight B626 (i.e., Ox mixing ratios in excess of 30 ppbv). Higher values of
6AN and NOzgenerally correspond to lower values of Ox,
and lower values of 6AN and NOz generally correspond
to higher values of Ox. The main factor that distinguishes
between the two branches of the “L-shape” pattern is the aerosol loading of the measured air mass. High aerosol load-ing in the plumes is determined usload-ing measured black carbon mass concentration greater than 0.1 µg cm−3and
nephelome-ter measurements of the total scatnephelome-ter coefficient at 550 nm greater than 1.1×10⁻⁵m−1(corresponding to a black car-bon mass concentration of 0.1 µg cm−3, and used to fill in gaps in the black carbon measurements). Although the vast majority of scattering is due to nonrefractory aerosols, the black carbon mass concentration and total scatter coef-ficient measurements are strongly correlated (r=0.92) in the biomass burning plumes sampled during BORTAS, sug-gesting that these are reliable indicators of plume aerosol loading. The highest mixing ratios of 6AN (>0.5 ppbv) and NOz (>2 ppbv) were measured at night-time and
day-time, respectively, in air masses with high aerosol load-ing and correspondload-ing Ox mixing ratios between
approxi-mately 40 and 60 ppbv. Daytime6AN and night-time NOz
measurements along the horizontal branch of the “L-shape” distribution were typically made in air masses with high aerosol loading with mixing ratios ranging between 0-0.5 and 0-2 ppbv, respectively. Measurements made in plume air masses with low aerosol loading (black carbon mass con-centration ¡ 0.1 µg cm−3) lie along the vertical branch of the “L-shaped” distributions in Fig. 8 and generally have lower 6AN (<0.2 ppbv) and NOz (<0.8 ppbv) mixing ratios and
(a)
0.0 0.2 0.4 0.6 0.8 1.0
ΣAN / ppbv 0
20 40 60 80 100 120
Ox
/ ppbv
y = 472.5x + 35.0 y = 7.7x + 43.8 y = 1.6x + 26.9 Nighttime, low aerosol Nighttime, high aerosol Daytime, low aerosol Daytime, high aerosol Flight B626
(b)
0 1 2 3 4 5
NOz / ppbv
0 20 40 60 80 100 120
Ox
/ ppbv
y = 155.07x + 10.0 y = 1.61x + 44.6 y = 0.07x + 27.1
Fig. 8.Relationship between(a)Ox(O3+ NO2) and alkyl nitrates
(6AN), and (b) Ox and NOz (NOy−NOx) measured in boreal
biomass burning plumes from the BAe-146 over the course of the BORTAS measurement campaign. Night-time and daytime mea-surements are represented by open and closed diamonds, respec-tively. Black symbols represent measurement with black carbon
mass concentrations less than 0.1 µg cm−3and red symbols with
black carbon mass concentrations greater than 0.1 µg cm−3.
Mea-surements made on flight B626 over the fire region in Northwestern Ontario are treated separately and are represented by closed green circles.
It should be noted that measurements with lower Ox
mix-ing ratios (40–60 ppbv) show a mixture of both high and low aerosol loading and Ox mixing ratios greater than 60 ppbv
were made only in air masses with low aerosol loading. The third population of data points, with Ox mixing ratios
less than 30 ppbv corresponds to measurements made dur-ing flight B626 over Northwestern Ontario and show a nar-rower range of Ox(25–30 ppbv) for6AN between 0.05 and
0.4 ppbv and NOzbetween 0.1 and 0.5 ppbv.
We estimate OPE in biomass burning plumes relative to 6AN and NOz from the gradients of straight lines fitted
to each population of data points in Fig. 8 using a non-linear least squares method. This is a useful diagnostic for giving a general indication of the potential for O3
forma-tion but it should be noted that calculating OPE in this way
represents an upper limit due to potential loss of Ox and
NOy species from the plume air due to wet and dry
de-position (e.g. Wang et al., 1996; Rickard et al., 2002). For relatively fresh biomass burning plumes measured on flight B626 the slope of the fit is 1.6±15.6 ppbv ppbv−1relative to6AN and 0.07±13.5 ppbv ppbv−1 relative to NOz (i.e.,
1.6 Oxmolecules are produced relative to each molecule of
6AN and 0.07 Ox molecules per molecule of NOz). The
gradient of the fit increases to 7.7±3.5 ppbv ppbv−1 rel-ative to 6AN and 1.6±0.9 ppbv ppbv−1 relative to NOz
for the plume measurements made with high aerosol load-ing and to 472±28 ppbv ppbv−1 relative to 6AN and 155±5 ppbv ppbv−1relative to NOzfor the plume
measuments made with low aerosol loading. The change in the re-lationship between Ox and 6AN with plume
photochemi-cal age observed during BORTAS is consistent with that ob-served in pollution outflow from Mexico City by Perring et al. (2010) in which slopes of the lines of best fit to air-craft measurements in the outflow increased from approxi-mately 16 ppbv ppbv−1to 89 ppbv ppbv−1as the plume age increased from less than 10 h to between 40 and 50 h. Per-ring et al. (2010) explained that increased O3 production
with plume age was due to an increase in non-nitrate produc-ing O3 precursors associated with depleted primary VOCs
and enhanced secondary OVOCs. The high OPE relative to 6AN calculated from the BORTAS measurements of aged plumes with low aerosol loading are consistent with slopes for remote areas of the troposphere such as the remote Pa-cific (Perring et al., 2010). The OPE values relative to NOz
calculated from the BORTAS measurements represent the extremes of typical OPE values previously reported in the literature and summarised in Table 1 of Rickard et al. (2002). The OPE of 1.6 ppbv ppbv−1 relative to NO
z in the
BOR-TAS plume measurements with high aerosol loading is sim-ilar to the OPE observed in urban and power station pollu-tion plumes in the eastern USA (Chin et al., 1994; Ryerson et al., 1998; Daum et al., 2000; Sillman, 2000) whereas the OPE of 155 ppbv ppbv−1 in the plume measurements with low aerosol loading is more comparable to the OPE observed in aged air masses of continental origin over the western Pa-cific Ocean (Davis et al., 1996).
An alternative method for calculating OPE from the ob-served Ox and NOz mixing ratios is to calculate
enhance-ments of each observed value relative to a background value (i.e. OPE=1Ox/1NOz) similar to the method described for
1O3/1CO in the previous section. Figure 9 shows the
dis-tribution of OPE using 1Ox/1NOz ratios calculated from
the BORTAS biomass burning plume measurements as a function of NOx. Background mixing ratios of Oxand NOz
were determined, in the same way as the background O3and
0.0 0.2 0.4 0.6 0.8 1.0 NOx / ppbv
0 100 200 300 400
∆
Ox
/
∆
NO
z
/ ppbv ppbv
-1
Nighttime, low aerosol Nighttime, high aerosol Daytime, low aerosol Daytime, high aerosol Flight B626
Fig. 9.Relationship between the enhancement ratio of Oxto NOz
(1Ox/1NOz) in units of ppbv ppbv−1 and NOx mixing ratio in
units of ppbv measured in boreal biomass burning plumes from the BAe-146 over the course of the BORTAS measurement campaign. Symbols are the same as those described for Fig. 8.
NOx mixing ratios ranging from 0.05 and 0.6 ppbv.
Mea-surements with low aerosol loading have higher OPE be-tween 50 and 400 ppbv ppbv−1and a narrower range of NOx
mixing ratios between 0 and 0.25 ppbv. The NOx mixing
ratios in this branch of the distribution shows a clear dis-tinction between higher (>0.1 ppbv) and lower (<0.1 ppbv) NOx mixing ratios with higher values corresponding to the
night-time measurements. The measurements made on flight B626 over Northwestern Ontario have low OPE less than 30 ppbv ppbv−1 over a similar range of NO
x mixing ratios
as the high aerosol measurements. The changes in OPE rel-ative to NOxfor the two populations of data points defined
by the aerosol loading indicates that plume measurements were potentially made under two different chemical regimes. For the measurements made on flight B626 and those made during daytime with high aerosol loading, the large range of NOx mixing ratios and small change in OPE possibly
indi-cate of a more VOC-limited regime. For the low aerosol load-ing measurements, the much narrower range of NOxmixing
ratio and larger change in OPE possibly indicating a more NOx-limited regime.
Figure 10 shows the distributions of relative humidity (RH) and aircraft altitude relative to OPE partitioned for night-time/daytime and high/low aerosol loading, as de-scribed above. Figure 10a shows that the measurements made with OPE less than 70 ppbv ppbv−1 are typically
charac-terised by higher relative humidity (>40 %) than the mea-surements with OPE greater than 70 ppbv ppbv−1(RH typi-cally<40 %). The relationship between RH and OPE shows no distinction between daytime and night-time measure-ments. Figure 10b shows the vertical distribution of RH mea-sured in boreal biomass burning plumes throughout the cam-paign. In general, measurements with low aerosol loading
(a)
0 100 200 300 400
∆Ox/∆NOz / ppbv ppbv-1
0 20 40 60 80 100 120
Relative Humidity / %
Nighttime, low aerosol Nighttime, high aerosol Daytime, low aerosol Daytime, high aerosol Flight B626
(b)
0 20 40 60 80 100 120
Relative Humidity / % 0
2 4 6 8
GPS Altitude / km
Fig. 10.Relationship between(a)relative humidity in percent and
the ratio of the1Ox/1NOzratio in units of ppbv ppbv−1, and(b)
relative humidity and aircraft GPS altitude in km measured in boreal biomass burning plumes over the course of the BORTAS measure-ment campaign. Symbols are the same as those described for Fig. 8.
and low RH were made at higher altitudes (>3 km) during both daytime and night-time. Interestingly, measurements with high aerosol loading and high RH but low OPE were not solely made at lower altitudes but across the entire ver-tical range of the measurements, from 0.5 to 7 km. In gen-eral, plume measurements with low aerosol loading and low RH had corresponding CO, CH3CN and VOC mixing ratios
significantly higher than their respective background values. This, in combination with relatively long photochemical life-times of some of these species (approximately 40 days for CO and longer lived VOCs such as C2H6), suggests that
which was attributable to precipitation along the plume tra-jectory (Griffin et al., 2013; Franklin et al., 2013).
The aerosol loading of the measured air masses provides the distinction between the two branches of the “L-shaped” pattern in OPE relative to both6AN and NOz. Suppressed
O3formation in biomass burning plume air masses with high
aerosol loading is perhaps not so unexpected, as increased aerosol optical depth would be expected to attenuate the ac-tinic flux and photolysis of NO2to form O3. However, this
may not completely account for the suppressed O3
forma-tion as recent laboratory studies have highlighted potential loss of O3and NOyspecies through heterogeneous uptake by
aerosol in biomass burning plumes (Longfellow et al., 2000; Grassian, 2001). Furthermore, light-induced heterogeneous photochemical O3 loss on the surface of biomass burning
aerosols that increases with relative humidity has also been observed in laboratory and field measurements and shown to influence regional tropospheric O3 distributions
(Kono-valov et al., 2012). Figure 11 shows an example of the rela-tive change in NO2photolysis rate,jNO2, measured from the BAe-146 in plume and non-plume air masses along a section of BORTAS flight B624 over the North Atlantic Ocean on 21 July 2011 (see Table 1 and Fig. 9 in Palmer et al., 2013). This flight made five interceptions of a biomass burning plume with significantly elevated CO, CH3CN and black carbon
at altitudes between 1.7 and 3.2 km, and provides a useful dataset for evaluating the potential impact of enhanced black carbon aerosol onjNO2 in biomass burning smoke plumes. These measurements were made above a planetary bound-ary layer between approximately 0.5 and 1.5 km estimated from temperature profiles over Sable Island and wind pro-filer measurements near Halifax (not shown). During the first two interceptions – prior to approximately 202.75 day and at 202.77 day of 2011 – the jNO2 measurements show no clear deviation from the non-plume measurements. On the fi-nal three interceptions, at approximately 202.80, 202.85 and 202.89 days of the same year, the photolysis rate is reduced by a factor of approximately 2 relative to the rate measured in clear air. AlthoughjNO2shows a reduction in the plume mea-surements, it is not reduced completely to zero, which poten-tially indicates that the reduced OPE in these measurements could be due to combination of the processes outlined above. Detailed analysis of these processes, which requires numer-ical model calculations to quantify the change injNO2 and its influence on O3photochemistry, is beyond the scope of
the analysis presented here, and will be investigated through model studies that will be the subject of future papers. 4.3.2 Photostationary steady state and instantaneous
O3production
To further evaluate O3photochemistry in the biomass
burn-ing plumes sampled durburn-ing the BORTAS campaign we use a photostationary steady state calculation to quantify the rela-tive contributions of NOxand other peroxy radicals to the O3
(a)
202.75 202.80 202.85
Time / day of year 2011 0
2 4 6 8
GPS altitude / km
(b)
202.75 202.80 202.85
Time / day of year 2011 0
200 400 600 800 1000
Mixing ratio
CO / ppbv CH3CN / pptv
BC mass conc. / ×103µg cm-3
(c)
202.75 202.80 202.85
Time / day of year 2011 0.000
0.005 0.010 0.015 0.020
jNO2
/ s
-1
CH3CN < 150 pptv
CH3CN > 150 pptv
Fig. 11.Section of BORTAS flight B624 on 21 July 2011 showing
(a)aircraft GPS altitude in km;(b)mixing ratios CO in ppbv and
CH3CN in pptv and black carbon mass concentration in units of
103µg cm−3; and(c)NO2photolysis rate,jNO2, in units of s
−1.
Solid symbols in(c)indicate measurements of CH3CN mixing
ra-tios greater than 150 pptv to indicate plume measurements.
production efficiency. From Reactions (R2) and (R3) and as-suming photostationary steady state (i.e. the loss of O3via
Reaction (R2) is equal to the production of O3 via
Reac-tion (R3)), the following ratio can be defined:
8= jNO2[NO2]
kNO+O3[NO][O3]
(1)
where8 is known as the photostationary ratio, [X] repre-sents the concentration of species X, jNO2 is the photoly-sis rate of NO2 in units of s−1, and kNO+O3 is the kinetic
rate coefficient for the reaction between NO and O3in units
of molecules cm−3s−1. The value ofk
NO+O3was calculated
along the aircraft flight track using the recommended IUPAC definition of 1.4×10⁻¹²exp(−1310/T ) (Atkinson et al.,
2004) whereT is the air temperature measured from the air-craft. The photostationary ratio would have a value of unity if chemical cycling between O3and NOxwas the only
(a)
0.0 0.1 0.2 0.3 0.4 0.5 0.6 NOx / ppbv
0 2 4 6 8 10
Photostationary Ratio,
Φ Low aerosol
High aerosol Flight B626
(b)
0.0 0.2 0.4 0.6 0.8 1.0 NOx/NOy / ppbv ppbv
-1 0
2 4 6 8 10
Photostationary Ratio,
Φ
(c)
0 1 2 3 4 5
NOz / ppbv 0.0
0.2 0.4 0.6 0.8 1.0
NO
x
/NO
y
/ ppbv ppbv
-1
(d)
0.0 0.2 0.4 0.6 0.8 1.0 NOx/NOy / ppbv ppbv
-1 0.0
0.1 0.2 0.3 0.4 0.5
HO
x
RO
x
/ ppbv
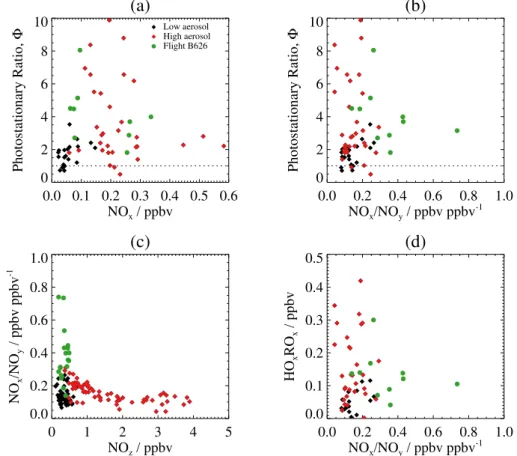
Fig. 12.Relationship between O3photostationary state and the NOybudget measured in boreal biomass burning plumes over the course of
the BORTAS campaign.(a)and(b)show the calculated photostationary ratio,8, versus NOxmixing ratios (ppbv) and the ratio of NOxto
NOyrespectively.(c)shows the relationship between NOx/NOyand NOz.(d)shows calculated total peroxy radical mixing ratios, HOxROx,
required for a photostationary ratio of unity versus NOxmixing ratio. Symbols are the same as those described for Fig. 4.
generalise these families of peroxy radicals as HOxROx
fol-lowing Cantrell et al. (2003).
Figure 12 shows plots of photostationary steady state cal-culations made with the BORTAS aircraft measurements in biomass burning plumes over the course of the campaign. The photostationary ratio defined above is calculated from the measured values of each parameter in Eq.( 1). Figure 12a shows the photostationary ratio versus NOx mixing ratio
with symbols denoting measurements made with high/low aerosol, as defined above. The calculated ratios for all the plume data points show a wide range of values between 0 and 10. Ratios for the measurements made with low aerosol loading generally lie in a narrower range from 0 to 2, sug-gesting that the measurements are closer to photostation-ary steady state. The measurements made with high aerosol generally have photostationary ratios greater than 2 with a wide range of values extending as high as 10. Figure 12b also shows the calculated photostationary ratio but as a func-tion of the ratio NOx/NOy. Note that the expression
defin-ing NOz(i.e. NOz=NOy−NOx) can be rewritten as NOz=
NOy(1−NOx/NOy), in which the term 1−(NOx/NOy)can
be considered as a measure of the photochemical age of the
air mass (i.e. the fraction of the initial NOxemitted that has
been converted into photooxidation products, as NOy
rep-resents total NOxemissions) (Olszyna et al., 1994). Values
of NOx/NOy closer to unity are therefore representative of
fresher emissions because there has been less photochemical processing of NOx. In general, the BORTAS plume
measure-ments have a range of NOx/NOyvalues between 0.0 and 0.4.
The data points in Fig. 12 with NOx/NOyvalues greater than
0.4 are measurements made on flight B626 over Northwest-ern Ontario, indicating that fresher air masses were encoun-tered closer to one of the main source regions. The measure of air mass photochemical age from the ratio of NOx/NOy
is shown relative to the surrogate species NOz in Fig. 12c.
Measurements with NOzmixing ratios less than 1 ppbv were
made in both fresh and aged plumes, with the fresher plumes (NOx/NOy>0.4) all having higher aerosol loading.
Mea-surements with NOzmixing ratios greater than 1 ppbv were
all made in aged plumes (NOx/NOy<0.2).
can be defined: 8HOxROx=
jNO2[NO2]
kNO+O3[NO][O3] +kNO+HO2[NO][HOxROx]
, (2)
wherekNO+HO2 is the kinetic rate coefficient for the
reac-tion between NO and HO2, calculated along the aircraft
flight track using the recommended IUPAC definition of 3.6−12exp(270/T )(Atkinson et al., 2004). Assuming photo-stationary steady state, we estimate mixing ratios of HOxROx
required to bring the photostationary ratio to unity by rear-ranging Eq. (2):
[HOxROx]=
jNO2[NO2] kNO+HO2[NO]
−kNO+O3[O3]
kNO+HO2
(3) Figure 12d shows the HOxROxmixing ratios estimated from
the BORTAS plume measurements using Eq. (3) versus the NOx/NOyratio. The measurements that were closer to unity
in Fig. 12a and b (i.e. night-time or with low aerosol load-ing) generally show the lowest HOxROxmixing ratios with
values below 0.1 ppbv. For the plume measurements with high aerosol loading, the estimated HOxROx mixing ratios
are generally greater than 0.1 ppbv and extend up to approxi-mately 0.4 ppbv. In the fresher plumes (i.e. NOx/NOy>0.4),
the HOxROx mixing ratios are estimated to be just over
0.1 ppbv, with higher mixing ratios generally associated with more aged plumes. The calculated HOxROx mixing ratios
are consistent with values between 0 and 0.35 ppbv calcu-lated from measurements at a ground-based rural site in the northeastern USA (Griffin et al., 2007).
4.3.3 Comparison of O3photochemistry from BORTAS
and previous campaigns
We put the BORTAS plume measurements into context through comparisons with previous aircraft measurement campaigns with a focus over the central and eastern Canada, and sampled outflow from boreal biomass burning. Measure-ments from two different campaigns are used for this con-textual analysis: the NASA ARCTAS-B measurement cam-paign during the summer of 2008 (Jacob et al., 2010); and the NASA ABLE 3B measurement campaign during the summer of 1990 (Harriss et al., 1994).
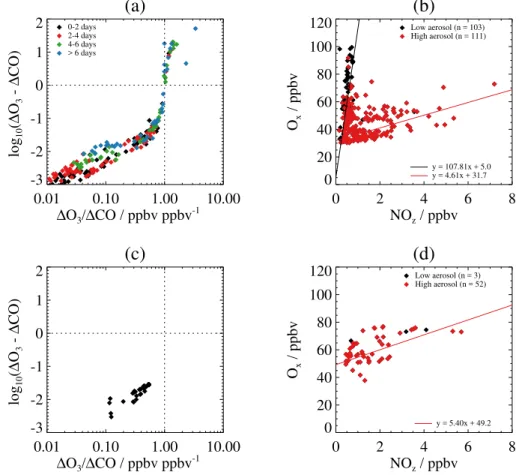
Figure 13 shows a comparison of O3production
diagnos-tics (i.e. log10(1O3−1CO) vs.1O3/1CO and Oxvs. NOz)
derived from aircraft measurements made in biomass burn-ing plumes durburn-ing ARCTAS-B between 29 June and 13 July 2008 (Fig. 13a and b) and ABLE 3B between 6 July and 15 August 1990 (Fig. 13c and d). For the ARCTAS-B mea-surements we use 60 s averaged meamea-surements of O3, NO,
NO2 and NOy made by chemiluminescence (Weinheimer
et al., 1994), CO made by Tunable Diode Laser Absorp-tion Spectroscopy (TDLAS) (Sachse et al., 1987), CH3CN
made by PTR-MS (Wisthaler et al., 2002), and black car-bon from SP2 (Moteki and Kondo, 2007; Kondo et al., 2011). For comparison against the BORTAS measurements,
the ARCTAS-B data are filtered to cover a similar ranges of altitude (0.5–8.0 km), longitude (110–50◦W), and latitude (40–60◦N). Plume measurements are determined as for the BORTAS measurements, with CH3CN mixing ratios in
ex-cess of 150 pptv, and high aerosol loading is determined for black carbon mass concentrations greater than 0.1 µg cm−3. For the ABLE 3B measurements we use 90 s averaged mea-surements of O3, NO, NO2and NOy, CO, and carbon
tetra-chloride (C2Cl4) (Blake et al., 1994; Harriss et al., 1994;
Sandholm et al., 1994; Wofsy et al., 1994). The ABLE 3B deployment was very similar to that of BORTAS, with mea-surements extending from Northwest Territories and north-ern Manitoba across Ontario and Quebec to the east coast of Labrador. No CH3CN measurements were made during
ABLE 3B and plume measurements are determined from where measurements of C2Cl4 mixing ratios, a tracer of
anthropogenic emissions (Wofsy et al., 1994), were below 20 pptv and CO mixing ratios were greater than 150 ppbv. The aerosol loading in the plume measurements are deter-mined from concentrations of total fine (0.195–3.12 µm) and coarse (0.5–8.0 µm) particles greater than 20 cm−3.
The ARCTAS-B measurements shown in Fig. 13a, b show similar distributions to the BORTAS measurements shown in Figs. 7 and 8b, respectively. The variabil-ity in the ARCTAS-B 1O3/1CO ratios is controlled by
1O3 in air masses with photochemical ages greater than
4 days, although, as with the BORTAS data, a wide range of 1O3/1CO ratios were observed in air masses with
these ages. The relationship between Ox and NOz in the
ARCTAS-B data also shows a distinctive “L-shaped” distri-bution, with relatively higher NOz(greater than 1 ppbv) and
lower Ox (less than 60 ppbv) mixing ratios in plume
mea-surements with high aerosol loading, and lower NOz/higher
Ox associated with low aerosol loading. Slopes of straight
lines fitted to the ARCTAS-B data give OPEs relative to NOzof 4.6±31.7 ppbv ppbv−1for the high aerosol
measure-ments and 107.8±5.0 ppbv ppbv−1for the low aerosol mea-surements. The increased high aerosol OPE and decreased low aerosol OPE compared against the BORTAS measure-ments further reflect that ARCTAS-B sampled fresher, near-field, biomass burning plumes. The ABLE 3B measurement campaign made considerably less measurements in biomass burning plumes than BORTAS and ARCTAS-B. Figure 13c shows that the ABLE 3B measurements that are attributed to biomass burning plumes, as described above, had1O3/1CO
ratios between 0.1 and 1.0 ppbv ppbv−1, indicating that1O 3
was always less than1CO in the ABLE 3B measurements. In general, the ABLE 3B measurements were shown to have relative high aerosol loading and the OPE relative to NOz,
Fig. 13d, was calculated to be 5.4±49.2 ppbv ppbv−1, con-sistent with the high aerosol OPE values calculated for BOR-TAS and ARCBOR-TAS-B.
Figure 14 shows the relationship between O3mixing ratio

![Fig. 5. Scatter plot of the natural logarithms of the ratios of [C 4 H 10 ]:[C 2 H 6 ] and [C 3 H 8 ]:[C 2 H 6 ] measured from whole air can-ister samples taken by the BAe-146 during the BORTAS campaign period](https://thumb-eu.123doks.com/thumbv2/123dok_br/18179212.330896/6.892.467.818.393.654/scatter-natural-logarithms-measured-samples-bortas-campaign-period.webp)