www.atmos-chem-phys.net/10/11931/2010/ doi:10.5194/acp-10-11931-2010
© Author(s) 2010. CC Attribution 3.0 License.
Chemistry
and Physics
Characterization of trace gases measured over Alberta oil sands
mining operations: 76 speciated C
2
–C
10
volatile organic compounds
(VOCs), CO
2
, CH
4
, CO, NO, NO
2
, NO
y
, O
3
and SO
2
I. J. Simpson1, N. J. Blake1, B. Barletta1, G. S. Diskin2, H. E. Fuelberg3, K. Gorham1, L. G. Huey4, S. Meinardi1, F. S. Rowland1, S. A. Vay2, A. J. Weinheimer5, M. Yang1,2, and D. R. Blake1
1Dept. of Chemistry, University of California-Irvine, Irvine, CA 92697, USA 2NASA Langley Research Center, Hampton, VA 23681, USA
3Dept. of Meteorology, Florida State University, Tallahassee, FL 32306, USA
4School of Earth & Atmospheric Sciences, Georgia Institute of Technology, Atlanta, GA 30332, USA 5National Center for Atmospheric Research, 1850 Table Mesa Dr., Boulder, CO 80305, USA
Received: 1 July 2010 – Published in Atmos. Chem. Phys. Discuss.: 5 August 2010
Revised: 19 November 2010 – Accepted: 26 November 2010 – Published: 15 December 2010
Abstract.Oil sands comprise 30% of the world’s oil reserves and the crude oil reserves in Canada’s oil sands deposits are second only to Saudi Arabia. The extraction and processing of oil sands is much more challenging than for light sweet crude oils because of the high viscosity of the bitumen con-tained within the oil sands and because the bitumen is mixed with sand and contains chemical impurities such as sulphur. Despite these challenges, the importance of oil sands is in-creasing in the energy market. To our best knowledge this is the first peer-reviewed study to characterize volatile organic compounds (VOCs) emitted from Alberta’s oil sands mining sites. We present high-precision gas chromatography mea-surements of 76 speciated C2–C10 VOCs (alkanes, alkenes, alkynes, cycloalkanes, aromatics, monoterpenes, oxygenated hydrocarbons, halocarbons and sulphur compounds) in 17 boundary layer air samples collected over surface mining operations in northeast Alberta on 10 July 2008, using the NASA DC-8 airborne laboratory as a research platform. In addition to the VOCs, we present simultaneous measure-ments of CO2, CH4, CO, NO, NO2, NOy, O3and SO2, which were measured in situ aboard the DC-8.
Carbon dioxide, CH4, CO, NO, NO2, NOy, SO2and 53 VOCs (e.g., non-methane hydrocarbons, halocarbons, sul-phur species) showed clear statistical enhancements (1.1– 397×)over the oil sands compared to local background
val-Correspondence to:I. J. Simpson ([email protected])
In addition to the emission of many trace gases, the nat-ural drawdown of OCS by vegetation was absent above the surface mining operations, presumably because of the widespread land disturbance. Unexpectedly, the mixing ra-tios ofα-pinene andβ-pinene were much greater over the oil sands (up to 217 pptv and 610 pptv, respectively) than over vegetation in the background boundary layer (20±7 pptv and 84±24 pptv, respectively), and the pinenes correlated well with several industrial tracers that were elevated in the oil sands plumes. Because so few independent measurements from the oil sands mining industry exist, this study provides an important initial characterization of trace gas emissions from oil sands surface mining operations.
1 Introduction
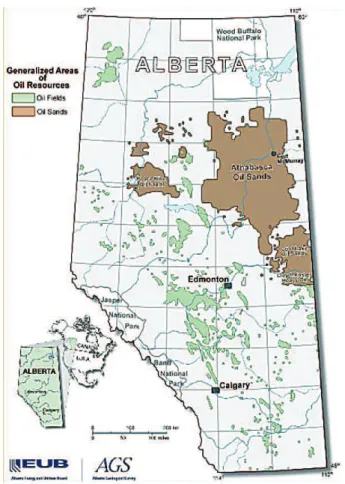
Hydrocarbons are the basis of oil, natural gas and coal. Crude oil contains hydrocarbons with five or more carbon atoms (i.e., ≥C5), with an average composition of alkanes (30%), cycloalkanes (49%), aromatics (15%) and asphaltics (6%) (Alboudwarej et al., 2006). Oil sands comprise 30% of total world oil reserves (Alboudwarej et al., 2006) and are a mixture of sand, water, clay and crude bitumen – a thick, sticky extra-heavy crude oil that is “unconventional”, i.e., does not flow and cannot be pumped without heating or dilution. With 179 billion barrels in its deposits, most of which occurs as oil sands, Canada has the world’s 2nd largest crude oil reserves after Saudi Arabia and is currently the world’s 7th largest producer of crude oil, generating about 1 million barrels day−1 with almost 4 million barrels day−1expected by 2020 (www.canadasoilsands.ca). Alberta is Canada’s largest oil producer and has oil sands deposits in three relatively remote regions: Athabasca (which is serviced by Fort McMurray), Peace River and Cold Lake (Fig. 1). Shallow oil sands deposits (<75 m deep) in the Athabasca region can be surface mined, which has disturbed about 600 km2 of land and comprises ∼20% of Alberta’s oil sands production (www.oilsands.alberta.ca). Each barrel of oil generated from surface mining requires about 2 tons of oil sands, 3 barrels of water – much of which is re-used – and 20 m3 of natural gas (http://www.neb.gc.ca/ clf-nsi/rnrgynfmtn/nrgyrprt/lsnd/pprtntsndchllngs20152006/ qapprtntsndchllngs20152006-eng.html). Deeper deposits occur in all three regions and require other in situ re-covery methods such as steam injection and have higher natural gas requirements, but they have the advantage of much less land disturbance and no need for tailings ponds (www.oilsands.alberta.ca).
Oil sands processing extracts the bitumen from the oil sands and upgrades it into synthetic crude oil. The sur-face mining operators (e.g., Syncrude Canada, Suncor En-ergy, Albian Sands Energy) extract the bitumen using a hot water process (e.g., www.syncrude.ca/users/folder.asp?
Fig. 1. Alberta’s oil sands deposits in the Athabasca, Peace River and Cold Lake regions (brown areas) (http://www.energy.alberta.ca/ Oil/pdfs/oil resources Map.pdf).
became methanogenic in the 1990s (Holowenko et al., 2000; Siddique et al., 2008). The methanogens are believed to anaerobically degrade certain components of naphtha (C6– C10 n-alkanes and aromatics such as toluene and xylenes) into methane (CH4), at rates of up to 10 g CH4m−2d−1 or 40 million L CH4d−1 (Holowenko et al., 2000; Siddique et al., 2006, 2007, 2008; Penner and Foght, 2010).
Despite the emerging importance of oil sands in the en-ergy market, characterizations of the emissions of volatile organic compounds (VOCs) and other trace gases from the oil sands industry are extremely scarce in the peer-reviewed literature. Whereas downstream oil sands upgrading and re-fining facilities can be monitored by ground-based studies (e.g., Mintz and McWhinney, 2008), independent studies of oil sands mining emissions are particularly difficult because the mining operations are not accessible to the public (Timo-ney and Lee, 2009). Instead, the majority of oil sands studies are reported in the so-called “grey literature”, consisting of discipline-specific reports, industrial monitoring reports, re-ports by industrially-controlled consortia, and rere-ports com-missioned by non-governmental organizations (Timoney and Lee, 2009). Air quality in the oil sands surface mining air shed is monitored locally by the Wood Buffalo Environmen-tal Association (WBEA), which is a multi-stakeholder orga-nization that represents industry, environmental groups, gov-ernment, communities, and Aboriginal stakeholders. Long-term monitoring data and reports are available at the WBEA website (www.wbea.org) but these data have not been pub-lished in the peer-reviewed literature.
We present independent observations of 76 speciated C2– C10 VOCs, CH4, sulphur dioxide (SO2), carbon dioxide (CO2), carbon monoxide (CO), ozone (O3), nitric oxide (NO), nitrogen dioxide (NO2) and total reactive nitrogen (NOy=NO + NO2+ HNO3+ PANs + other organic nitrates + HO2NO2+ HONO + NO3+ 2×N2O5+ particulate NO−3 + . . . ) near surface oil sands mining and upgrading oper-ations in Alberta’s Athabasca region. Although present in trace quantities in the Earth’s atmosphere, these gases drive the atmosphere’s chemistry and radiative balance (Forster et al., 2007 and references therein). For example hydrocarbons and nitrogen oxides (NOx=NO + NO2)are key atmospheric constituents that can react together in the presence of sun-light to form tropospheric O3, itself a greenhouse gas and air pollutant. Many hydrocarbons (e.g., benzene, toluene) can also be toxic or carcinogenic. Sulphur dioxide is produced by industrial processes including petroleum combustion and can contribute to photochemical smog and acid rain. Our measurements were made on 10 July 2008 during a 17 min boundary layer (BL) flight leg over the Alberta oil sands us-ing the NASA DC-8 aircraft as a research platform (http:// airbornescience.nasa.gov/platforms/aircraft/dc-8.html). The VOCs were collected in seventeen 45 s integrated whole air samples that were subsequently analyzed at the University of California, Irvine (UC-Irvine). The remaining trace gases were sampled continuously, with CO2, CH4, CO, NO, NO2,
NOyand O3reported every 1 s and SO2reported every 30 s. Although clearly limited in temporal and spatial extent, to our best knowledge these measurements represent the first independent characterization of speciated VOCs and many other trace gases from oil sands mining in the peer-reviewed literature.
2 Experimental
Boundary layer air was sampled over the Athabasca surface mines as part of the 2008 Arctic Research of the Composition of the Troposphere from Aircraft and Satellites (ARCTAS) field mission (www-air.larc.nasa.gov/missions/arctas/arctas. html). The summer deployment of ARCTAS was based in Cold Lake, Alberta (54◦25′N; 110◦12′W) and included
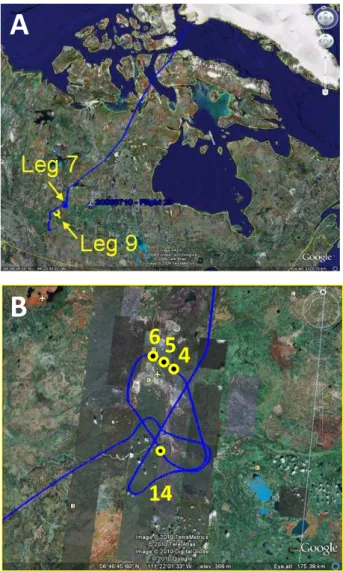
eight 8-h science flights (Flights 17–24) from 29 June–13 July 2008. Although the major focus of the summer phase of ARCTAS was boreal biomass burning emissions (Jacob et al., 2009), on 10 July 2008 (Flight 23) there was an op-portunity for the DC-8 to make two descents into the BL over northeast Alberta as part of a return transit flight from Thule, Greenland to Cold Lake (Fig. 2). During the first BL excursion (Leg 7) the DC-8 circled over the Athabasca oil sands mining area between 11:27–11:44 local time, at alti-tudes between 720–850 m and within an area bounded by 56◦34′–57◦09′N and 111◦01′–111◦50′W. The aircraft flew over both boreal forest and cleared industrial land including tailings ponds, tailings sand and upgrader facilities (Fig. 2b). Ten-day backward trajectories show that during Leg 7 the air masses arrived at the aircraft’s pressure level from the west (Fig. 3a). The second BL run was flown shortly af-ter, from 12:00–12:15 local time at altitudes between 980– 1410 m (Leg 9). Leg 9 was an intercomparison flight leg between the DC-8 and the NASA P-3B aircraft that oc-curred in generally clean air approximately 1◦further south (55◦39′–56◦16′N and 112◦44′–113◦47′W), i.e., not over the oil sands. The ten-day backward trajectories for Leg 9 show that the sampled air masses also arrived from the west and not from the oil sands mines to the north (Fig. 3b). There-fore, even though Leg 9 occurred at higher altitudes within the BL, we believe it provides a reasonable concurrent lo-cal background against which to compare the oil sands VOC enhancements (see additional discussion in Sect. 3.2.3). 2.1 Volatile organic compounds (VOCs)
2.1.1 Airborne whole air sampling
A
B
6
5
4
14
Fig. 2. (a)Flight track of the NASA DC-8 aircraft during Flight 23, a transit flight from Thule, Greenland to Cold Lake, Alberta on 10 July 2008. The DC-8 circled within the boundary layer over the oil sands for 17 min (Leg 7) then descended back into background boundary layer air 16 min later (Leg 9).(b)Detail of the flight path during Leg 7. The locations of selected samples (in which maxi-mum values were measured) are highlighted in yellow. The prevail-ing wind direction was from the southwest quadrant, and samples 4, 5 and 6 were collected directly downwind of the oil sands opera-tions (the grey patch just above the center of the figure).
steel canisters each equipped with a Swagelok Nupro metal bellows valve (Solon, OH). The electropolishing minimizes the surface area and any surface abnormalities, and the canis-ter conditioning (baking the cans in humidified air at ambient pressure and 225◦C for 12 h) forms an oxidative layer on the interior surface that further passivates the canister walls. The DC-8 payload included 168 of our 2-L air sampling canisters for each flight of the ARCTAS mission.
To prepare the canisters for field use, they are taken to the University of California Crooked Creek Station in the
Fig. 3. Ten-day backward kinematic trajectory plots starting at flight level pressure for the two boundary layer excursions flown on 10 July 2008(a)over the Alberta oil sands from 11:27–11:44 local time (Leg 7), and(b)in background boundary layer air from 12:00–12:14 local time (Leg 9). Computational details are given in Fuelberg et al. (2010).
Sierra Nevada mountains (altitude=10 200 ft) for a pump-and-flush procedure that is repeated ten times, in which each canister is pressurized to 40 psig with ambient air and then vented to ambient pressure. Next the canisters are returned to our UC-Irvine laboratory where they are evacuated to 10−2 Torr and then pressurized to 1000 Torr with ultra-high pu-rity helium before a final evacuation to 10−2 Torr (E2M12 dual-stage vacuum pumps, Edwards Vacuum, Wilmington, MA). Lastly each canister is humidified by adding∼17 Torr of purified water (the approximate vapour pressure of wa-ter at room temperature) to minimize surface adsorption and improve the reproducibility of our analytical split ratios dur-ing laboratory analysis (see Sect. 2.1.2). Rigorous sensitivity tests have shown that alkene growth in our passivated canis-ters is limited to a maximum of 0.2 pptv day−1and all other compounds reported here are stable over the typically short period that the cans are stored before analysis (Sive, 1998). By analyzing the Alberta samples within 7 days of collec-tion, we were able to limit the size of any alkene artefact to 1.4 pptv or less (i.e., to negligible values).
During each flight the whole air sampling is manually con-trolled and uses a stainless steel dual head metal bellows pump (MB-602, Senior Aerospace Metal Bellows, Sharon, MA) that is configured in series to draw outside air into a window-mounted 1/4′′forward-facing inlet, through our air sampling manifold, and into one of the 168 canisters until it is filled to 40 psig. During Leg 7 we collected seventeen 45-second air samples, or approximately one sample per minute. During Leg 9 we collected 1-min integrated air samples ev-ery 3 min, for a total of 6 samples.
2.1.2 Laboratory analysis of VOCs
to measure. We use two flame ionization detectors (FIDs) to measure hydrocarbons, two electron capture detectors (ECDs) for halocarbons, and a quadrupole mass spectrom-eter detector (MSD) for sulphur compounds.
Complete analytical details are given in Colman et al. (2001). For each sample a 1520 cm3 sample aliquot is introduced into the analytical system’s manifold and passed over glass beads contained in a loop maintained at liquid nitrogen temperature. A mass flow controller (Brooks In-strument; Hatfield, PA; model 5850E) keeps the flow be-low 500 cm3min−1to ensure complete trapping of the less volatile sample components (e.g., VOCs) while allowing more volatile components (e.g., N2, O2, Ar) to be pumped away. The less volatile species are re-volatilized by im-mersing the loop in hot water (80◦C) and are then flushed
into a helium carrier flow. The sample flow is split into five streams, with each stream chromatographically sepa-rated on an individual column and sensed by a single de-tector, namely: (1) a DB-1 fused silica capillary column (J&W Scientific; 60 m, I.D. 0.32 mm, film 1 mm) connected to an FID; (2) a GS-Alumina PLOT column (J&W Scien-tific; 30 m, I.D. 0.53 mm) spliced with a DB-1 fused sil-ica capillary column (J&W Scientific; 5 m, I.D. 0.53 mm, film 1 mm) and connected to an FID; (3) an Rtx-1701 fused silica capillary column (Restek; 60 m, I.D. 0.25 mm, film 0.50 mm) connected to an ECD; (4) a DB-5 column (J&W Scientific; 30 m, I.D. 0.25 mm, film 1 mm) spliced with an Rtx-1701 column (Restek; 5 m, I.D. 0.25 mm, film 0.5 mm) and connected to an ECD; and (5) a DB-5ms fused silica capillary column (J&W Scientific; 60 m, I.D. 0.25 mm, film 0.5 mm) connected to an MSD. The split ratios are highly re-producible as long as the specific humidity of the injected air is above 2 g-H2O/kg-air, which we ensure by adding puri-fied water into each canister (Sect. 2.1.1). The signal from each FID and ECD is output to a personal computer and dig-itally recorded using Chromeleon Software; the MSD output signal uses Chemstation software. To ensure that the mea-surements are of the highest calibre, each peak of interest on every chromatogram is individually inspected and its integra-tion is manually modified. For Flight 23 more than 10 000 peaks were hand-modified.
Calibration is an ongoing process whereby new standards are referenced to older certified standards, with appropriate checks for stability and with regular inter-laboratory compar-isons. The hydrocarbons standards are NIST-traceable and the halocarbon standards are either NIST-traceable or were made in-house and have been compared to standards from other groups such as NOAA/ESRL. Multiple standards are used during sample analysis, including working standards (analyzed every four samples) and absolute standards (an-alyzed twice daily). Here we used working standards col-lected in the Sierra Nevada mountain range. International intercomparison experiments have demonstrated that our an-alytical procedures consistently yield accurate identification of a wide range of blindly selected hydrocarbons and produce
excellent quantitative results (e.g., Apel et al., 1999, 2003). Table 1 shows the limit of detection (LOD) and the mea-surement precision and accuracy for each VOC. Even though our LOD is conservative, the accuracy and precision of many species does deteriorate as we approach this limit.
2.2 SO2, CO2, CH4, CO, NO, NO2, NOyand O3
In addition to VOCs measured by UC-Irvine, we also present SO2, CO2, CO, CH4, NO, NO2, NOyand O3mixing ratios, which were measured in situ aboard the DC-8 by four re-search teams each using fast-response, high precision, con-tinuous real-time instruments. The measurement precision and accuracy of these compounds are given in Table 1. The time response is 1 s for all compounds except NO and NO2, which have a 3 s time response (SO2 has a 1 s time re-sponse but was reported as a 30 s average). Briefly, SO2was measured using the Georgia Tech Chemical Ionization Mass Spectrometer (GT-CIMS) instrument, which uses SF−6 ion chemistry to selectively ionize SO2(Kim et al., 2007). Car-bon dioxide CO2was measured using the NASA Langley At-mospheric Vertical Observations of CO2in the Earth’s Tro-posphere (AVOCET) instrument, which uses a modified Li-Cor model 6252 differential, non-dispersive infrared (NDIR) gas analyzer at the 4.26 µm CO2 absorption band (Vay et al., 1999, 2003). Methane and CO were measured by the NASA Langley Differential Absorption CO Measurement (DACOM) instrument, which uses two tunable diode lasers in the infrared spectral region to simultaneously measure the absorption of light by CH4(3.3 µm) and CO (4.7 µm) (Fried et al., 2008). Nitric oxide, NO2, NOyand O3were measured using the 4-channel NCAR NOxyO3chemiluminescence in-strument (Weinheimer et al., 1994).
3 Results and discussion
Mixing ratio time series for Flight 23 are shown for selected species in Figs. 4 and 10, and altitudinal profiles are shown for many measured species in Figs. 5–9. Values that are be-low their LOD have been given a value of “0” so that they are visually represented on the graphs. Measurement statis-tics for Flight 23 – including the BL excursions over the oil sands mining operations (Leg 7,n=17) and in background air (Leg 9, n=6) – are given in Table 1. For comparison, statistics for free troposphere (FT) measurements made ear-lier in the flight are also shown (60–76◦N;n=66). Results
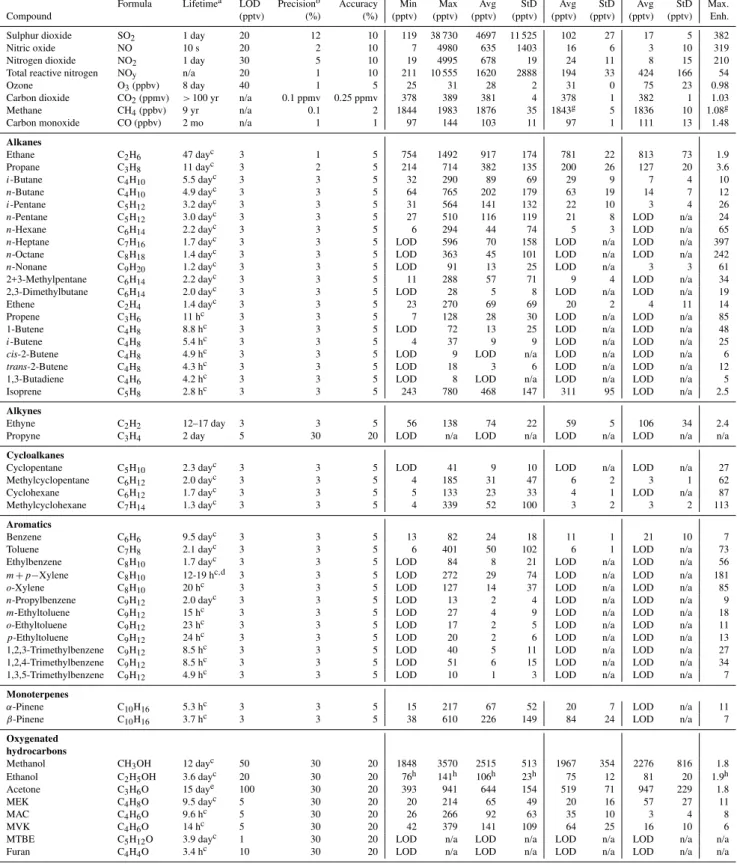
Table 1. Statistics of boundary layer measurements for 84 compounds measured near oil sands surface mining north of Fort McMurray, Alberta on 10 July 2008 (n=17). Concurrent local background values in the boundary layer (Bkgd) are also included (n=6), as are free tropospheric measurements (FT) collected between 60–76◦N (n=66). Max. Enh. = Maximum enhancement of oil sands values over background values (oil sands max/bkgd avg) – when the background mixing ratio was below detection limit (LOD) a mixing ratio of 1.5 pptv was assumed in the enhancement calculations; Min = minimum; Max = maximum; Avg = average; StD = standard deviation; n/a = not applicable. Units: pptv unless otherwise stated.
Oil Sands BKGD FT
Formula Lifetimea LOD Precisionb Accuracy Min Max Avg StD Avg StD Avg StD Max. Compound (pptv) (%) (%) (pptv) (pptv) (pptv) (pptv) (pptv) (pptv) (pptv) (pptv) Enh.
Sulphur dioxide SO2 1 day 20 12 10 119 38 730 4697 11 525 102 27 17 5 382
Nitric oxide NO 10 s 20 2 10 7 4980 635 1403 16 6 3 10 319
Nitrogen dioxide NO2 1 day 30 5 10 19 4995 678 19 24 11 8 15 210
Total reactive nitrogen NOy n/a 20 1 10 211 10 555 1620 2888 194 33 424 166 54
Ozone O3(ppbv) 8 day 40 1 5 25 31 28 2 31 0 75 23 0.98
Carbon dioxide CO2(ppmv) >100 yr n/a 0.1 ppmv 0.25 ppmv 378 389 381 4 378 1 382 1 1.03 Methane CH4(ppbv) 9 yr n/a 0.1 2 1844 1983 1876 35 1843g 5 1836 10 1.08g
Carbon monoxide CO (ppbv) 2 mo n/a 1 1 97 144 103 11 97 1 111 13 1.48
Alkanes
Ethane C2H6 47 dayc 3 1 5 754 1492 917 174 781 22 813 73 1.9
Propane C3H8 11 dayc 3 2 5 214 714 382 135 200 26 127 20 3.6
i-Butane C4H10 5.5 dayc 3 3 5 32 290 89 69 29 9 7 4 10
n-Butane C4H10 4.9 dayc 3 3 5 64 765 202 179 63 19 14 7 12
i-Pentane C5H12 3.2 dayc 3 3 5 31 564 141 132 22 10 3 4 26
n-Pentane C5H12 3.0 dayc 3 3 5 27 510 116 119 21 8 LOD n/a 24
n-Hexane C6H14 2.2 dayc 3 3 5 6 294 44 74 5 3 LOD n/a 65
n-Heptane C7H16 1.7 dayc 3 3 5 LOD 596 70 158 LOD n/a LOD n/a 397
n-Octane C8H18 1.4 dayc 3 3 5 LOD 363 45 101 LOD n/a LOD n/a 242
n-Nonane C9H20 1.2 dayc 3 3 5 LOD 91 13 25 LOD n/a 3 3 61
2+3-Methylpentane C6H14 2.2 dayc 3 3 5 11 288 57 71 9 4 LOD n/a 34
2,3-Dimethylbutane C6H14 2.0 dayc 3 3 5 LOD 28 5 8 LOD n/a LOD n/a 19
Ethene C2H4 1.4 dayc 3 3 5 23 270 69 69 20 2 4 11 14
Propene C3H6 11 hc 3 3 5 7 128 28 30 LOD n/a LOD n/a 85
1-Butene C4H8 8.8 hc 3 3 5 LOD 72 13 25 LOD n/a LOD n/a 48
i-Butene C4H8 5.4 hc 3 3 5 4 37 9 9 LOD n/a LOD n/a 25
cis-2-Butene C4H8 4.9 hc 3 3 5 LOD 9 LOD n/a LOD n/a LOD n/a 6
trans-2-Butene C4H8 4.3 hc 3 3 5 LOD 18 3 6 LOD n/a LOD n/a 12
1,3-Butadiene C4H6 4.2 hc 3 3 5 LOD 8 LOD n/a LOD n/a LOD n/a 5
Isoprene C5H8 2.8 hc 3 3 5 243 780 468 147 311 95 LOD n/a 2.5
Alkynes
Ethyne C2H2 12–17 day 3 3 5 56 138 74 22 59 5 106 34 2.4
Propyne C3H4 2 day 5 30 20 LOD n/a LOD n/a LOD n/a LOD n/a n/a
Cycloalkanes
Cyclopentane C5H10 2.3 dayc 3 3 5 LOD 41 9 10 LOD n/a LOD n/a 27
Methylcyclopentane C6H12 2.0 dayc 3 3 5 4 185 31 47 6 2 3 1 62
Cyclohexane C6H12 1.7 dayc 3 3 5 5 133 23 33 4 1 LOD n/a 87
Methylcyclohexane C7H14 1.3 dayc 3 3 5 4 339 52 100 3 2 3 2 113
Aromatics
Benzene C6H6 9.5 dayc 3 3 5 13 82 24 18 11 1 21 10 7
Toluene C7H8 2.1 dayc 3 3 5 6 401 50 102 6 1 LOD n/a 73
Ethylbenzene C8H10 1.7 dayc 3 3 5 LOD 84 8 21 LOD n/a LOD n/a 56
m+p−Xylene C8H10 12-19 hc,d 3 3 5 LOD 272 29 74 LOD n/a LOD n/a 181
o-Xylene C8H10 20 hc 3 3 5 LOD 127 14 37 LOD n/a LOD n/a 85
n-Propylbenzene C9H12 2.0 dayc 3 3 5 LOD 13 2 4 LOD n/a LOD n/a 9
m-Ethyltoluene C9H12 15 hc 3 3 5 LOD 27 4 9 LOD n/a LOD n/a 18
o-Ethyltoluene C9H12 23 hc 3 3 5 LOD 17 2 5 LOD n/a LOD n/a 11
p-Ethyltoluene C9H12 24 hc 3 3 5 LOD 20 2 6 LOD n/a LOD n/a 13
1,2,3-Trimethylbenzene C9H12 8.5 hc 3 3 5 LOD 40 5 11 LOD n/a LOD n/a 27 1,2,4-Trimethylbenzene C9H12 8.5 hc 3 3 5 LOD 51 6 15 LOD n/a LOD n/a 34
1,3,5-Trimethylbenzene C9H12 4.9 hc 3 3 5 LOD 10 1 3 LOD n/a LOD n/a 7
Monoterpenes
α-Pinene C10H16 5.3 hc 3 3 5 15 217 67 52 20 7 LOD n/a 11
β-Pinene C10H16 3.7 hc 3 3 5 38 610 226 149 84 24 LOD n/a 7
Oxygenated hydrocarbons
Methanol CH3OH 12 dayc 50 30 20 1848 3570 2515 513 1967 354 2276 816 1.8 Ethanol C2H5OH 3.6 dayc 20 30 20 76h 141h 106h 23h 75 12 81 20 1.9h
Acetone C3H6O 15 daye 100 30 20 393 941 644 154 519 71 947 229 1.8
MEK C4H8O 9.5 dayc 5 30 20 20 214 65 49 20 16 57 27 11
MAC C4H6O 9.6 hc 5 30 20 26 266 92 63 35 10 3 4 8
MVK C4H6O 14 hc 5 30 20 42 379 141 109 64 25 16 10 6
MTBE C5H12O 3.9 dayc 1 30 20 LOD n/a LOD n/a LOD n/a LOD n/a n/a
Table 1.Continued.
Oil Sands BKGD FT
Formula Lifetimea LOD Precisionb Accuracy Min Max Avg StD Avg StD Avg StD Max. Compound (pptv) (%) (%) (pptv) (pptv) (pptv) (pptv) (pptv) (pptv) (pptv) (pptv) Enh.
Halocarbons
CFC-11 CCl3F 45 yrf 10 1 3 251 254 253 1 252.7 0.8 248.4 2.4 1.01
CFC-12 CCl2F2 100 yrf 10 1 3 526 538 534 3.2 532.3 1 529.2 3.2 1.01
CFC-113 CCl2FCClF2 85 yrf 5 1 3 77.5 79.5 78.6 0.6 78.1 0.5 78.2 0.7 1.02 CFC-114 CClF2CClF2 300 yrf 1 1 10 16.2 16.8 16.5 0.1 16.4 0.2 16 0.2 1.02 Methyl chloroform CH3CCl3 5.0 yrf 0.1 1 5 12.1 12.6 12.3 0.2 12.2 0.1 12.2 0.1 1.04 Carbon tetrachloride CCl4 26 yrf 1 1 5 91.8 93.4 92.7 0.4 92.3 0.3 91.7 0.9 1.01 Halon-1211 CBrClF2 16 yrf 0.1 1 5 4.09 4.37 4.22 0.1 4.16 0.05 4.23 0.07 1.05 Halon-1301 CBrF3 65 yrf 0.1 10 10 3.0 3.5 3.3 0.15 3.18 0.12 3.12 0.13 1.10 Halon-2402 CBrF2CBrF2 20 yrf 0.01 1 5 0.51 0.54 0.52 0.01 0.51 0.01 0.51 0.01 1.06
HFC-134a CH2FCF3 14 yrf 1 3 10 44 48.9 46.7 1.3 45.3 0.6 46.6 1.6 1.08
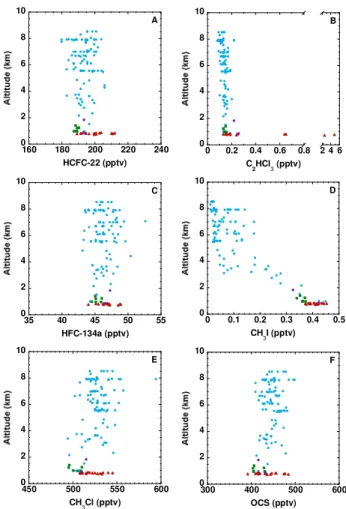
HCFC-22 CHF2Cl 12 yrf 2 5 5 189.2 212.1 200 6.7 188.7 1.1 193.4 5.8 1.12
HCFC-141b CH3CCl2F 9.3 yrf 0.5 3 10 19.9 21.8 21.2 0.4 20.4 0.7 20.8 0.6 1.07 HCFC-142b CH2CClF2 18 yrf 0.5 3 10 18.5 22.1 20.1 1 18.8 0.2 19.5 0.6 1.18
Methyl bromide CH3Br 0.7 yrf 0.5 5 10 7.6 8.3 8 0.2 7.7 0.1 8.3 0.7 1.08
Methyl chloride CH3Cl 1.0 yrf 50 5 10 508 545 522 12 503 6 530 13 1.08
Methyl iodide CH3I 4 d 0.005 5 20 0.37 0.45 0.41 0.02 0.36 0.01 0.06 0.04 1.26 Dibromomethane CH2Br2 3–4 mo 0.01 5 20 0.76 0.94 0.87 0.04 0.91 0.03 0.75 0.05 1.03 Dichloromethane CH2Cl2 3–5 mo 1 5 10 28.4 35.1 31.3 1.8 28.9 0.6 30.9 1.7 1.22
Chloroform CHCl3 3-5 mo 0.1 5 10 10.3 15.6 11.7 1.3 10.8 0.3 10.4 0.6 1.45
Trichloroethene C2HCl3 5 d 0.01 5 10 0.1 4.8 0.6 1.2 0.1 0 0.1 0 33.8
Tetrachloroethene C2Cl4 2–3 mo 0.01 5 10 2.7 5.9 3.2 0.8 2.8 0.1 2.9 0.3 2.12 1,2-Dichloroethane C2H4Cl2 1–2 mo 0.1 5 10 7.4 9.4 8.5 0.6 8.1 0.5 8.9 0.8 1.16 Bromodichloromethane CHBrCl2 2–3 mo 0.01 10 50 0.14 0.17 0.15 0.01 0.15 0.01 0.15 0.01 1.12 Dibromochloromethane CHBr2Cl 2–3 mo 0.01 5 50 0.09 0.13 0.12 0.01 0.13 0.01 0.11 0.02 1.03 Bromoform CHBr3 11 mo 0.01 10 20 0.7 0.91 0.83 0.05 0.9 0.04 0.47 0.31 1.01 Ethyl chloride C2H5Cl 1 mo 0.1 5 30 0.75 2.62 1.42 0.47 1.39 0.68 1.67 0.62 1.89
Sulphur Compounds
Carbonyl sulphide OCS 2.5 yr 10 2 10 392 484 437 26 413 13 445 19 1.17
Dimethyl sulphide CH3SCH3 1–2 d 1 10 20 6 18 10.7 3.9 4.7 0.8 LOD n/a 3.9
aLifetimes of short-lived OH-controlled compounds are shorter (longer) during the summer (winter), when there are more (fewer) hydroxyl radicals (OH) available for oxidative
reactions.
bThe VOC precision deteriorates as we approach our detection limit; at low values the precision is either the stated precision (%) or 3 pptv, whichever is larger. The NO, NO 2, NOy and O3precision values are for high mixing ratios as were encountered over the oil sands; at low mixing ratios their precision is 20 pptv for the nitrogen species and 0.1 ppbv for O3. cBased on OH rate constants from Atkinson and Arey (2003) and assuming a 12-h daytime average OH radical concentration of 2.0×10 molec cm−3. The lifetime estimates for
furan and methylcyclopentane are from Atkinson et al. (2005) and also use a 12-h daytime OH value of 2.0×10 molec cm−3. dThe OH-lifetimes ofm-xylene andp-xylene are 12.0 and 19.4 hours, respectively.
eTotal tropospheric lifetime based on Jacob et al. (2002). fTotal lifetimes based on Clerbaux et al. (2007). gCH
4mixing ratios were not measured during Leg 9, and the background value was determined from the Cold Lake landing (see text). hEthanol data were not available for the first seven samples of Leg 7, and the statistics presented here are based on samples 8–17.
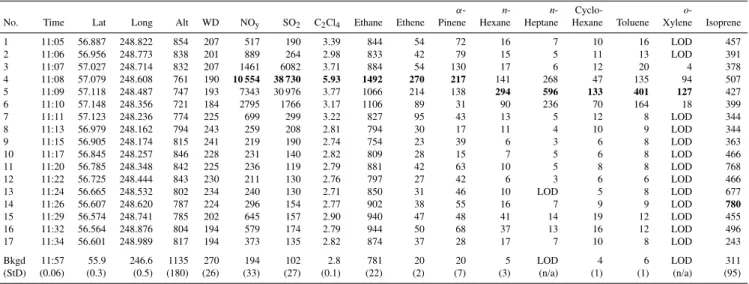
which has a dominant biogenic source, the maximum oc-curred further south over vegetation (i.e., sample 14). Be-cause the Leg 7 samples ranged from near-background air to strongly polluted industrial plumes, the discussion below includes a “maximum enhancement” over the Leg 9 back-ground average, based on each compound’s maximum mix-ing ratio durmix-ing Leg 7. For correlation purposes, the SO2, CO2, CH4, CO, NO, NO2, NOy and O3data are based on the average only of those 1 s measurements (30 s for SO2)
that overlapped the VOC sampling times (i.e., the so-called hydrocarbon data merge). The complete 1 s and 30 s data sets for these eight compounds, together with all the VOC data from the summer phase of ARCTAS, are available at ftp://ftp-air.larc.nasa.gov/pub/ARCTAS/DC8 AIRCRAFT/.
3.1 General features
Table 2.Mixing ratios of selected compounds in 17 whole air samples measured near the Alberta oil sands on 10 July 2008 during Flight Leg 7. Samples 4, 5 and 6 were collected directly downwind of the Syncrude Mildred Lake Facility and showed the strongest enhancements for most compounds. An exception is the biogenic tracer isoprene, which was most enhanced in sample 14. Maximum mixing ratios are shown in bold for each compound. To help distinguish which of the 17 samples collected during Leg 7 resembled background air as the aircraft manoeuvred south of the mining operations, the bottom two rows show the average (standard deviation) values for the background samples collected during Flight Leg 9 (n= 6). Lat = latitude; Long = longitude; Alt = altitude; WD = wind direction; Bkgd = background; StD = standard deviation; n/a = not applicable; LOD denotes values below the detection limit.
α- n- n- Cyclo- o
-No. Time Lat Long Alt WD NOy SO2 C2Cl4 Ethane Ethene Pinene Hexane Heptane Hexane Toluene Xylene Isoprene
1 11:05 56.887 248.822 854 207 517 190 3.39 844 54 72 16 7 10 16 LOD 457
2 11:06 56.956 248.773 838 201 889 264 2.98 833 42 79 15 5 11 13 LOD 391
3 11:07 57.027 248.714 832 207 1461 6082 3.71 884 54 130 17 6 12 20 4 378
4 11:08 57.079 248.608 761 190 10 554 38 730 5.93 1492 270 217 141 268 47 135 94 507 5 11:09 57.118 248.487 747 193 7343 30 976 3.77 1066 214 138 294 596 133 401 127 427 6 11:10 57.148 248.356 721 184 2795 1766 3.17 1106 89 31 90 236 70 164 18 399
7 11:11 57.123 248.236 774 225 699 299 3.22 827 95 43 13 5 12 8 LOD 344
8 11:13 56.979 248.162 794 243 259 208 2.81 794 30 17 11 4 10 9 LOD 344
9 11:15 56.905 248.174 815 241 219 190 2.74 754 23 39 6 3 6 8 LOD 363
10 11:17 56.845 248.257 846 228 231 140 2.82 809 28 15 7 5 6 8 LOD 466
11 11:20 56.785 248.348 842 225 236 119 2.79 881 42 63 10 5 8 8 LOD 768
12 11:22 56.725 248.444 843 230 211 130 2.76 797 27 42 6 3 6 6 LOD 466
13 11:24 56.665 248.532 802 234 240 130 2.71 850 31 46 10 LOD 5 8 LOD 677
14 11:26 56.607 248.620 787 224 296 154 2.77 902 38 55 16 7 9 9 LOD 780
15 11:29 56.574 248.741 785 202 645 157 2.90 940 47 48 41 14 19 12 LOD 455
16 11:32 56.564 248.876 804 194 579 174 2.79 944 50 68 37 13 16 12 LOD 496
17 11:34 56.601 248.989 817 194 373 135 2.82 874 37 28 17 7 10 8 LOD 243
Bkgd 11:57 55.9 246.6 1135 270 194 102 2.8 781 20 20 5 LOD 4 6 LOD 311
(StD) (0.06) (0.3) (0.5) (180) (26) (33) (27) (0.1) (22) (2) (7) (3) (n/a) (1) (1) (n/a) (95)
easily the largest, includes SO2, NO, NO2, NOy, CO2, CH4, CO and 70% of the measured VOCs, namely alka-nes, aromatics, cycloalkaalka-nes, alkealka-nes, oxygenated hydrocar-bons, ethyne, short-lived solvents (C2Cl4, C2HCl3, CHCl3, CH2Cl2) and some HCFCs (HCFC-22 and HCFC-142b) (Sects. 3.2, 3.3.3 and 3.4–3.6). The maximum enhancements were 1.1–397×the background BL values, most notablyn -heptane (397×), SO2(382×), NO (319×),n-octane (242×), NO2(210×),m+p-xylene (181×)and methylcyclohexane (113×). Interestingly this group comprisesα-pinene andβ -pinene, which are usually associated with biogenic emissions (Sect. 3.2.3). In the second group, halocarbons including HFC-134a, HCFC-141b, the halons and the methyl halides were minimally enhanced over the oil sands (Sect. 3.3.2). In the third group, long-lived industrial halocarbons (e.g., CFCs, CCl4, CH3CCl3), several brominated species (e.g., CHBr3, CH2Br2) and ozone (O3) were not enhanced over the oil sands (Sects. 3.3.1 and 3.5). In fact O3was relatively depleted because of titration by high levels of NO.
Before discussing the results below, it is important to first recognize the limitations of this data set. Because of its short time-frame (17 min) and sample size (n=17), the represen-tativeness of the measured VOC enhancements is unclear. On the other hand, because emissions from oil sands mining are so poorly characterized in the peer-reviewed literature due to the inaccessibility of mining sites to independent observers, this study provides important close-range observations of the VOCs that are being released, i.e., which individual species
are emitted and with what other species do they correlate. The large number of compounds and relatively small number of samples in this data set make it unsuitable for emission estimates or factor analysis such as Principal Component Analysis or Positive Matrix Factorization (e.g., Thurston and Spengler, 1985; Paatero, 1997; Choi et al., 2003), and we have instead performed linear correlations among the mea-sured compounds using least squares fits to better understand their source influences.
3.2 Non-methane volatile organic compounds (NMVOCs)
⁰ ―0‖ 200 300 400 500 600 0 2 4 6 8 10
CFC-11 CFC-12 A
0 4 8 12 16 0 2 4 6 8 10 CHCl
3 C2Cl4 B
1 10 100 1000 104 105 0 2 4 6 8 10 D SO 2 0 30 60 90 120 150 0 2 4 6 8 10
Benzene Cyclohexane E
0 100 200 300 400 500 0 2 4 6 8 10 Toluene Methylcyclohexane F
0 30 60 90 120 150 0 2 4 6 8 10
7 8 9 10 11 12 13
Local time
Propene 1-Butene G
0 200 400 600 800 0 2 4 6 8 10
7 8 9 10 11 12 13
Local time H Isoprene 0 200 400 600 0 2 4 6 8 10
n-Pentane n-Heptane C
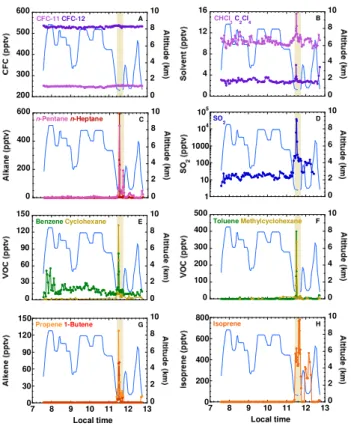
Fig. 4. Time series of selected trace gases measured during ARC-TAS Flight 23 on 10 July 2008. The solid blue line traces altitude. The boundary layer run over oil sands mining operations (Leg 7, shaded) is followed by a second boundary run (Leg 9) in cleaner air 1◦further south. Values below detection limit have been given a value of “0” for plotting purposes. Note that the mixing ratios of
n-heptane, the cycloalkanes, the butenes and isoprene were below their detection limits for most of the flight.
that support the mining effort, such as upgrading (elevated levels of C2–C4alkanes, C2–C4alkenes, C9aromatics). The major upgrading processes at this location are distillation (to separate different hydrocarbons), thermal conversion/coking (to convert the bitumen into lighter, refinable hydrocarbons), catalytic conversion (an enhanced form of thermal conver-sion), and hydrotreating (the addition of hydrogen to unsatu-rated molecules to stabilize them). For example the catalytic hydrocracking of Athabasca bitumen vacuum bottoms (AB-VBs) produces gaseous by-products including hydrogen sul-phide (H2S), C1–C7 alkanes and, to a lesser extent, C2–C4 alkenes (Dehkissia et al., 2004).
3.2.1 Alkanes, cycloalkanes and aromatics
Because of increasing reactivity with the hydroxyl radical (OH) with increasing chain length, the average (±1σ) n -alkane mixing ratios decreased with increasing chain length in the background BL (Leg 9), from ethane (781±22 pptv) to propane (200±26 pptv) ton-butane (63±19 pptv), etc. (Table 1). The≥C7n-alkanes are so short-lived (<2 days)
0 2 4 6 8 10
400 800 1200 1600
Ethane (pptv) A 0 2 4 6 8 10
0 200 400 600 800
Propane (pptv) B 0 2 4 6 8 10
0 100 200 300 500 1000
n-Butane (pptv) C 0 2 4 6 8 10
0 30 60 90 120 300 600
i-Pentane (pptv) D 0 2 4 6 8 10
0 20 40 60 100 200 300 400
n-Hexane (pptv) E 0 2 4 6 8 10
0 10 20 100 200 300 400
n-Octane (pptv) F
Fig. 5.Vertical profiles of selected alkanes measured during Flight 23 on 10 July 2008. Red triangles: oil sands boundary layer run (Leg 7); green squares: background boundary layer run (Leg 9); purple diamonds: Cold Lake landing; blue circles: remainder of Flight 23. Note that the mixing ratios ofn-hexane andn-octane were below their detection limits for most of the flight.
primary ethane and propane sources are fossil fuel produc-tion (mainly unburned gas in the case of ethane) and biofuel and biomass burning, plus propane is also emitted in gaso-line exhaust (e.g., Watson et al., 2001; Buzcu and Fraser, 2006; Xiao et al., 2008). Ethane and propane correlated well with a range of industrial and combustion species such as other light alkanes, alkenes, NO, NO2, NOyand ethyne (Ta-ble 3). By contrast, even though ethane is the second most abundant component of natural gas after CH4 (Xiao et al., 2008; McTaggart-Cowan et al., 2010), it did not correlate well with CH4(r2=0.52). This relatively poor correlation is surprising given the heavy use of natural gas during bitumen extraction (Sect. 1) and appears to indicate low natural gas leakage levels (see Sect. 3.6). Because ethane and propane are primarily associated with evaporative rather than com-bustive fossil fuel emissions, we expect a co-located evapo-rative source from the industries that process the oil sands, possibly from fuel gas and/or hydrocracking.
The butanes are associated with fossil fuel evaporation (e.g., liquefied petroleum gas or LPG) and biomass burning (Blake et al., 1996; Watson et al., 2001; Buzcu and Fraser, 2006). Thei-butane (290 pptv) andn-butane (765 pptv) max-ima in the oil sands plumes were 10–12×greater than in the background BL (Table 1; Fig. 5c) and were compara-ble to maximum levels measured in fresh biomass burning plumes during ARCTAS (not shown). They were also sim-ilar to the lower range of values measured in the 28 US city study (Baker et al., 2008), and they were much greater than average July values measured in rural New England (70±39 pptv and 105±59 pptv, respectively; Russo et al., 2010), even though there is widespread LPG leakage in the northeastern United States (White et al., 2008; Russo et al., 2010). The ratio of i-butane/n-butane varies according to source, for example 0.2–0.3 for vehicular exhaust, 0.46 for LPG, and 0.6–1.0 for natural gas (Russo et al., 2010 and ref-erences therein). Interestingly, the i-butane/n-butane ratio for the dominant oil sands plumes, i.e., samples 4, 5 and 6 (0.42±0.03 pptv pptv−1)was very close to that expected for LPG. We have not been able to determine that LPG is used in the mining operations, and this signal could potentially rep-resent emissions from hydrocrackers and/or the fuel gas that is produced and used at the major oil sands operations. Even though they only contain 4 carbon atoms, the butanes corre-lated better with the suite of heavier compounds that is asso-ciated with direct emissions from the oil sands and/or dilu-ent (e.g.,n-hexane, xylenes, cyclopentane; 0.93≤r2≤0.96) than with species linked to industrial activities associated with the mining operations (e.g., propane, CHCl3, ethene, ethyne, NO, NOy; 0.77≤r2≤0.84) (Table 3). Because the butanes are not generally associated with combustive fossil fuel emissions, these results indicate multiple evaporative bu-tane sources at the mining sites.
Crude oil is composed of ≥C5 alkanes, aromatics, cy-cloalkanes and asphaltics (Sect. 1), and even though the oil sands are extra-heavy and include molecules with 50 or more
carbon atoms, they are still expected to contain a certain fraction of volatiles that would be captured by our measure-ments (D. Spink, personal communication, 2010). The C5– C9n-alkanes showed very strong enhancements, with higher values over the oil sands than at any other time during the summer phase of ARCTAS. It is noteworthy that the maxi-mum abundances were not ordered according to chain length.
n-Heptane (596 pptv) showed the highest maximum mix-ing ratio, followed by the pentanes (510–560 pptv),n-octane (363 pptv) andn-hexane (294 pptv) (Table 1; Figs. 4c, 5d– f). These values represent enhancements of 24–397× the background BL values (in the enhancement calculations a background value of 1.5 pptv was assumed for BL measure-ments that were below our detection limit of 3 pptv). Oil having a plant origin is known to show a predominance for
n-alkanes with an odd chain number, in contrast ton-alkanes that are produced from marine organic matter (Rogers and Koons, 1971). Because oil sands are derived from marine phytoplankton, the relative abundance of pentanes and n -heptane may suggest a stronger signal from the diluent than from the oil sands, assuming the diluent is made from con-ventional plant-based oil. Branched alkanes such as 2,3-dimethylbutane and the methylpentanes (which we present as a single measurement, i.e., 2+3-methylpentane) were also enhanced by factors of 19–34 over the local background (Ta-ble 1).
The cycloalkanes were close to or below our 3 pptv detec-tion limit during Leg 9, as they had been in the FT during the transit from Thule. By contrast, all the cycloalkanes were strongly enhanced over the oil sands, with maximum mix-ing ratios rangmix-ing from 41 pptv (cyclopentane) to 339 pptv (methylcyclohexane) (Table 1; Figs. 4e, 6a). Cycloalkanes are a major component of crude oil (Sect. 1), and these re-sults are consistent with their evaporative release from oil sands surface mining operations.
Aromatics are associated with combustion (fossil fuel and biomass burning), fuel evaporation, industry, and biogenic emissions (e.g., Karl et al., 2009a; White et al., 2009). With the exception of the longest-lived aromatics that we mea-sured – i.e., benzene (1–2 weeks) and toluene (2–3 days) – none of the aromatics were detectable in either the FT or in background BL air, whereas they were all strongly elevated over the oil sands with maximum enhancements of 7–181×
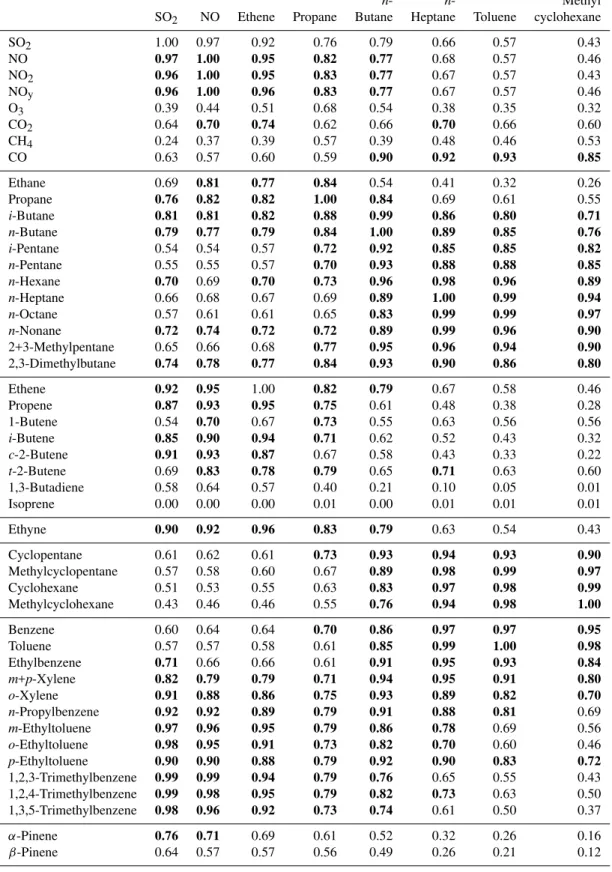
Table 3. Correlation matrix for selected VOC species measured over oil sands mining operations in Alberta on July 10, 2008 (n=17). Correlations≥0.7 are highlighted in bold. With the exception of CHCl3and C2Cl4, all the halocarbons showed 0.00≤r2≤0.43 with the
selected species and are not included.
n- n- Methyl
SO2 NO Ethene Propane Butane Heptane Toluene cyclohexane
SO2 1.00 0.97 0.92 0.76 0.79 0.66 0.57 0.43
NO 0.97 1.00 0.95 0.82 0.77 0.68 0.57 0.46
NO2 0.96 1.00 0.95 0.83 0.77 0.67 0.57 0.43
NOy 0.96 1.00 0.96 0.83 0.77 0.67 0.57 0.46
O3 0.39 0.44 0.51 0.68 0.54 0.38 0.35 0.32
CO2 0.64 0.70 0.74 0.62 0.66 0.70 0.66 0.60
CH4 0.24 0.37 0.39 0.57 0.39 0.48 0.46 0.53
CO 0.63 0.57 0.60 0.59 0.90 0.92 0.93 0.85
Ethane 0.69 0.81 0.77 0.84 0.54 0.41 0.32 0.26
Propane 0.76 0.82 0.82 1.00 0.84 0.69 0.61 0.55
i-Butane 0.81 0.81 0.82 0.88 0.99 0.86 0.80 0.71
n-Butane 0.79 0.77 0.79 0.84 1.00 0.89 0.85 0.76
i-Pentane 0.54 0.54 0.57 0.72 0.92 0.85 0.85 0.82
n-Pentane 0.55 0.55 0.57 0.70 0.93 0.88 0.88 0.85
n-Hexane 0.70 0.69 0.70 0.73 0.96 0.98 0.96 0.89
n-Heptane 0.66 0.68 0.67 0.69 0.89 1.00 0.99 0.94
n-Octane 0.57 0.61 0.61 0.65 0.83 0.99 0.99 0.97
n-Nonane 0.72 0.74 0.72 0.72 0.89 0.99 0.96 0.90
2+3-Methylpentane 0.65 0.66 0.68 0.77 0.95 0.96 0.94 0.90
2,3-Dimethylbutane 0.74 0.78 0.77 0.84 0.93 0.90 0.86 0.80
Ethene 0.92 0.95 1.00 0.82 0.79 0.67 0.58 0.46
Propene 0.87 0.93 0.95 0.75 0.61 0.48 0.38 0.28
1-Butene 0.54 0.70 0.67 0.73 0.55 0.63 0.56 0.56
i-Butene 0.85 0.90 0.94 0.71 0.62 0.52 0.43 0.32
c-2-Butene 0.91 0.93 0.87 0.67 0.58 0.43 0.33 0.22
t-2-Butene 0.69 0.83 0.78 0.79 0.65 0.71 0.63 0.60
1,3-Butadiene 0.58 0.64 0.57 0.40 0.21 0.10 0.05 0.01
Isoprene 0.00 0.00 0.00 0.01 0.00 0.01 0.01 0.01
Ethyne 0.90 0.92 0.96 0.83 0.79 0.63 0.54 0.43
Cyclopentane 0.61 0.62 0.61 0.73 0.93 0.94 0.93 0.90
Methylcyclopentane 0.57 0.58 0.60 0.67 0.89 0.98 0.99 0.97
Cyclohexane 0.51 0.53 0.55 0.63 0.83 0.97 0.98 0.99
Methylcyclohexane 0.43 0.46 0.46 0.55 0.76 0.94 0.98 1.00
Benzene 0.60 0.64 0.64 0.70 0.86 0.97 0.97 0.95
Toluene 0.57 0.57 0.58 0.61 0.85 0.99 1.00 0.98
Ethylbenzene 0.71 0.66 0.66 0.61 0.91 0.95 0.93 0.84
m+p-Xylene 0.82 0.79 0.79 0.71 0.94 0.95 0.91 0.80
o-Xylene 0.91 0.88 0.86 0.75 0.93 0.89 0.82 0.70
n-Propylbenzene 0.92 0.92 0.89 0.79 0.91 0.88 0.81 0.69
m-Ethyltoluene 0.97 0.96 0.95 0.79 0.86 0.78 0.69 0.56
o-Ethyltoluene 0.98 0.95 0.91 0.73 0.82 0.70 0.60 0.46
p-Ethyltoluene 0.90 0.90 0.88 0.79 0.92 0.90 0.83 0.72
1,2,3-Trimethylbenzene 0.99 0.99 0.94 0.79 0.76 0.65 0.55 0.43
1,2,4-Trimethylbenzene 0.99 0.98 0.95 0.79 0.82 0.73 0.63 0.50
1,3,5-Trimethylbenzene 0.98 0.96 0.92 0.73 0.74 0.61 0.50 0.37
α-Pinene 0.76 0.71 0.69 0.61 0.52 0.32 0.26 0.16
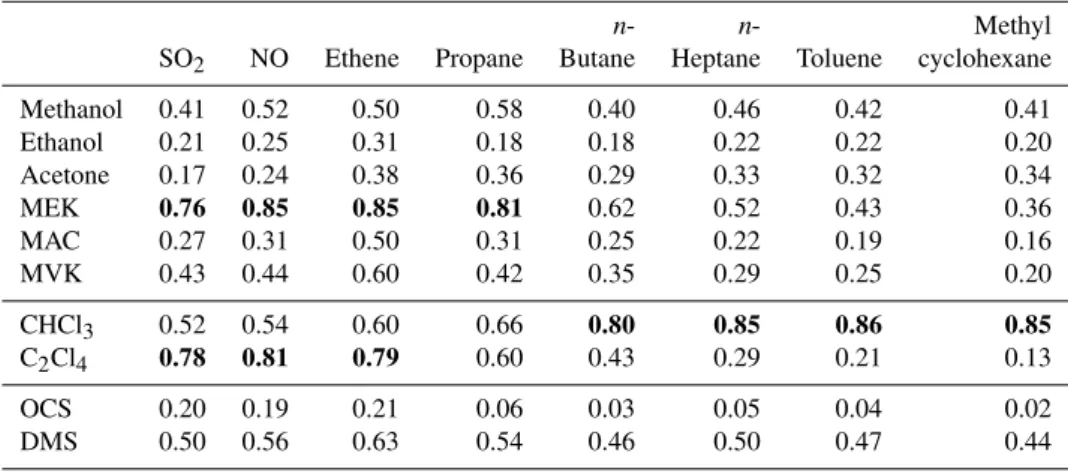
Table 3.Continued.
n- n- Methyl
SO2 NO Ethene Propane Butane Heptane Toluene cyclohexane
Methanol 0.41 0.52 0.50 0.58 0.40 0.46 0.42 0.41
Ethanol 0.21 0.25 0.31 0.18 0.18 0.22 0.22 0.20
Acetone 0.17 0.24 0.38 0.36 0.29 0.33 0.32 0.34
MEK 0.76 0.85 0.85 0.81 0.62 0.52 0.43 0.36
MAC 0.27 0.31 0.50 0.31 0.25 0.22 0.19 0.16
MVK 0.43 0.44 0.60 0.42 0.35 0.29 0.25 0.20
CHCl3 0.52 0.54 0.60 0.66 0.80 0.85 0.86 0.85
C2Cl4 0.78 0.81 0.79 0.60 0.43 0.29 0.21 0.13
OCS 0.20 0.19 0.21 0.06 0.03 0.05 0.04 0.02
DMS 0.50 0.56 0.63 0.54 0.46 0.50 0.47 0.44
With the exception of the C9aromatics, the≥C5alkanes, cycloalkanes and aromatics showed excellent mutual corre-lations (Table 3). Interestingly, the best correcorre-lations were not limited to compounds within the same class but were mixed among the compound classes. For example,n-heptane, the most strongly enhanced VOC, showed top 10 correlations with n-nonane, n-octane, toluene, methylcyclopentane, n -hexane, benzene, cyclo-hexane, 2,3-methylpentane, m+p -xylene, and ethylbenzene (0.95≤r2≤0.99). These results show the fugitive co-emissions of a wide range of C5–C9 VOCs from oil sands surface mining sites in Alberta, e.g. from oil sands and/or diluent. By contrast, the C9aromatics (i.e., ethyltoluenes, trimethylbenzenes) correlated best with each other and with combustion and industrial tracers such as NO, NO2, NOy, ethene, propene andcis-2-butene, sug-gesting their release from industries at the mining sites as opposed to direct evaporative release from the oil sands or diluent.
3.2.2 Alkenes and alkynes
Because they are primarily biogenic tracers, isoprene and the monoterpenes are considered separately below (Sect. 3.2.3). The 7 C2–C4 alkenes considered here are highly reac-tive, short-lived compounds that are primarily associated with industrial emissions and incomplete combustion (e.g., Sprengnether et al., 2002; Buzcu and Fraser, 2006; de Gouw et al., 2009). Whereas only ethene was detectable in the background BL during Flight 23 (20±2 pptv), all of the alkenes were strongly enhanced over the oil sands by factors of up to 5–85 (Table 1; Figs. 4g, 6e). The maximum mix-ing ratio decreased with increasmix-ing chain length, from ethene (270 pptv) to propene (128 pptv) toi-butene (37 pptv), etc. Although these oil sands values are much greater than the rural background, they are smaller for example than in fresh biomass burning plumes encountered during ARCTAS (e.g., ethene up to 18 690 pptv, propene up to 5465 pptv). They are
also in the low range of summertime values in US cities (e.g., 260–2430 pptv ethene; 68–500 pptv propene; 33–1550 pptv
i-butene; Baker et al., 2008). In the Houston area – where the greatest concentration of petrochemical facilities in the US is located and ethene and propene play a major role in rapid O3 formation (Ryerson et al., 2003) – average respective ethene and propene mixing ratios of 2690 pptv and 1540 pptv were measured in the summer of 2006 (Gilman et al., 2009), and poor correlation between ethene and CO suggested the dom-inance of industrial point sources (de Gouw et al., 2009). Over the oil sands, ethene showed excellent correlation with the combustion tracer ethyne (r2=0.96), some correlation with CO (r2=0.60), and good correlation with the indus-trial tracer C2Cl4(r2=0.79) (Table 3), suggesting the mixed influence of industrial and combustion sources on ethene and other alkenes at the oil sands mining sites.
Propyne was not detectable in any of the samples that we collected during Flight 23. Ethyne – a tracer of incomplete combustion by biomass burning and urban fossil fuel (e.g., Blake et al., 2003; Warneke et al., 2007) – correlated most strongly with ethene, NOy, NO and the trimethylbenzenes (0.91≤r2≤0.96) and showed a maximum mixing ratio of 138 pptv over the oil sands, compared to 59±5 pptv in the local background (Table 1; Fig. 6f). As with the alkenes, this enhancement is small compared to average levels measured in Houston (473 pptv; Gilman et al. 2009) and in the 28 US city study (260–2390 pptv; Baker et al., 2008), indicating the relatively low impact of industrial combustion on the mea-sured ethyne levels.
3.2.3 Isoprene and monoterpenes
0 2 4 6 8 10
0 200 400 600 800
Ethyne (pptv) F
0 2 4 6 8 10
0 20 40 60 80 100 200 300
Ethene (pptv) E
0 2 4 6 8 10
0 2 4 6 8 20 30 40 50
1,2,3-Trimethylbenzene (pptv) D
0 2 4 6 8 10
0 10 20 80 100 120 140
o-Xylene (pptv) C
0 2 4 6 8 10
0 2 4 6 25 26 27 28
m-Ethyltoluene (pptv) B
0 2 4 6 8 10
0 30 60 90 170 180 190
Methylcyclopentane (pptv) A
Fig. 6.As in Fig. 5 but for methylcyclopentane, selected aromatics, ethene and ethyne. Note that the mixing ratios ofm-ethyltoluene,o -xylene and 1,2,3-trimethylbenzene were below their detection limits for most of the flight.
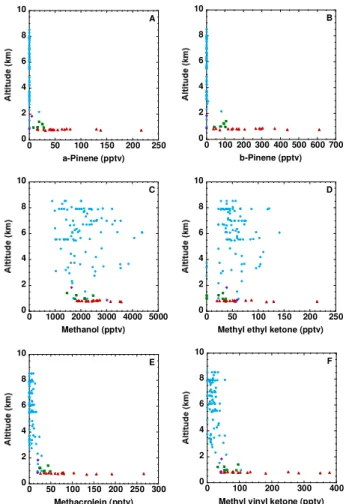
et al., 2006). For example in the 28 US city study the low-est average isoprene mixing ratio was measured in El Paso, Texas (47±75 pptv) and the highest in Providence, Rhode Island (2590±1610 pptv) (Baker et al., 2008). In our study, isoprene mixing ratios exceeded 200 pptv in all 17 air sam-ples collected over the oil sands as well as in the background BL air. Interestingly, the average isoprene mixing ratio was 50% greater during Leg 7 (468±147 pptv) than in the local background air (311±95 pptv), with a maximum value of 780 pptv (Tables 1 and 2; Fig. 4h). Anthropogenic sources of isoprene include traffic (e.g., Reimann et al., 2000; Borbon et al., 2001; Barletta et al., 2002) and industry (e.g., Ras et al., 2009). However the isoprene maximum was measured in sample 14, south of the main surface mining operations (Fig. 2b). Isoprene was poorly correlated with all of the trace gases that we measured (r2<0.37) and its enhancements ap-pear to be biogenic rather than industrial in origin. We be-lieve that the stronger isoprene enhancements during Leg 7 than Leg 9 most likely reflect natural source strength vari-ability rather than an altitude effect. Isoprene is highly
reac-α β
0 2 4 6 8 10
0 50 100 150 200 250
a-Pinene (pptv) A
0 2 4 6 8 10
0 100 200 300 400 500 600 700 b-Pinene (pptv)
B
0 2 4 6 8 10
0 1000 2000 3000 4000 5000
Methanol (pptv) C
0 2 4 6 8 10
0 50 100 150 200 250
Methyl ethyl ketone (pptv) D
0 2 4 6 8 10
0 50 100 150 200 250 300
Methacrolein (pptv) E
0 2 4 6 8 10
0 100 200 300 400
Methyl vinyl ketone (pptv) F
Fig. 7. As in Fig. 5 but for the pinenes and selected oxygenated hydrocarbons. Note that the mixing ratios ofα-pinene andβ-pinene were below their detection limits for most of the flight.
tive with OH and it is the shortest-lived species that we mea-sure (Table 1). Although the Leg 7 samples were collected at a lower average altitude (804±38 m) than the background BL measurements (1135±180 m) (Sect. 2) – and in princi-ple more isoprene oxidation by OH could have occurred dur-ing transport to higher altitudes durdur-ing Leg 9 – the individual measurements did not show a clear declining trend with al-titude. Instead we expect that samples with higher isoprene levels represent parts of Leg 7 that were downwind of more, or more recent, isoprene emissions. For example aspen are a major isoprene emitter (Sharkey et al., 2008) and the forests in the Fort McMurray area include a mix of trembling aspen and white spruce.
610 pptv, respectively) were much greater (7–11×)than their respective average values in the background BL air (20±7 and 84±24 pptv; Table 1, Fig. 7a–b). At first glance this appears to be consistent with a number of studies that have shown increased emissions of monoterpenes and other VOCs in response to various plant stress factors (Schade and Gold-stein, 2003; R¨ais¨anen et al., 2008; Holopainen and Gershen-zon, 2010; Niinemets, 2010). For example, monoterpene mixing ratios and emissions from a California ponderosa pine forest showed a 10–30 fold increase during and after major forest thinning, with measured mixing ratios exceed-ing 3000 pptv (Schade and Goldstein, 2003). However, un-like isoprene, the pinenes were most strongly enhanced in sample 4, downwind of the Syncrude Mildred Lake Facility (Table 2; Fig. 2b), and they showed strong correlations with many species that were elevated in the oil sands plumes. For exampleα-pinene correlated best withβ-pinene (r2=0.92) and industrial compounds such as C2Cl4 (r2=0.81), SO2 (r2=0.76), 1,2,3-TMB (r2=0.74),i-butene (r2=0.73)and ethyne (r2=0.73). The land surrounding the upgraders is al-ready disturbed and we do not expect the industrial upgrader plumes to have had the opportunity to mix with plumes rep-resenting damaged vegetation. Instead these unexpected ob-servations lead us to infer that there could be a source of pinenes associated with the oil sands mining industry, which requires further investigation.
3.2.4 Oxygenated hydrocarbons
During ARCTAS UC-Irvine measured methanol (CH3OH), ethanol (C2H5OH), acetone (C3H6O), methyl ethyl ke-tone (MEK, C4H8O), methacrolein (MAC, C4H6O), methyl vinyl ketone (MVK, C4H6O), MTBE (C5H12O), and furan (C4H4O). The sources of oxygenated hydrocarbons are both natural and anthropogenic and include vegetation, biomass burning, atmospheric production, the oceans and industry (e.g., Horowitz et al., 2003; Jacob et al., 2005; Folberth et al., 2006; Jordan et al., 2009).
Methanol has a major biogenic source and minor sources including biomass burning and anthropogenic emissions (e.g., vehicles, solvent use and manufacturing; Jacob et al., 2005 and references therein). Its maximum mixing ratio (3570 pptv) was measured downwind of the oil sands opera-tions in sample 6, which was enhanced by a factor of 1.8 over the local background average (Table 1; Fig. 7c). Methanol correlated best with MEK and the butenes (0.71≤r2≤0.75) suggesting its industrial release from the oil sands facilities. However the oil sands industry appears to be a relatively minor methanol source. For example, the mixing ratios in the oil sands plumes were comparable to those measured at higher altitudes and latitudes during earlier portions of Flight 23, and they were an order of magnitude smaller than max-imum methanol values that were measured in fresh biomass burning plumes during ARCTAS (32 740 pptv).
In addition to being produced by plants and used as a sol-vent and chemical feedstock, ethanol is increasingly being used as a motor fuel and fuel additive (e.g., Kesselmeier and Staudt, 1999; Russo et al., 2010). The maximum ethanol mixing ratio during Leg 7 (141 pptv) was 1.9× the back-ground average, and ethanol correlated best with CH3CCl3 and the halons (0.65≤r2≤0.83). However, unlike the other gases that we measured, ethanol data were not available for the first seven samples of Leg 7 and therefore we are unable to fully characterize its emissions from the oil sands industry. Acetone is produced by vegetation, the oceans and the atmospheric oxidation of C3–C5 isoalkanes, especially propane (Jacob et al., 2002). It is used industrially as a sol-vent and polymer precursor and has been observed in abun-dance downwind of petrochemical complexes (Cetin et al., 2003). The maximum acetone mixing ratio over the oil sands (941 pptv) was 1.8× its local background average. Like methanol, the acetone levels over the oil sands were com-parable to other times during the flight and were smaller than maximum values measured in fresh biomass burning plumes during ARCTAS (4552 pptv). Acetone correlated best with MAC, 1,2-dichloroethane and CH2Cl2 (0.64≤r2≤0.69) suggesting that it is emitted by the oil sands industry but in smaller amounts than other regional sources such as biomass burning.
Methyl ethyl ketone is produced industrially and used as a solvent, and it is known for its characteristic sweet odour (Kabir and Kim, 2010). The maximum MEK mixing ratio over the oil sands (214 pptv) occurred in sample 4 and was 11×greater than the local background average. However most of the MEK enhancements over the oil sands were com-parable to those measured at other times during the flight (Fig. 7d). Methyl ethyl ketone showed strong correlations (r2>0.8) with a dozen industrial and combustion tracers in-cluding C2–C4alkenes, C2Cl4, NO and 1,2,3-TMB, showing its release from the oil sands industry in what appear to be relatively minor quantities.
therein), the observed MAC and MVK values during Leg 7 (92±63 and 141±109 pptv, respectively) appear to be within the range that can be explained by isoprene chemistry. Methyltert-butyl ether is a solvent and gasoline additive, and furan is an intermediate in the synthesis of industrial chemicals. The mixing ratio of MTBE remained below its detection limit of 3 pptv throughout Flight 23, showing that it is not being released by the oil sands industry. This is consis-tent with its declining use in North America because of con-cerns over groundwater contamination (e.g., Backer, 2010; Lu and Rice, 2010). Like MTBE, furan also remained below its 3 pptv detection limit throughout the flight, in contrast to a maximum mixing ratio of 2344 pptv in very fresh biomass burning plumes that were sampled during ARCTAS. 3.3 Halocarbons
Long-lived halocarbons (e.g., CFCs, HCFCs) contribute to stratospheric ozone depletion, and short-lived halocarbons (e.g., CHCl3, C2Cl4)can be toxic or carcinogenic. Of the 26 C1–C2halocarbons that we measured, 6 showed both strong enhancements (≥10%) over the local background average and larger mixing ratios over the oil sands than at any other time during the Flight, 9 showed minimal enhancements over the local background average, and 11 were not statistically enhanced over the oil sands.
3.3.1 Strongly enhanced halocarbons
The first group includes the CFC-substitutes HCFC-22 and HCFC-142b, and the relatively short-lived (2–5 mo) industrial solvents chloroform (CHCl3), trichloroethene (C2HCl3), tetrachloroethene (C2Cl4) and dichloromethane (CH2Cl2). HCFC-22 and HCFC-142b are long-lived re-frigerants, foam-blowing agents and solvents whose atmo-spheric concentrations are rapidly increasing (O’Doherty et al., 2004; Derwent et al., 2007; Montzka et al., 2009). Their mixing ratios over the oil sands were greater than at any other time during the flight, with maximum values of 212 pptv HCFC-22 and 22 pptv HCFC-142b – or respective enhance-ments of 12% and 18% over the average background (Ta-ble 1; Fig. 8a) – showing their usage and release at the min-ing sites.
The short-lived solvents CHCl3, C2HCl3, C2Cl4 and CH2Cl2 also showed stronger enhancements over the oil sands than during any other portion of the flight (Figs. 4b, 8b). In fact, the maximum C2HCl3 and C2Cl4 levels (4.8 pptv and 5.9 pptv, respectively; Table 1) were higher in the oil sands plumes than at any other time during the sum-mer phase of ARCTAS. For perspective, these plume val-ues are smaller than average levels measured in urban cen-ters such as Hong Kong, where C2HCl3 and C2Cl4 mix-ing ratios of 70±31 and 29±9 pptv were measured dur-ing autumn 2007 (Zhang et al., 2010). Maximum respec-tive CH2Cl2 and CHCl3 mixing ratios were 35.1 pptv and
0 2 4 6 8 10
160 180 200 220 240
HCFC-22 (pptv) A
0 2 4 6 8 10
0 0.2 0.4 0.6 0.8 2 4 6
C 2HCl3(pptv)
B
0 2 4 6 8 10
35 40 45 50 55
HFC-134a (pptv) C
0 2 4 6 8 10
0 0.1 0.2 0.3 0.4 0.5
CH 3I (pptv)
D
0 2 4 6 8 10
450 500 550 600
CH3Cl(pptv) E
0 2 4 6 8 10
300 400 500 600
OCS (pptv) F
Fig. 8.As in Fig. 5 but for selected halocarbons and OCS.
15.6 pptv, or 22% and 45% greater than the background aver-age. Dichloromethane, C2Cl4, and to a lesser extent CHCl3, were also enhanced relative to background mixing ratios dur-ing the descent into Cold Lake, showdur-ing their use as solvents in local urban areas as well as by the mining industry. 3.3.2 Minimally enhanced halocarbons
The second group of compounds, which were minimally en-hanced over the oil sands, includes 1,1,1,2-tetrafluoroethane (HFC-134a), some chlorinated species (1,2-dichloroethane, HCFC-141b), the halons (H-1211, H-1301, H-2402) and the methyl halides (CH3Br, CH3I, CH3Cl).
the background BL average but within the range of mixing ratios measured at other times during the flight, also suggest-ing relatively small emissions by the oil sands industry (Ta-ble 1). Likewise, the CFC replacement compound HCFC-141b showed fairly small (<7%) enhancements over the oil sands (Table 1). The halons are ozone-depleting substances that are still used in North America because of their critical role as fire extinguishing agents (Butler et al., 1998; Fraser et al., 1999; Montzka et al., 2003). Maximum H-1211, H-1301 and H-2402 levels over the oil sands were 5–10% greater than the local background average (Table 1), compared to av-erage H-1211 enhancements of 75% in cities in China (Bar-letta et al., 2006) where 90% of global H-1211 production occurs (Fraser et al., 1999). Therefore the halon enhance-ments over the oil sands also appear to be relatively minor, though we note that the H-1301 maximum over the oil sands was greater than at any other time during the summer phase of ARCTAS.
Methyl bromide, an ozone-depleting substance with natu-ral and anthropogenic sources (e.g., oceans, salt marshes, fu-migation and biomass burning; Yvon-Lewis et al., 2009 and references therein), had a maximum mixing ratio of 8.3 pptv both over the oil sands and upon final descent into Cold Lake. This 8% enhancement over the local background average was small compared to CH3Br mixing ratios of up to 15 pptv in fresh biomass burning plumes that were sampled during ARCTAS, suggesting a minor impact of the oil sands indus-try on CH3Br levels in the sampled plumes.
Methyl iodide is a very short-lived species (1–2 d) with a major oceanic source (Yokouchi et al., 2008) and minor terrestrial sources (e.g., Redeker et al., 2003; Sive et al., 2007). Its mixing ratio declined sharply with altitude, consis-tent with its short atmospheric lifetime (Fig. 8d). In fact, the shape of the profile and the magnitude of the mixing ratios were remarkably similar to those measured elsewhere over North America during the Intercontinental Chemical Trans-port Experiment–North America (INTEX-NA) campaign in July and August, 2004 (Sive et al., 2007). In addition, the mixing ratios of CH3I during Legs 7 and 9 (<0.45 pptv) were at the low end of global background values (0.5–2 pptv; Yok-ouchi et al., 2008 and references therein) and CH3I did not correlate with other species over the oil sands (r2≤0.37). Therefore the oil sands do not appear to be a significant CH3I source. The maximum CH3I mixing ratio was measured in the final sample of Flight Leg 7 (sample 17) and the enhance-ments of CH3I during Leg 7 may be attributable to methyl iodide’s terrestrial source.
Methyl chloride is the most abundant chlorine-containing compound in the atmosphere. It has a complex budget with multiple sources (e.g., tropical vegetation, biomass burning) and sinks (e.g., OH, soil) (Clerbaux et al., 2007). During the first half of the flight the average CH3Cl mixing ratio in the FT was 530±13 pptv. It then decreased to 503±6 pptv in the background BL, consistent with CH3Cl removal at low altitude by its soil sink. By contrast, the average CH3Cl
mix-ing ratio over the oil sands (522±12 pptv) was enhanced compared to the local background, with a maximum of 545 pptv and a range of values similar to the FT (Fig. 8e). Whereas CH3Cl showed poor correlation with most com-pounds over the oil sands (r2<0.34), including combustion tracers such as CO and ethyne (r2<0.01), it showed some correlation with OCS and HCFC-22 (r2=0.58 for both) followed by HCFC-142b and HFC-134a (0.46≤r2≤0.47). Carbonyl sulphide has a strong vegetative sink (Sect. 3.4) and Montzka et al. (2007) found some correlation between OCS and other species with known surface sinks such as CH3Cl. Therefore the CH3Cl enhancement is expected to be related to the loss of its soil sink at the mining site, with the possi-bility of its co-emission from the oil sands industry together with species such as HCFC-22.
3.3.3 Non-enhanced halocarbons
Carbon tetrachloride (CCl4), methyl chloroform (CH3CCl3)
and the chlorofluorocarbons (CFC-11, CFC-12, CFC-113, CFC-114) were not statistically enhanced over the oil sands (Table 1; Fig. 4a). These long-lived compounds have been banned in developed countries since 1996 under the Montreal Protocol, and even though evidence exists for their contin-ued emissions in North America (Millet and Goldstein, 2004; Hurst et al., 2006) their absence from the oil sands mining industry is not surprising. Ethyl chloride (C2H5Cl), another chlorinated hydrocarbon whose industrial demand is declin-ing, also was not enhanced over the oil sands. Likewise, with the exception of methyl bromide (CH3Br), none of the measured brominated species (CHBr3, CH2Br2, CHBrCl2, CHBr2Cl) were enhanced over the oil sands (Table 1). These short-lived species are predominantly emitted from the ocean (e.g., Butler et al., 2007) and their lack of enhancement over the oil sands is not unexpected.
3.4 Sulphur species