ACPD
13, 1795–1853, 2013Ozone photochemistry in
boreal biomass burning plumes
M. Parrington et al.
Title Page
Abstract Introduction
Conclusions References
Tables Figures
◭ ◮
◭ ◮
Back Close
Full Screen / Esc
Printer-friendly Version Interactive Discussion
Discussion
P
a
per
|
Dis
cussion
P
a
per
|
Discussion
P
a
per
|
Discussio
n
P
a
per
|
Atmos. Chem. Phys. Discuss., 13, 1795–1853, 2013 www.atmos-chem-phys-discuss.net/13/1795/2013/ doi:10.5194/acpd-13-1795-2013
© Author(s) 2013. CC Attribution 3.0 License.
Atmospheric Chemistry and Physics Discussions
This discussion paper is/has been under review for the journal Atmospheric Chemistry and Physics (ACP). Please refer to the corresponding final paper in ACP if available.
Ozone photochemistry in boreal biomass
burning plumes
M. Parrington1, P. I. Palmer1, A. C. Lewis2, J. D. Lee2, A. R. Rickard3,*,
P. Di Carlo4,5, J. W. Taylor6, J. R. Hopkins2, S. Punjabi7, D. E. Oram8, G. Forster8, E. Aruffo4,5, S. J. Moller2, S. J.-B. Bauguitte9, J. D. Allan6,10, H. Coe6, and
R. J. Leigh11
1
School of GeoSciences, The University of Edinburgh, Edinburgh, UK
2
National Centre for Atmospheric Science, Department of Chemistry, University of York, York, UK
3
National Centre for Atmospheric Science, School of Chemistry, University of Leeds, UK
4
Center of Excellence CETEMPS, University of L’Aquila, L’Aquila, Italy
5
Department of Physical and Chemical Sciences, University of L’Aquila, L’Aquila, Italy
6
School of Earth, Atmospheric and Environmental Sciences, University of Manchester, Manchester, UK
7
Department of Chemistry, University of York, York, UK
8
National Centre for Atmospheric Science, School of Environmental Sciences, University of East Anglia, Norwich, UK
9
Facility for Airborne Atmospheric Measurements, Bedford, UK
10
ACPD
13, 1795–1853, 2013Ozone photochemistry in
boreal biomass burning plumes
M. Parrington et al.
Title Page
Abstract Introduction
Conclusions References
Tables Figures
◭ ◮
◭ ◮
Back Close
Full Screen / Esc
Printer-friendly Version Interactive Discussion
Discussion
P
a
per
|
Dis
cussion
P
a
per
|
Discussion
P
a
per
|
Discussio
n
P
a
per
11
Department of Physics and Astronomy, University of Leicester, Leicester, UK
*
now at: the National Centre for Atmospheric Science, Department of Chemistry, University of York, York, UK
Received: 26 December 2012 – Accepted: 8 January 2013 – Published: 17 January 2013
Correspondence to: M. Parrington (mark.parrington@ed.ac.uk)
ACPD
13, 1795–1853, 2013Ozone photochemistry in
boreal biomass burning plumes
M. Parrington et al.
Title Page
Abstract Introduction
Conclusions References
Tables Figures
◭ ◮
◭ ◮
Back Close
Full Screen / Esc
Printer-friendly Version Interactive Discussion
Discussion
P
a
per
|
Dis
cussion
P
a
per
|
Discussion
P
a
per
|
Discussio
n
P
a
per
|
Abstract
We present an analysis of ozone photochemistry observed by aircraft measurements of boreal biomass burning plumes over Eastern Canada in the summer of 2011. Mea-surements of ozone and a number of key chemical species associated with ozone photochemistry, including non-methane hydrocarbons (NMHCs), nitrogen oxides (NOx)
5
and total nitrogen containing species (NOy), were made from the UK FAAM BAe-146
research aircraft as part of the quantifying the impact of BOReal forest fires on tropo-spheric oxidants over the Atlantic using Aircraft and Satellites (BORTAS) experiment between 12 July and 3 August 2011. We found that ozone mixing ratios measured in biomass burning plumes were indistinguishable from non-plume measurements, but
10
evaluating them in relationship to measurements of carbon monoxide (CO), total alkyl nitrates (ΣAN) and the surrogate species NOz (=NOy−NOx) revealed that the
po-tential for ozone production increased with plume age. We used NMHC ratios to es-timate photochemical ages of the observed biomass burning plumes between 0 and 15 days. Ozone production, calculated from∆O3/∆CO enhancement ratios, increased
15
from 0.020±0.008 ppbv ppbv−1 in plumes with photochemical ages less than 2 days
to 0.55±0.29 ppbv ppbv−1 in plumes with photochemical ages greater than 5 days. In comparing ozone mixing ratios with components of the NOy budget we observed
that plumes with ages between 2 and 4 days were characterised by high aerosol loading, relative humidity greater than 40 %, and low ozone production efficiencies of
20
8 ppbv ppbv−1relative to ΣAN and 2 ppbv ppbv−1relative to NOz. In plumes with ages
greater than 4 days, ozone production efficiency increased to 473 ppbv ppbv−1relative
to ΣAN and 155 ppbv ppbv−1 relative to NOz. From the BORTAS measurements we
estimated that aged plumes with low aerosol loading were close to being in photosta-tionary steady state and ozone production in younger plumes was inhibited by high
25
aerosol loading and greater production ofΣAN relative to ozone. The BORTAS
ACPD
13, 1795–1853, 2013Ozone photochemistry in
boreal biomass burning plumes
M. Parrington et al.
Title Page
Abstract Introduction
Conclusions References
Tables Figures
◭ ◮
◭ ◮
Back Close
Full Screen / Esc
Printer-friendly Version Interactive Discussion
Discussion
P
a
per
|
Dis
cussion
P
a
per
|
Discussion
P
a
per
|
Discussio
n
P
a
per
region during the Arctic Research of the Composition of the troposphere (ARCTAS-B) in 2008 and Atmospheric Boundary Layer Experiment (ABLE 3B) in 1990.
1 Introduction
The quantifying the impact of BOReal forest fires on tropospheric oxidants over the At-lantic using Aircraft and Satellites (BORTAS) experiment was conducted in two phases
5
during July–August 2010 (phase A) and 2011 (phase B) (Palmer et al., 2012). The overarching objective of BORTAS was to better understand the chemical evolution of plumes emitted from wildfires in boreal regions, with a particular emphasis on the net production tropospheric ozone, and downwind impacts on air quality. The first phase of the experiment (BORTAS-A) comprised of ground-based, ozonesonde, and satellite
10
measurements over Eastern Canada in the summer of 2010, the results of which were reported by Parrington et al. (2012). The second phase of the experiment (BORTAS-B) was an aircraft measurement campaign based out of Halifax, Nova Scotia, Canada between 12 July and 3 August 2011, supported by ground-based, ozonesonde, and satellite measurements. An overview of the BORTAS-B campaign is given by Palmer
15
et al. (2012). In this paper we analyse ozone photochemistry in the biomass burning plumes sampled by the aircraft during BORTAS-B.
Ozone in the troposphere is a secondary pollutant formed by the photo-oxidation of carbon monoxide (CO) and volatile organic compounds (VOCs) in the presence of ni-trogen oxides (NOx) and transport from the stratosphere. Removal of ozone from the
20
troposphere is through dry deposition and photochemical destruction. Tropospheric ozone plays an important role in the contexts of climate and air quality through its in-fluence on tropospheric chemistry as a precursor of the hydroxyl radical (OH) which is the principal atmospheric oxidant, with the photochemistry controlling its produc-tion also implicated in photochemical smog formaproduc-tion. Emissions of the ozone
pre-25
ACPD
13, 1795–1853, 2013Ozone photochemistry in
boreal biomass burning plumes
M. Parrington et al.
Title Page
Abstract Introduction
Conclusions References
Tables Figures
◭ ◮
◭ ◮
Back Close
Full Screen / Esc
Printer-friendly Version Interactive Discussion
Discussion
P
a
per
|
Dis
cussion
P
a
per
|
Discussion
P
a
per
|
Discussio
n
P
a
per
|
measurement campaigns have made in situ observations of photochemistry within bo-real biomass burning outflow and evaluated the associated ozone production and loss. The NASA Atmospheric Boundary Layer Experiment (ABLE) included two high-latitude aircraft measurement campaigns in the summers of 1988 (ABLE 3A) and 1990 (ABLE 3B) (Harriss et al., 1992, 1994). Analysis of the ABLE 3A measurements, made over
5
northern and western Alaska, found ozone production in haze layers associated with fires to be inefficient with less than 0.1 molecules of ozone formed per molecule of
CO (Wofsy et al., 1992). The ABLE 3B measurements, made over Central and Eastern Canada, did observe ozone enhancements of 5–15 ppbv in aged (>2 days) biomass burning plumes (Anderson et al., 1994). Aircraft measurements made over the North
10
Atlantic Ocean during the Intercontinental Transport of Ozone and Precursors (ITOP) campaign (Lewis et al., 2007), which was part of the wider International Consortium for Atmospheric Research on Transport and Transformation (ICARTT) (Fehsenfeld et al., 2006) in the summer of 2004, sampled biomass burning plumes associated with fires in Alaska. Examples of elevated ozone were observed in individual plumes with
el-15
evated CO during ITOP but there was no single canonical relationship (Lewis et al., 2007). More recently the NASA Arctic Research of the Composition of the troposphere from Aircraft and Satellites (ARCTAS) campaign in the spring and summer of 2008 made measurements of biomass burning plumes in Central Canada. Analysis of the ARCTAS aircraft measurements showed little evidence for ozone formation within the
20
plumes (Alvarado et al., 2010) other than when the plumes were mixed with outflow from urban pollution (Singh et al., 2010). Ground-based measurements of outflow from boreal biomass burning have also been routinely made at the Pico Mountain Observa-tory in the mid-Atlantic (Lapina et al., 2006; Val Martin et al., 2006; Helmig et al., 2008). Years with high boreal fire activity have been shown to increase ozone mixing ratios in
25
ACPD
13, 1795–1853, 2013Ozone photochemistry in
boreal biomass burning plumes
M. Parrington et al.
Title Page
Abstract Introduction
Conclusions References
Tables Figures
◭ ◮
◭ ◮
Back Close
Full Screen / Esc
Printer-friendly Version Interactive Discussion
Discussion
P
a
per
|
Dis
cussion
P
a
per
|
Discussion
P
a
per
|
Discussio
n
P
a
per
Model analyses of photochemistry in boreal biomass burning plumes have also been performed to evaluate ozone production and loss. Mauzerall et al. (1996) performed 1-D model simulations to calculate in situ production and loss of ozone based on the ABLE 3B measurements in the summer of 1990. They found biomass burning emis-sions to be a relatively negligible term contributing less than 2 % to the calculated
5
ozone budget. McKeen et al. (2002) used a 3-D chemistry transport model (CTM) to evaluate the influence of Canadian biomass burning emissions on ozone production over the Northeastern USA using measurements made from the National Oceano-graphic and Atmospheric Administration (NOAA) WP-3 aircraft in the summer of 1995. Ozone enhancements of between 10 and 30 ppbv throughout the central and eastern
10
US were attributed to the fires, with the model simulations being sensitive to NOx/CO and VOC/CO emission ratios. The influence of emissions from forest fires in Alaska and Canada on tropospheric ozone production during summer 2004 was the subject of model studies by Pfister et al. (2006); Real et al. (2007); Cook et al. (2007). Pfister et al. (2006) utilised the MOZART-4 CTM to evaluate ozone production in the outflow
15
from fires in Alaska during summer of 2004 with measurements made from aircraft dur-ing the ICARTT campaign and at the Pico Mountain Observatory and reported ozone enhancements relative to CO of 0.25 ppbv ppbv−1 and contributed approximately 3 % of the Northern Hemispheric tropospheric ozone budget. Lagrangian model studies of the outflow over the North Atlantic Ocean (Real et al., 2007) reported that although an
20
ozone enhancement of 17 ppbv was observed after 5 days, net ozone loss could occur in the plumes due to biomass burning aerosols in the plume reducing the photolysis rates of O3and NO2.
An overview of observed and model estimates of ozone production in boreal biomass burning plumes was recently presented by Jaffe and Wigder (2012). A common
fea-25
ture of observation and model studies of ozone production in biomass burning out-flow is the use of ozone enhancement ratios relative to CO (∆O3/∆CO) to determine
ozone production. Jaffe and Wigder (2012) broadly showed that the ∆O3/∆CO
ACPD
13, 1795–1853, 2013Ozone photochemistry in
boreal biomass burning plumes
M. Parrington et al.
Title Page
Abstract Introduction
Conclusions References
Tables Figures
◭ ◮
◭ ◮
Back Close
Full Screen / Esc
Printer-friendly Version Interactive Discussion
Discussion
P
a
per
|
Dis
cussion
P
a
per
|
Discussion
P
a
per
|
Discussio
n
P
a
per
|
burning plumes sampled over Eastern Canada using a number of different metrics,
in-cluding∆O3/∆CO, determined from measurements made from the BAe-146 research
aircraft the BORTAS-B campaign in the summer of 2011. An overview of the mea-surements and chemical processes influencing ozone photochemistry are presented in Sect. 2. Section 3 presents the ozone distribution over Eastern Canada observed
5
by the aircraft over the campaign period. Section 4 presents an analysis of observed plume photochemistry using photochemical age calculations derived from hydrocarbon ratios, ozone production efficiencies relative to NOy partitioning, and photostationary
steady state calculations. We conclude in Sect. 5.
2 Airborne photochemical measurements during BORTAS-B
10
In this section we present a brief overview of tropospheric ozone photochemistry and the relevant measurements made from the BAe-146 aircraft during the BORTAS-B air-craft measurement campaign and used in our analysis.
2.1 Plume photochemistry
The simplest model of ozone photochemistry in the atmosphere can be represented
15
by the rapid oxidation of nitrogen oxides, NOx, which represents the sum of nitric oxide
(NO) and nitrogen dioxide (NO2), in the presence of sunlight through the following null cycle:
NO+O3→NO2+O2 (R1)
NO2+hν→NO+O (R2)
20
O+O2 →M O3 (R3)
ACPD
13, 1795–1853, 2013Ozone photochemistry in
boreal biomass burning plumes
M. Parrington et al.
Title Page
Abstract Introduction
Conclusions References
Tables Figures
◭ ◮
◭ ◮
Back Close
Full Screen / Esc
Printer-friendly Version Interactive Discussion
Discussion
P
a
per
|
Dis
cussion
P
a
per
|
Discussion
P
a
per
|
Discussio
n
P
a
per
oxidation of VOCs provide additional pathways for converting NOxinto ozone. Figure 1 shows a schematic of the simplified ozone-NOx-VOC chemistry in the atmosphere.
The chain of reactions leading to ozone formation is initiated by the photo-oxidation of a VOC (RH) and its rapid subsequent reaction with molecular oxygen to produce alkyl peroxy radicals (RO2), for example:
5
RH+OH O2
→ RO2+H2O (R4)
Under tropospheric conditions, and following the blue arrows in Fig. 1, alkyl peroxy radicals can react with NO2via a three body reaction to form peroxynitrates (RO2NO2):
RO2+NO2 M
→RO2NO2 (R5)
10
which will decompose back into the constituent RO2and NO2under the right
environ-mental conditions (i.e. near surface temperatures) but can also be subject to transport away from the source region as they are thermally stable at lower temperatures, such as those in the free troposphere.
15
Peroxy radicals are also subject to reaction with NO and can follow two different
pathways:
RO2+NO→RO+NO2 (R6a)
RO2+NO M
→ RONO2 (R6b)
20
Reaction (R6a) results in the formation of ozone molecules via photolysis of NO2. Com-parison of Reaction (R6a, b) indicate that ozone production in biomass burning plumes initiated by photo-oxidation of VOCs is in competition with production of alkyl nitrates (RONO2) and evaluating the relationship between the measured ozone and RONO2 mixing ratios provides an indication of the potential for ozone production related to the
25
above mechanism (e.g. Perring et al., 2010).
ACPD
13, 1795–1853, 2013Ozone photochemistry in
boreal biomass burning plumes
M. Parrington et al.
Title Page
Abstract Introduction
Conclusions References
Tables Figures
◭ ◮
◭ ◮
Back Close
Full Screen / Esc
Printer-friendly Version Interactive Discussion
Discussion
P
a
per
|
Dis
cussion
P
a
per
|
Discussion
P
a
per
|
Discussio
n
P
a
per
|
(=NO+NO2). A surrogate species, NOy, is used to represent the sum
of all reactive and oxidised nitrogen species in an air mass: NOy=
NOx+ ΣRO2NO2i+ ΣRONO2i+HNO3+HONO+NO3+2N2O5+NO−
3, where
ΣRO2NO2i represents the total peroxynitrates (ΣPN) and ΣRONO2i represents
the total alkyl nitrates (ΣAN) (e.g. Day et al., 2003). A second surrogate species, NOz
5
(=NOy−NOx), can be defined that represents the sum of the photo-oxidation products
of NOx (Olszyna et al., 1994). Since NOy is representative of all NOx emissions,
NOz provides a measure of the number of NOx molecules that have undergone
photo-oxidation. Several studies have shown that ozone abundance in polluted air masses is linearly related to the abundance of NOz(e.g. Trainer et al., 1993; Kleinman,
10
2000). The enhancement of ozone abundance relative to NOz (i.e. ∆O3/∆NOz)
provides a measure of ozone production related to photo-oxidation of NOxmolecules, sometimes referred to as the ozone production efficiency (Rickard et al., 2002).
2.2 BORTAS measurements
Measurements of the key tracers relevant to the ozone photochemistry outlined above
15
were made from the BAe-146 aircraft over the course of the BORTAS-B measurement campaign. Full details of the BAe-146 payload is presented by Palmer et al. (2012) and we provide brief details of the measurements used in this study.
Measurements of ozone were made using a TECO 49 ultraviolet absorption instru-ment (Wilson and Birks, 2006) operated by the UK Facility for Airborne Atmospheric
20
Measurements (FAAM) with an averaging time of 3 Hz at a precision of 1 ppbv and accuracy of ±5 %. Measurements used for identification of biomass burning plume air masses included acetonitrile (CH3CN) and CO. A Proton Transfer Reaction Mass
Spectrometer (PTR-MS) (Murphy et al., 2010) provided measurements of CH3CN with an averaging time of 1 s and mean precision of 37 pptv over all BORTAS flights. CO
25
ACPD
13, 1795–1853, 2013Ozone photochemistry in
boreal biomass burning plumes
M. Parrington et al.
Title Page
Abstract Introduction
Conclusions References
Tables Figures
◭ ◮
◭ ◮
Back Close
Full Screen / Esc
Printer-friendly Version Interactive Discussion
Discussion
P
a
per
|
Dis
cussion
P
a
per
|
Discussion
P
a
per
|
Discussio
n
P
a
per
black carbon using a single particle soot photometer (SP2) and measurements of total scattering coefficient at 550 nm using a TSI Inc. 3563 three-wavelength
nephelome-ter (Anderson and Ogren, 1998). The SP2 uses laser-induced incandescence to mea-sure refractory black carbon on a single particle basis (Schwarz et al., 2006) and the inlet and instrumental setup on the BAe-146 are described by McMeeking et al. (2010).
5
The statistical uncertainty in BC mass concentration was 5 % for an averaging time of 15 s, and accuracy within 20 % due to possible differences between the instrumental
re-sponse to biomass burning BC and the calibrant (Laborde et al., 2012). Measurement of NO2 photolysis rates were made using upper and lower fixed bandwidth
radiome-ters at wavelengths predominantly between 208 and 500 nm at a frequency of 1 Hz
10
and with accuracy of 10 % (Volz-Thomas et al., 1996). Measurements of VOCs used in this study were made using a dual channel gas chromatograph system with flame ionisation detection (GC-FID) (Hopkins et al., 2003, 2011) to analyse whole air canister samples taken during each flight. Each canister sample was taken over a 30 s period at points of particular interest along the flight track. The precision and accuracy of
15
the GC-FID measurements are species dependent but typical values are 1–5 pptv and 5 %, respectively. Measurements of NO and NO2 were made using a single channel chemiluminesence instrument manufactured by Air Quality Design (AQD) Inc., USA. as described by Lee et al. (2009). Measurements of NO2, total NOy, total peroxyacetyl
nitrates (ΣPN= ΣRO2NO2i), and total alkyl nitrates (ΣAN= ΣRONO2i) were made
us-20
ing a Thermal Dissociation–Laser Induced Fluorescence (TD–LIF) instrument (Dari-Salisburgo et al., 2009; Di Carlo et al., 2012) with precisions of 10 %, 22 %, 34 %, and 46 % respectively.
We use mixing ratios of NOx and NOz calculated from aircraft measurements NO,
NO2 and NOy described above. NOx was calculated using NO measured by the AQD
25
ACPD
13, 1795–1853, 2013Ozone photochemistry in
boreal biomass burning plumes
M. Parrington et al.
Title Page
Abstract Introduction
Conclusions References
Tables Figures
◭ ◮
◭ ◮
Back Close
Full Screen / Esc
Printer-friendly Version Interactive Discussion
Discussion
P
a
per
|
Dis
cussion
P
a
per
|
Discussion
P
a
per
|
Discussio
n
P
a
per
|
then calculated by subtracting the AQD/LIF NOx values from the LIF total NOy mea-surements.
To distinguish measurements made in biomass burning plumes from those made in clean air, we use the threshold of 150 pptv of acetonitrile (CH3CN) determined by Palmer et al. (2012) from the 99th percentile of measurements made on fight B625.
5
Acetonitrile is predominantly emitted from biomass burning and removed from the at-mosphere through uptake by the oceans and reaction with OH, with an atmospheric lifetime of approximately 25 days (Bange and Williams, 2000) and is, therefore, an ex-cellent tracer for identifying plume measurements.
3 Observed ozone distribution over Eastern Canada
10
In this section we present an overview of the ozone distribution observed from the BAe-146 aircraft during the BORTAS-B measurement campaign. Figure 2 shows the relative frequency distribution of ozone mixing ratios, divided into 1 ppbv bins, measured from the BAe-146 during the eleven research flights undertaken between 15–31 July 2011 listed in Tables 1 and 2. The frequency distribution of the ozone measurements made
15
both in and out of biomass burning plumes shows two peaks at approximately 25 and 50 ppbv. The peak in ozone mixing ratio at 25 ppbv is attributable to measurements made at altitudes below 3 km. The ozone measurements made during BORTAS-B show a similar distribution to that observed over central and Eastern Canada during the ABLE 3B measurement campaign in the summer of 1990 (Anderson et al., 1994).
20
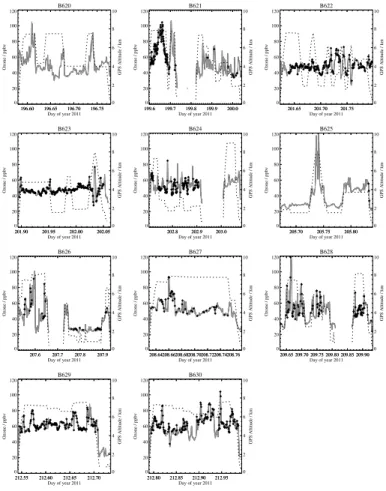
Figure 3 summarizes the temporal and spatial distribution of the tropospheric ozone distribution over the campaign period. Table 1 lists the date and location of each re-search flight shown in Fig. 3. Boreal biomass burning plumes from different fire source
regions were sampled by the BAe-146 throughout the BORTAS measurement cam-paign. Widespread fires in Northwestern Ontario burned between 17–19 July with
25
ACPD
13, 1795–1853, 2013Ozone photochemistry in
boreal biomass burning plumes
M. Parrington et al.
Title Page
Abstract Introduction
Conclusions References
Tables Figures
◭ ◮
◭ ◮
Back Close
Full Screen / Esc
Printer-friendly Version Interactive Discussion
Discussion
P
a
per
|
Dis
cussion
P
a
per
|
Discussion
P
a
per
|
Discussio
n
P
a
per
1000–3000 km downwind of the source region. Flight B621 took place over two seg-ments, making measurements between Halifax and Goose Bay NL via the Island of Newfoundland and Goose Bay and Halifax via the western edge of the Gulf of St. Lawrence. On the first segment a large range of ozone mixing ratios was mea-sured throughout the free troposphere between 2 and 8 km with values ranging from
5
about 20 ppbv to in excess of 100 ppbv with an average mixing ratio of 66.8±18.0 ppbv. Plume air was sampled at all altitudes over Nova Scotia and the Island of Newfound-land with an average ozone mixing ratio of 68.2±15.3 ppbv. Lower ozone mixing
ra-tios were measured on the second segment with an average value of 47.3±9.6 ppbv. Plume air was only sampled on this segment towards the end of the flight over Nova
10
Scotia at altitudes around 2 km with an average ozone mixing ratio of 43.5±12.1 ppbv.
Flights B622 and B623 extended over a geographical region from 79◦W in western Quebec across New Brunswick to approximately 62◦W over Nova Scotia, sampling outflow from forest fires in Northwestern Ontario. Measurements were made through-out the free troposphere on these flights at altitudes between 2 and 8 km. Ozone mixing
15
ratios measured on both flights were relatively invariant along the aircraft trajectories with an average value of 48.0±7.0 ppbv. Biomass burning plume air was sampled
throughout both research flights at all aircraft altitudes with an average ozone mixing ratio of 48.2±6.3 ppbv. Flight B624 also sampled outflow from these fires at lower altitudes (2–3 km) over the Atlantic Ocean offthe east coast of the Island of
Newfound-20
land to a longitude of 51◦W. Ozone mixing ratios measured on the first segment of this flight were higher on average than on the previous two flights at 54.8±7.5 ppbv. Plume air was sampled extensively over the first flight segment with a slightly lower average ozone mixing ratio of 52.7±6.9 ppbv. The second segment of flight B624 was a transit flight between St. John’s NL and Halifax following a refuelling stop. Ozone mixing
ra-25
tios measured on this segment were higher on average than the first segment, with an average value of 58.8±5.5 ppbv.
ACPD
13, 1795–1853, 2013Ozone photochemistry in
boreal biomass burning plumes
M. Parrington et al.
Title Page
Abstract Introduction
Conclusions References
Tables Figures
◭ ◮
◭ ◮
Back Close
Full Screen / Esc
Printer-friendly Version Interactive Discussion
Discussion
P
a
per
|
Dis
cussion
P
a
per
|
Discussion
P
a
per
|
Discussio
n
P
a
per
|
fires had been burning but substantial localised enhancements of CO and other species associated with biomass burning were observed during the flight. The flight was made over two segments the first of which was a transit flight at altitudes above 7 km be-tween Halifax NS and Thunder Bay ON. Ozone mixing ratios measured on this first flight section show a high degree of variability ranging from 21.5 ppbv to 101.4 ppbv.
5
The second segment of the flight, at generally low altitudes (between 1 and 2 km) over Northwestern Ontario, observed relatively low ozone mixing ratios with an average value of 31.3±9.4 ppbv.
The final three research flights, B628 on 28 July, B629 and B630 on 31 July, of the BORTAS campaign were made over the east coast of Canada with back trajectories,
10
not shown, placing the source of the sampled outflow to fires in the vicinity of Great Slave Lake in the Northwest Territories. Flight B628 was made over two segments out of Goose Bay NL: the first segment, over the Atlantic Ocean off the east coast
of Labrador, measured ozone mixing ratios between 26.2 and 119.1 ppbv with an av-erage of 49.7±16.5 ppbv; the second segment was a transit flight from Goose Bay
15
to Halifax and measured average ozone mixing ratios of 47.2±10.6 ppbv for all data
and 51.1±7.4 ppbv for the plume measurements. Flights B629 and B630 were made
over the Gulf of St. Lawrence north of Nova Scotia and over the west coast of the Is-land of NewfoundIs-land, respectively. In general, measurements from these two flights were made at relatively high altitudes between 6 and 8 km. Average ozone mixing ratios
20
measured on these flights were higher than those measured on other flights during the campaign with mean values of 59.1±12.7 ppbv for fight B629 and 59.6±13.1 ppbv for flight B630. Plume air was sampled throughout both flights at altitudes above 5 km and the ozone mixing ratios in these air masses was 62.2±6.7 ppbv and 65.2±10.2 ppbv. Flights B620 on 15 July, B625 on 24 July, and B627 on 27 July are not analysed
25
ACPD
13, 1795–1853, 2013Ozone photochemistry in
boreal biomass burning plumes
M. Parrington et al.
Title Page
Abstract Introduction
Conclusions References
Tables Figures
◭ ◮
◭ ◮
Back Close
Full Screen / Esc
Printer-friendly Version Interactive Discussion
Discussion
P
a
per
|
Dis
cussion
P
a
per
|
Discussion
P
a
per
|
Discussio
n
P
a
per
4 km. The average ozone mixing ratio on flight B620 was 50.0±12.7 ppbv with ozone
mixing ratios of approximately 40–55 ppbv associated with enhanced CO. Flight B625 was unusual in that measurements were made in mainly unpolluted air. Measured ozone mixing ratios on this flight showed a large range of values between 21.1 and 124.8 ppbv and exhibited a clear dependence on altitude with a correlation coefficient,
5
r=0.86. Flight B627 was a direct transit flight at altitudes above 7 km between Thunder
Bay and Goose Bay. The measured ozone mixing ratios on this flight showed higher variability initially, with values ranging from 45 to 95 ppbv, which became lower, values in the range 45 to 60 ppbv, at the eastern end of the flight track.
Figure 4 shows a box and whisker plot of the distribution of measured ozone mixing
10
ratios on each research flight. The data have been partitioned by an arbitrarily chosen planetary boundary layer (PBL) height of 2 km. Statistics (mean, median, standard de-viation, and range of values) for each flight are given in Table 2. In the free troposphere, i.e. aircraft altitudes above 2 km, the mean and median ozone mixing ratios for each flight are distributed around the campaign mean of 54 ppbv within a range of 46 and
15
61 ppbv. The measurements made in the PBL are not uniformly distributed over the duration of the campaign period and can be separated into two distinct populations representing the first (flights B620 to B624) and second (flights B625 to B630) halves of the campaign. In the first half of the campaign average values in excess of 40 ppbv are observed comparable to the average values in the free troposphere with average
20
values less than 35 ppbv over the second half (i.e. flights B625 to B630) and showing a clear partitioning between the PBL and FT measurements. It should be noted that of the measurements made in the PBL over the second half of the campaign, those on flights B627 through to B630 were only made during take offand landing while more
extensive measurements were made in the PBL on flights B625 and B626. Figure 4b
25
ACPD
13, 1795–1853, 2013Ozone photochemistry in
boreal biomass burning plumes
M. Parrington et al.
Title Page
Abstract Introduction
Conclusions References
Tables Figures
◭ ◮
◭ ◮
Back Close
Full Screen / Esc
Printer-friendly Version Interactive Discussion
Discussion
P
a
per
|
Dis
cussion
P
a
per
|
Discussion
P
a
per
|
Discussio
n
P
a
per
|
Flight B621 shows a higher average plume ozone mixing ratio compared to all the data due to the flight being made over two legs with plume air sampled mostly on the first leg where the measured ozone mixing ratios were generally higher as shown in Fig. 3.
4 Observed boreal biomass burning outflow
In this section we evaluate the processes influencing the ozone distribution in biomass
5
burning plume air sampled by the BAe-146 over the course of the BORTAS campaign. Figure 5 shows the relative distributions of 60-s averaged ozone and CO mixing ra-tios measured from the aircraft. As shown by Fig. 2, there is no discernible difference
between ozone measurements made in the plume air to those in clean air. CO mixing ratios in plumes range from 64 to 930 ppbv. For CO mixing ratios in excess of 300 ppbv,
10
ozone mixing ratios lie within a range between approximately 40 and 60 ppbv. In the following sub-sections we examine ozone production and photochemistry measured in boreal biomass burning plumes.
4.1 Photochemical ageing of biomass burning plumes
First, we investigate photochemical processing within biomass burning plumes
sam-15
pled by the aircraft by calculating a photochemical age, i.e. the time taken for a par-ticular measured tracer to be removed chemically from an air mass since emis-sion. We calculate photochemical ages based on ratios of non-methane hydrocar-bons (NMHCs) (Parrish et al., 2007), and the lightest alkanes (ethane, propane and
n-butane) in particular, measured by GC-FID from whole air canister samples taken
20
over the course of the BORTAS campaign. Figure 6 shows the relationship between natural logarithms of ratios of the observed mixing ratios of n-butane : ethane and propane : ethane. The ratio of initial mixing ratios for each NMHC pair, shown as the green square in Fig. 6, are determined from flight B626 over Northwestern Ontario on 26 July which was the main source of biomass burning early in the campaign with fires
ACPD
13, 1795–1853, 2013Ozone photochemistry in
boreal biomass burning plumes
M. Parrington et al.
Title Page
Abstract Introduction
Conclusions References
Tables Figures
◭ ◮
◭ ◮
Back Close
Full Screen / Esc
Printer-friendly Version Interactive Discussion
Discussion
P
a
per
|
Dis
cussion
P
a
per
|
Discussion
P
a
per
|
Discussio
n
P
a
per
burning from 17–19 July. We assume that the higher values of the natural logarithm of the NMHC ratios from flight B626 are representative of the ratios of fresh emis-sions of these NMHCs. In general, the NMHC ratios measured in biomass burning plumes during BORTAS lie to the left and below this point indicating that the estimated initial concentrations are a suitable reference point for calculating the relative
photo-5
chemical ageing of the biomass burning plumes sampled during the campaign. The red solid lines originating from the initial concentration ratios are the kinetic and mix-ing slopes. The kinetic slope is the steeper of the two and represents the relationship between the NMHC pairs if oxidation by OH was the only process affecting their
be-haviour. The mixing slope represents the relationship between the NMHC pairs if the
10
only process was mixing of fresh emissions with background air. Most of the measured NMHC ratios lie between these two lines indicating that the sampled air masses ex-periened a combination of oxidation and mixing processes. The kinetic slope of the plotted NMHC ratios was calculated for kinetic reaction rate coefficients of the alkanes
with OH at a temperature of 273 K, taken from Atkinson and Arey (2003), has a
gra-15
dient of 2.61. The gradient of the line of best fit to the data is 1.55 further indicating that the observations were subject to mixing and photochemical processing. Outliers in Fig. 6, i.e. where ln([propane]/[ethane])>−1 and ln([n-butane]/[ethane])>−2, show measurements representative of different emission sources and are beyond the scope
of the work presented here.
20
In general, NMHC ratios measured during BORTAS lie between −3 and −1 for ln([propane]/[ethane]) and between −6 and −2.5 for ln([n-butane]/[ethane]) and are consistent with previous observations of NMHC ratios (Rudolph and Johnen, 1990; Par-rish et al., 1992; Jobson et al., 1994; ParPar-rish et al., 2007; Helmig et al., 2008). We esti-mate plume ages in days for the plume air masses sampled during the BORTAS
cam-25
ACPD
13, 1795–1853, 2013Ozone photochemistry in
boreal biomass burning plumes
M. Parrington et al.
Title Page
Abstract Introduction
Conclusions References
Tables Figures
◭ ◮
◭ ◮
Back Close
Full Screen / Esc
Printer-friendly Version Interactive Discussion
Discussion
P
a
per
|
Dis
cussion
P
a
per
|
Discussion
P
a
per
|
Discussio
n
P
a
per
|
ozone production in boreal biomass burning plumes measured over the BORTAS cam-paign to similar measurements used in previous studies.
4.2 Ozone enhancements in biomass burning plumes
Figure 7 shows the relationships between ozone and CO measured in biomass burning plumes during the BORTAS measurement campaign to the calculated photochemical
5
ages, sampled at the times of the whole air canister samples. Ozone mixing ratios measured in boreal biomass burning plumes, Fig. 7a, show no clear relationship to the calculated photochemical age over the whole BORTAS campaign period. The ozone measurements made on flight B626 are distinguished from those made on the other research flights by mixing ratios less than 30 ppbv. It should be noted that the
measure-10
ments made in biomass burning plumes on flight B626 were made at lower altitudes (below 1.5 km) than on other flights as shown in Figs. 2 and 4. Measurements with higher acetonitrile mixing ratios typically show moderate ozone mixing ratios between 40 and 70 ppbv with photochemical ages between 1.5 and 4.5 days. The measure-ments made with lower acetonitrile exhibit a wider range of ozone mixing ratios, from
15
40 to 110 ppbv, and photochemical ages, from 0 to 15 days. The CO mixing ratios mea-sured in boreal biomass burning plumes, Fig. 7b, typically show higher values (between 200 and 1100 ppbv) at photochemical ages of between 2 and 4 days and are coinci-dent with the higher values of acetonitrile. These measurements were made at aircraft altitudes below 3 km during flights B622–B624 on 20 and 21 July in plumes from the
20
fires in Northwestern Ontario with approximate transport times of 2–3 days, calculated by Langrangian backward trajectories (not shown). Measurements of CO mixing ratios less than 200 ppbv have a wider range of photochemical ages, between 0 and 15 days. On flight B626, CO mixing ratios were measured between 150 and 400 ppbv with pho-tochemical ages from 0 to 8.5 days.
25
ACPD
13, 1795–1853, 2013Ozone photochemistry in
boreal biomass burning plumes
M. Parrington et al.
Title Page
Abstract Introduction
Conclusions References
Tables Figures
◭ ◮
◭ ◮
Back Close
Full Screen / Esc
Printer-friendly Version Interactive Discussion
Discussion
P
a
per
|
Dis
cussion
P
a
per
|
Discussion
P
a
per
|
Discussio
n
P
a
per
symbols in Fig. 5 for the 60-s averaged data. The three populations of data points de-fined for flight B626, and moderate and high acetonitrile show clear distinctions from one another. Straight lines fitted to each population and their slopes provide an in-dication of ozone produced since the fire emissions of CO and other precursors at the source, i.e.∆O3/∆CO (Parrish et al., 1993; Pfister et al., 2006). Measurements of
5
fresh biomass burning air masses were made during flight B626, indicated by a slope of 0.009 ppbv ppbv−1. Of the measurements made on the other BORTAS research flights, those with the highest acetonitrile mixing ratios were made in moderately fresh plume air masses with photochemical ages of 2–4 days. The gradient of the straight line fitted to these data points is 0.016 ppbv ppbv−1 suggesting a slight increase in ozone
pro-10
duction downwind of the emission source. Measurements with moderate acetonitrile are typically more aged (photochemical ages>4 days) and indicate increased ozone production relative to the other two populations, as reflected in the gradient of the straight line fitted to these data points of 1.29 ppbv ppbv−1. Figure 5d shows enhance-ment ratios of ozone relative to CO as a function of photochemical age.
Enhance-15
ments of ozone and CO (i.e. ∆O3 and ∆CO) are calculated relative to background
values determined from the 25th percentile of the distribution of clean air measure-ments (i.e. acetonitrile mixing ratios less than 150 pptv). Background values of ozone and CO were calculated to be 33 ppbv (24 ppbv for flight B626) and 60 ppbv, respec-tively. The∆O3/∆CO ratios for the three populations of data show a similar trend to
20
the gradients calculated for the ozone to CO relationship in Fig. 5c with the value of
∆O3/∆CO increasing from the measurements made on flight B626 through the high
acetonitrile measurements to the moderate acetonitrile measurements. The measure-ments made on flight B626 have∆O3/∆CO ratios between approximately 0.015 and
0.05 ppbv ppbv−1 over a range of photochemical ages between 0 and 8 days. The
25
∆O3/∆CO ratio decreases from 0.03 to 0.01 ppbv ppbv−1 between 0–2 days of
ACPD
13, 1795–1853, 2013Ozone photochemistry in
boreal biomass burning plumes
M. Parrington et al.
Title Page
Abstract Introduction
Conclusions References
Tables Figures
◭ ◮
◭ ◮
Back Close
Full Screen / Esc
Printer-friendly Version Interactive Discussion
Discussion
P
a
per
|
Dis
cussion
P
a
per
|
Discussion
P
a
per
|
Discussio
n
P
a
per
|
The high acetonitrile measurements show a wide range of∆O3/∆CO ratios, from 0.02
to 0.3 ppbv ppbv−1, between 2–4 days of photochemical ageing. A few high acetonitrile measurements with photochemical ages between 4 and 8 days have higher∆O3/∆CO
ratios from 0.2–0.5 ppbv ppbv−1. In general the moderate acetonitrile measurements have photochemical ages greater than 4 days and exhibit higher∆O3/∆CO ratios
be-5
tween 0.1 and 1.0 ppbv ppbv−1. Some measurements with moderate acetonitrile have photochemical ages less than 4 days although this does not appear to significantly af-fect the∆O3/∆CO ratio in these air masses. The measurements made with less than
2 days photochemical ageing and∆O3/∆CO ratios greater than 0.07 ppbv ppbv−1may
be attributable to a fire source with different initial NMHC mixing ratios to those used in
10
the photochemical age calculation or could be aged air masses that have experienced mixing with air of different origin which has influenced the NMHC abundance. Further
analysis of these data points is beyond the scope of the analysis presented here. A review of ozone production in the outflow from wildfires, including boreal regions, was recently presented by Jaffe and Wigder (2012). Table 3 presents statistics of
15
∆O3/∆CO ratios in boreal biomass burning plumes sampled during BORTAS arranged
by photochemical age following Jaffe and Wigder (2012). The BORTAS results show
that the ∆O3/∆CO ratio increases with plume age in both the range and average
(mean and median) values indicating that ozone production is enhanced in plumes that have undergone more photochemical processing as they are transported away
20
from the source region. For plume ages less than 2 days the BORTAS∆O3/∆CO
ra-tios are within the range of ARCTAS measurements for the same category (Alvarado et al., 2010) and the mean BORTAS value of 0.020 ppbv is comparable to the mean of 0.018 ppbv calculated by Jaffe and Wigder (2012) from studies by Alvarado et al.
(2010); Goode et al. (2000); Singh et al. (2010); DeBell et al. (2004). For plume ages
25
between 2 and 5 days the range of BORTAS∆O3/∆CO ratios are comparable to the
ranges determined for boreal biomass burning plumes from Eastern Canada (Mauzer-all et al., 1996) and Siberia (Tanimoto et al., 2008). The average ∆O3/∆CO ratio of
ACPD
13, 1795–1853, 2013Ozone photochemistry in
boreal biomass burning plumes
M. Parrington et al.
Title Page
Abstract Introduction
Conclusions References
Tables Figures
◭ ◮
◭ ◮
Back Close
Full Screen / Esc
Printer-friendly Version Interactive Discussion
Discussion
P
a
per
|
Dis
cussion
P
a
per
|
Discussion
P
a
per
|
Discussio
n
P
a
per
double the mean of 0.07 ppbv ppbv−1calculated for the high acetonitrile measurements taken over the BORTAS campaign but is more comparable to the increased mean of 0.21 ppbv ppbv−1when the moderate acetonitrile measurements are included, although it should be noted that the range including these measurements is greater than the range reported in Jaffe and Wigder (2012). For plume ages greater than 5 days the
5
BORTAS∆O3/∆CO ratios are typically within the range of values presented by Jaffe
and Wigder (2012). The mean ∆O3/∆CO ratio of 0.66 ppbv ppbv−1 for BORTAS is
higher than the mean values of approximately 0.25 ppbv ppbv−1for North American bo-real biomass burning plumes (Pfister et al., 2006; Val Martin et al., 2006) and is more comparable to similarly aged plumes originating in Siberia (Bertschi and Jaffe, 2005;
10
Honrath et al., 2004). The upper-limit of 3.00 ppbv ppbv−1 in the range of∆O3/∆CO
ratios for these measurements is much higher than for the data presented by Jaffe and
Wigder (2012). Restricting this upper-limit removes two data points from the BORTAS statistics, reducing the mean value from 0.63 to 0.55 ppbv ppbv−1 and the standard deviation from 0.52 to 0.29 ppbv ppbv−1.
15
4.3 Ozone photochemistry in boreal biomass burning outflow
The∆O3/∆CO ratios presented above assume that enhancements in plume air over
background values provide an indication of ozone production in biomass burning plumes. However, this ratio provides limited information on the photochemistry occur-ring in the plume air masses. We now evaluate ozone mixing ratios measured in boreal
20
biomass burning plumes during the BORTAS campaign against measurements of other chemical species associated with ozone photochemistry.
4.3.1 Ozone production efficiency
We evaluate the ozone production efficiency in the plumes sampled during the
BOR-TAS campaign through comparison of the measured ozone mixing ratios to
measure-25
ACPD
13, 1795–1853, 2013Ozone photochemistry in
boreal biomass burning plumes
M. Parrington et al.
Title Page
Abstract Introduction
Conclusions References
Tables Figures
◭ ◮
◭ ◮
Back Close
Full Screen / Esc
Printer-friendly Version Interactive Discussion
Discussion
P
a
per
|
Dis
cussion
P
a
per
|
Discussion
P
a
per
|
Discussio
n
P
a
per
|
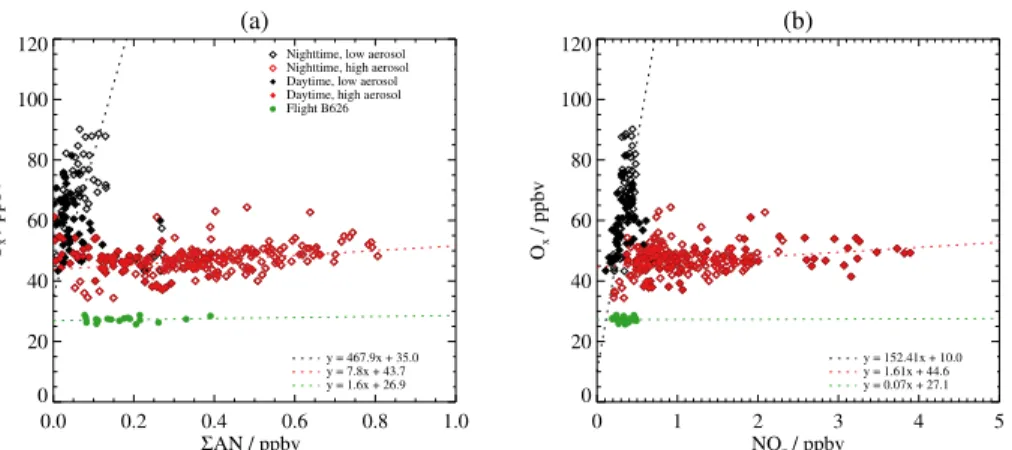
ozone in polluted air masses is dependent on the interaction between VOC and NOx chemistry as shown in Fig. 1 and Reactions (R4–R6a, b). Thus, comparing the prod-ucts of Reaction (R6a, b) provides an indication of the potential for ozone production in an air mass based on the relative concentrations of alkyl nitrates (RONO2 in Reac-tion (R6a, b) and referred to asΣAN from hereon in) and odd oxygen (Ox=O3+NO2).
5
The distribution of Oxrelative toΣAN measured in boreal biomass burning plumes
dur-ing BORTAS, Fig. 8a, shows three main populations of data points with a distinctive “L-shape” distribution for measurements made on all BORTAS research flights not in-cluding flight B626 (i.e. Ox mixing ratios in excess of 30 ppbv). Higher values of ΣAN
generally correspond to lower values of Ox, and lower values ofΣAN generally
corre-10
spond to higher values of Ox. High aerosol loading in the plumes is determined using measured black carbon mass concentration greater than 0.1 µg cm−3and nephelome-ter measurements of the total scatnephelome-ter coefficient at 550 nm greater than 1.1×10⁻⁵m−1 (corresponding to a black carbon mass concentration of 0.1 µg cm−3, and used to fill in gaps in the black carbon measurements). Although the vast majority of scattering
15
is due to nonrefractory aerosols, the black carbon mass concentration and total scat-ter coefficient measurements are strongly correlated (r=0.92) in the biomass
burn-ing plumes sampled durburn-ing BORTAS and indicates that these are reliable indicators of plume aerosol loading. The highest mixing ratios ofΣAN (>0.5 ppbv) were measured at
nighttime with corresponding Oxmixing ratios between approximately 40 and 60 ppbv.
20
Daytime measurements along the horizontal branch of the “L-shape” distribution were typically made in air masses with high aerosol loading and a wide range ofΣAN and
Ox, between 0–0.5 ppbv and 40 and 60 ppbv, respectively. Nighttime measurements along this branch of the distribution show a wider range of ΣAN, between 0.05 and
0.8 ppbv with the same range of Oxmixing ratios as the daytime measurements. Data
25
points along the vertical branch of the “L-shape” distribution show measurements made during daytime and nighttime, with daytime measurements showing low aerosol load-ing. The third population of data points, with Ox mixing ratios less than approximately
ACPD
13, 1795–1853, 2013Ozone photochemistry in
boreal biomass burning plumes
M. Parrington et al.
Title Page
Abstract Introduction
Conclusions References
Tables Figures
◭ ◮
◭ ◮
Back Close
Full Screen / Esc
Printer-friendly Version Interactive Discussion
Discussion
P
a
per
|
Dis
cussion
P
a
per
|
Discussion
P
a
per
|
Discussio
n
P
a
per
Ontario and show a narrower range of Ox (25–30 ppbv) for ΣAN between 0.05 and
0.4 ppbv. The higher mixing ratios ofΣAN in this population (>0.15 ppbv) were
asso-ciated with high aerosol loading. Straight lines fitted using a non-linear least squares method to each population of data points in Fig. 8a provide an indication of the poten-tial for ozone formation relative to ΣAN. For relatively fresh biomass burning plumes
5
measured on flight B626 the slope of the fit is approximately 2 ppbv ppbv−1 (i.e. two Ox molecules are produced for every molecule of ΣAN). The gradient increases to
approximately 8 ppbv ppbv−1 for the plume measurements with photochemical ages less than 4 days and with high aerosol loading, and approximately 473 ppbv ppbv−1for the plume measurements with photochemical ages greater than 5 days and with low
10
aerosol loading. The change in the relationship between Ox andΣAN with plume
pho-tochemical age observed during BORTAS is consistent with that observed in pollution outflow from Mexico City by Perring et al. (2010) in which slopes of the lines of best fit to aircraft measurements in the outflow increased from approximately 16 ppbv ppbv−1 to 89 ppbv ppbv−1as the plume age increased from less than 10 h to between 40 and
15
50 h.
Figure 8b shows the distribution of Ox relative to the surrogate species NOz (=
NOy−NOx), representing the photooxidation products of reactive nitrogen species
(i.e. NOx). The data are filtered for daytime/nighttime and aerosol loading as in Fig. 8a.
As with Fig. 8a, the distribution of Oxrelative to NOzshows three main populations of
20
data points with the measurements made on all BORTAS research flights other than flight B626 forming a distinctive “L-shape” distribution (Oxmixing ratios>30 ppbv) with
higher values of NOzcorresponding to lower Ox and lower values of NOz correspond-ing to higher Ox. In this case, the highest values of NOz (mixing ratios>2 ppbv) were
generally made during the daytime in plume air with high aerosol loading.
Measure-25
ments made at nighttime in plume air with low aerosol loading generally have lower NOz mixing ratios (<2 ppbv) although a significant number of data points flagged as
daytime and high black carbon have similar values of NOz. The range of Ox mixing
ACPD
13, 1795–1853, 2013Ozone photochemistry in
boreal biomass burning plumes
M. Parrington et al.
Title Page
Abstract Introduction
Conclusions References
Tables Figures
◭ ◮
◭ ◮
Back Close
Full Screen / Esc
Printer-friendly Version Interactive Discussion
Discussion
P
a
per
|
Dis
cussion
P
a
per
|
Discussion
P
a
per
|
Discussio
n
P
a
per
|
the “L-shape” distribution in Fig. 8, i.e. between 40 and 60 ppbv. Measurements made with low aerosol loading lie along the vertical branch of the “L-shaped” distribution with NOz mixing ratios between 0 and 0.5 ppbv and ozone mixing ratios between 40 and
90 ppbv. The third population, with Ox mixing ratios less than 30 ppbv corresponds to
measurements made during flight B626 over Northwestern Ontario. These
measure-5
ments show the same range of Oxmixing ratios as in Fig. 8 but with a smaller relative
range of NOz (0.1–0.5 ppbv) compared to the range of ΣAN. The slopes of straight
lines fitted using a non-linear least squares method to the three populations of data points in Fig. 8b are consistent with the slopes calculated in Figs. 7d and 8a. The slopes of the change in Oxrelative to the change in NOz(i.e. the number of molecules
10
of Ox formed per molecule of NOx that undergoes photo-oxidation) are calculated to be 0.07 ppbv ppbv−1 for flight B626, 1.61 ppbv ppbv−1 for plume air with high aerosol loading, and 155.07 ppbv ppbv−1 for plume air with low aerosol loading. It should be noted that ozone production efficiency calculated in this way represents an upper limit
due to potential loss of ozone and NOy species from the plume air due to wet and dry
15
deposition (e.g. Wang et al., 1996; Rickard et al., 2002).
The distribution of Ox relative to NOzin Fig. 8b indicates a linear relationship for the
different plume air masses and provides a measure of ozone production efficiency. The
ratio of Oxand NOzenhancements relative to background values (i.e.∆Ox/∆NOz) are
calculated from the BAe-146 measurements to indicate the ozone production efficiency
20
for all data points throughout the BORTAS measurement campaign. Figure 9 shows the distribution of ∆Ox/∆NOz ratios relative to NOx mixing ratios in boreal biomass
burning plumes. The measurements are filtered for daytime/nighttime and high/low aerosol loading as in Fig. 8. Measurements made in plume air with high aerosol loading (red closed diamonds in Fig. 9) typically have ozone production efficiencies less than
25
70 ppbv ppbv−1with NOxmixing ratios ranging from 0.05 and 0.6 ppbv. Measurements
with low aerosol loading have higher ozone production efficiencies with ∆Ox/∆NOz
ACPD
13, 1795–1853, 2013Ozone photochemistry in
boreal biomass burning plumes
M. Parrington et al.
Title Page
Abstract Introduction
Conclusions References
Tables Figures
◭ ◮
◭ ◮
Back Close
Full Screen / Esc
Printer-friendly Version Interactive Discussion
Discussion
P
a
per
|
Dis
cussion
P
a
per
|
Discussion
P
a
per
|
Discussio
n
P
a
per
a clear distinction between higher (>0.1 ppbv) and lower (<0.1 ppbv) NOxmixing ratios with higher values corresponding to the nighttime measurements. The measurements made on flight B626 over Northwestern Ontario have low ozone production efficiencies
less than 30 ppbv ppbv−1over a similar range of NOxmixing ratios as the high aerosol measurements. The changes in ozone production efficiency relative to NOxfor the two
5
populations of data points defined by the aerosol loading indicates that plume mea-surements were made under two different chemical regimes. For the measurements
made on flight B626 and those made during daytime with high aerosol loading, the large range of NOx mixing ratios and small change in the ∆Ox/∆NOz ratio are
indica-tive of a more VOC-limited regime. For the low aerosol loading measurements, the
10
much narrower range of NOxmixing ratio and larger change in the∆Ox/∆NOzratio are
indicative of a more NOx-limited regime.
Figure 10 shows the distributions of relative humidity (RH) and aircraft altitude rel-ative to the ∆Ox/∆NOz ratio partitioned for nighttime/daytime and high/low aerosol
loading as described above. Figure 10a shows that the measurements made with
15
ozone production efficiency less than 70 ppbv ppbv−1 are typically characterised by
higher relative humidity (>40 %) than the measurements with ozone production effi
-ciency higher than 70 ppbv ppbv−1(RH typically<40 %). The relationship between RH and the ∆Ox/∆NOz ratio shows no distinction between daytime and nighttime
mea-surements. Figure 10b shows vertical distribution of RH measured in boreal biomass
20
burning plumes throughout the campaign. In general measurements with low aerosol loading and low RH were made at higher altitudes (>3 km) during both daytime and nighttime. Interestingly, measurements with high aerosol loading and high RH but low ozone forming potential were not solely made at lower altitudes but across the entire vertical range of the measurements, from 0.5 to 7 km.
25
4.3.2 Photostationary steady state and instantaneous ozone production
ACPD
13, 1795–1853, 2013Ozone photochemistry in
boreal biomass burning plumes
M. Parrington et al.
Title Page
Abstract Introduction
Conclusions References
Tables Figures
◭ ◮
◭ ◮
Back Close
Full Screen / Esc
Printer-friendly Version Interactive Discussion
Discussion
P
a
per
|
Dis
cussion
P
a
per
|
Discussion
P
a
per
|
Discussio
n
P
a
per
|
quantify the relative contributions of NOx and other peroxy radicals to the ozone pro-duction efficiency. From Reactions (R1) and (R2) and assuming photostationary steady
state (i.e. the loss of ozone via Reaction R1 is equal to the production of ozone via Re-action R2), the following ratio can be defined:
Φ = jNO2[NO2]
kNO+O3[NO][O3]
(1)
5
where Φ is known as the photostationary ratio, [X] represents the concentration of
species X,jNO2 is the photolysis rate of NO2 in units of s
−1
, and kNO+O3 is the kinetic
rate coefficient for the reaction between NO and O3 in units of molecules cm−3
s−1. The value of kNO+O3 was calculated along the aircraft flight track using the
recom-mended IUPAC definition of 1.4−12exp(−1310/T) (Atkinson et al., 2004) where T is
10
the air temperature measured from the aircraft. The photostationary ratio would have a value of unity if chemical cycling between ozone and NOxwas the only process
oc-curring (Leighton, 1961; Cantrell et al., 2003; Griffin et al., 2007). Deviations of this ratio
from unity therefore give an indication of the influence of other chemical processes, for example, interaction between NO and families of organic peroxy radicals (ROx) and
hy-15
dro peroxy radicals (HOx), we generalise these families of peroxy radicals as HOxROx following Cantrell et al. (2003).
Figure 11 shows plots of photostationary steady state calculations made with the BORTAS aircraft measurements in biomass burning plumes over the course of the campaign. The photostationary ratio defined above is calculated from the measured
20
values of each parameter in Eq. (1). Figure 11a shows the photostationary ratio versus NOxmixing ratio with symbols denoting measurements made during daytime/nighttime and high/low aerosol as defined above. The calculated ratios for all the plume data points show a wide range of values between 0 and 10. Ratios for the measurements made at nighttime or with low aerosol loading generally lie in a narrower range from
25
ACPD
13, 1795–1853, 2013Ozone photochemistry in
boreal biomass burning plumes
M. Parrington et al.
Title Page
Abstract Introduction
Conclusions References
Tables Figures
◭ ◮
◭ ◮
Back Close
Full Screen / Esc
Printer-friendly Version Interactive Discussion
Discussion
P
a
per
|
Dis
cussion
P
a
per
|
Discussion
P
a
per
|
Discussio
n
P
a
per
The measurements made during daytime and with high aerosol generally have pho-tostationary ratios greater than 2 with a wide range of values extending as high as 10. Figure 11b also shows the calculated photostationary ratio but as a function of the ratio NOx/NOy. Note that the expression defining NOz (i.e. NOz=NOy−NOx) can
be rewritten as NOz=NOy(1−NOx/NOy) in which the term (1−(NOx/NOy)) can be
5
considered as a measure of the photochemical age of the air mass (i.e. the fraction of the initial NOx emitted that has been converted into photooxidation products, as NOy
represents total NOx emissions) (Olszyna et al., 1994). Values of NOx/NOy closer to unity are therefore representative of fresher emissions because there has been less photochemical processing of NOx. In general the BORTAS plume measurements have
10
a range of NOx/NOyvalues between 0.0 and 0.4 indicating relatively aged air masses. This is perhaps not all that surprising given that the majority of the BORTAS measure-ments were made downwind of biomass burning source regions in Central Canada. The data points in Fig. 11 with NOx/NOy values greater than 0.4 are measurements made on flight B626 over Northwestern Ontario indicating that fresher air masses were
15
encountered closer to one of the main source regions. The measure of air mass pho-tochemical age from the ratio of NOx/NOy is shown relative to the surrogate species NOz in Fig. 11c. Measurements with NOzmixing ratios less than 1 ppbv were made in
both fresh and aged plumes with the fresher plumes (NOx/NOy>0.4) all having higher
aerosol loading. Measurements with NOz mixing ratios greater than 1 ppbv were all
20
made in aged plumes (NOx/NOy<0.2).
Using the measurements used to calculate the photostationary ratio, and including an additional term for the reaction of NO with peroxy radicals in Eq. (1) (Cantrell et al., 2003; Griffin et al., 2007) a photostationary ratioΦHO
xROx can be defined:
ΦHO
xROx=
jNO2[NO2]
kNO+O
3[NO][O3]+kNO+HO2[NO][HOxROx]
(2)
25
where kNO+HO2 is the kinetic rate coefficient for the reaction between NO and HO2,