55 http://biology.num.edu.mn
http://mjbs.100zero.org/ Volume 13(1-2), 2015
Mongolian Journal of Biological
Sciences
ISSN 2225-4994 (online edition)
MJBS
Original Ar• cle
http://dx.doi.org/10.22353/mjbs.2015.13.07
Simulations of Radioactive Decays: an Application of
Low-Energy Electromagnetic Packages for the Nuclear
Medicine
Munkhbaatar Batmunkh
1, 2,*, Oleg V. Belov
1, Oidov Lhagva
2, Lkhagvaa
Bayarchimeg
1, Minjgee Minjmaa
3and Purev Battogtokh
21Laboratory of Radiation Biology, Joint Institute for Nuclear Research, Joliot-Curie street 6, 141980 Dubna,
Moscow region, Russia
2Division of Natural Sciences, National University of Mongolia, University street 1, 210646 Ulaanbaatar,
Mongolia
3Department of Radiation oncology, National Cancer Center, Nam Yan Ju Str, Bayanzurkh district, 210648
Ulaanbaatar, Mongolia
Abstract
Key words: Medical radionuclides, Geant4, stochastic energy depositions, DNA damage
Article information:
Received: 18 Apr. 2014 Accepted: 07 Dec. 2015 Published: 11 Dec. 2015
Correspondence*: [email protected]
Cite this paper as:
Problems of the radiobiology and the nuclear medicine require clarifying the specifi cs of radionuclides interactions with unhealthy cells. In this work we aimed to simulate emitting particles tracks of radionuclides and their radioactive decays at DNA level inside the cell nucleus. Accordingly, using the Monte Carlo-based track structure simulation technique, we estimated the radial distribution of deposited energy and kinetic energy spectra of electrons produced by primary particles resulting from radioactive decays of diff erent radionuclides within cell nucleus. To address the possibility of DNA damage, we performed the cluster analysis of track structures of emitted particles inside the volumes corresponding to the size of the native double-stranded DNA. For this purpose, G4-RadioactiveDecay and low-energy electromagnetic packages form Geant4 Monte-Carlo toolkit were combined together. Besides, a comparative analysis was performed for various low-energy electromagnetic packages as G4-DNA and G4-Livermore.
Batmunkh, M., Belov, O. V., Lhagva, O., Bayarchimeg, L., Minjmaa, L. & Battogtokh, P. 2015. Simulations of radioactive decays: an application of low-energy electromagnetic packages for the nuclear medicine. Mong. J. Biol. Sci.,13(1-2): 55-64.
Introduction
Radiation interaction with tissues and track structure of particles in various kinds of substances are found with wide applications in radiotherapy of brain tumors, radiation protection, nuclear physics and space radiobiology. Motivated primarily by the interest to use the radionuclide emissions in the treatment (or to kill) of tumors (thyroid carcinoma, metastatic tumors) and directly killing the sparing cells. Nowadays Monte Carlo simulations has turned out to be useful and common applicable in utilizing and developing
In this work, we simulated the decays of Iodine (125I) and Bismuth (213Bi) radionuclides distribution inside the spherical model of the cell nucleus. For this purpose, we integrated G4-DNA
low-energy electromagnetic package with the
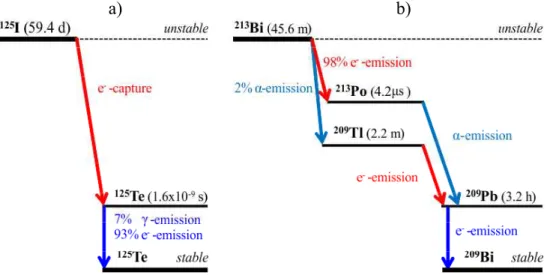
G4-RadioactiveDecay model at nuclear level and which are both fully included in Geant4 toolkit (Agostinelli et al., 2003; Allison et al. 2006). The radionuclide 125I is mainly used for treating thyroid cancer and imaging the thyroid at higher abundance (Li, 2001, 2002; Booz et al., 1987; Toncrova, 2005). 125I with the half-life of 59.4 days emits electron and photons producing the daughter 125Te (Tellurium) nuclide with the energy of 35.4 keV. Since 125Te is an excited state possessing the half-life of 1.6×10⁻⁹ seconds, it undergoes further decay proceeding to the stable state of nonradioactive 125Te nuclide with zero energy. This transition is characterized by 7% of gamma emission and 93% of internal conversion. An example of 125I radioactive decay is shown in Fig. 1a. The second radionuclide 213Bi is a radioisotope also commonly used for nuclear medicine. In fact, it is used in radioimmunology to treat patients with leukemia, lymphomas, as well as for micrometastatic carcinomas (Dadachova, 2008). It has unique nuclear properties such as a short 45 minutes half-life and high energy (around 8.4 MeV) alpha-particle emission with a high linear energy transfer. A scheme of the 213Bi radionuclide decay is shown in Fig. 1b. In this decay chain, 213Bi (83 protons, 130 neutrons) disintegrates about 98 % by 444 keV electron (beta-minus) emission resulting in 213Po (84 protons, 129 neutrons) and about 2 % through the alpha decay with energy of 5.9 MeV resulting in 209Tl (81 protons, 128
neutrons). The daughter 213Po and 209Tl nuclides are the excited states with the half-life of 4.2 µs and 2.2 min. At the next step these nuclides transform to the unstable 209Pb (82 protons, 127 neutrons) by alpha and beta emission with energies of 8.4 MeV and 659 keV respectively. Finally 209Pb decays to the nonradioactive stable 209Bi (83 protons, 126 neutrons) by emission of 198 keV beta particles.
Materials and Methods
Simulation of the radioactive decays. Radioactive decay is a stochastic physics process where an atom with unstable nuclei transmutes into daughter nuclides of loses or gains a neutron or a proton by emitting particles of ionizing radiation. This physics processes does not require external interactions for radioactive decays schemes mentioned in Figure 1.
Monte-Carlo-based technique for simulation of radioactive decay is available in the extended example named rdecay01 of Geant4 toolkit. It is based on data taken from Evaluated Nuclear Structure Data File (ENSDF) (Tuli, 1996). This example demonstrates the use of some basic features of G4-RadioactiveDecay hadronic package which allows displaying counts of created particles, their kinetic energies, time of life, and activity of individual decays (Truscott et al., 2000).
In the present study, we have adapted low-energy electromagnetic process and a simple spherical model of the tumor cell nucleus with the diameter of 1 μm to this Geant4 code. The radionuclides were placed in the center of cell nucleus.
Figure 1. Radioactive decay schemes of the 125I (panel a) and the 213Bi (panel b) radionuclides.
Track structure calculations and cluster analysis.The track structures of particles emitted in 125I and 213Bi radioactive decays are calculated by the G4-DNA and G4-Livermore low-energy electromagnetic packages assuming the random distribution of the particles inside the cell nucleus. The G4-DNA package is an extension of standard
Geant4 toolkit for simulating the physical and radiobiological processes at cellular and nanometer scales (Agostinelli et al., 2003; Allison
et al., 2006).
The physics of atomic interaction are characterized by the processes of ionization, excitation (electronic and vibrational), molecular attachment and elastic scattering for emitted electrons and photons. Ionization, excitation, and charge transfer were taken into account for emitted protons and alpha particles. Decays of both radionuclides are simulated with lower cut off energies of 7.4 eV for electrons. Besides, G4-Livermore package: photo-electric eff ect, Compton and Rayleigh scattering, gamma conversion for photons, ionization, multiple scattering for electrons and positrons, and production threshold value of low energy emission down to 250 eV.
In our simulation code, spatial energy depositions of stochastic traveling emitted particles are defi ned in the points with coordinates corresponding to each particle interaction in the cell nucleus. This allows estimating the distribution of energy depositions along the radius of nucleus as well as the energy spectrum of emitted particles and distribution of the specifi c energy (i.e., dose deposit). The specifi c energy z
which is also sometimes called deposited dose in
cell nucleus can be calculated by z = εi / ρV, where εi is the energy imparted defi ned by the sum of all energy depositions to nucleus solid in a given volume caused by a single event (ICRU Report 86, 2011). In our calculations, ρ is the density of liquid water equaling to 1 g cm–3 and V is the
volume of spherical model representing the cell nucleus (V = 4.18 µm3).
To address the possibility of DNA damage, we also performed the cluster analysis of track structures of emitted particles at nanometer scale. For this purpose we used the cluster analyzing algorithm developed earlier (Batmunkh et al., 2013). The diameter of all produced clusters was set to be 2 nm that corresponds to the diameter of the native double-stranded DNA. This enables estimating the frequency distribution of particles aff ecting DNA and calculating the number of DNA segments hit by particles.
Results and Discussion
Track structures of radioactive decays.
For estimation of quantities referred to energy deposition, we simulated track structures of 1000 decays from each of 125I and 213Bi
radionuclides. An example of 125I radionuclide
decay simulations for the lesser number of events equaling to 10 is shown in Fig. 2. Here, both low-energy electromagnetic packages G4-DNA and G4-Livermore were compared fortrack structures decays of emitted particles products from a radionuclide. The depicted 10-event track structures are characterized by the numerical results presented in Tables 1–3. The parameters
Figure 2. The track structures of emitted particles from radioactive decays of 10 events for radionuclide 125I. These estimations are performed using the both low-energy electromagnetic packages of G4-DNA (panel a) and
G4-Livermore (panel b). The cell nucleus is computed as violet spherical solid with 1 μm diameter and nuclear membrane is represented as gray-line connected elliptical volume. The red and green line is emitted electrons and photons. Track structures of energy depositions within and outside cell nucleus were simulated down to the nanometer scale and that’s represented as black dots.
Table 1. The number of emitted particles generated during calculations and their mean energy.
Type of the particle
125I 213Bi
Number of emitted particles
Mean energy of emitted particles (keV)
Number of emitted particles
Mean energy of emitted particles (keV)
Type of the process
G4-DNA
G4-Livermore G4-DNA
G4-Livermore
G4-DNA
G4-Livermore G4-DNA
G4-Livermore
e– 1694 20 0.056 4.75 28658 358 0.24 19.36
γ 1 1 35.49 35.49 3 6 440.5 658.4
υe– 10 10 150.3 150.3 -
-ῡe– - - 20 20 656.6 624.2
α - - 12 10 8368 8126
α+ - - 2 - 8325
-He - - 1 - 8365
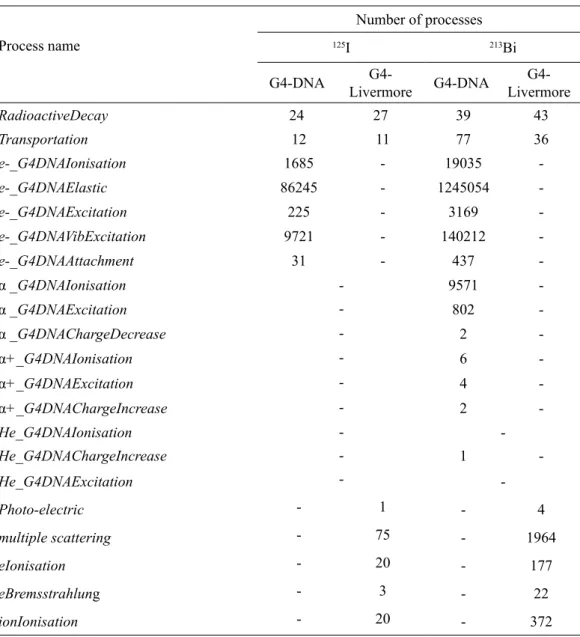
-Table 2. The number of physical processes generated by Geant4 for the emitted particles.
Process name
Number of processes
125I 213Bi
G4-DNA
G4-Livermore G4-DNA
G4-Livermore
RadioactiveDecay 24 27 39 43
Transportation 12 11 77 36
e-_G4DNAIonisation 1685 - 19035
-e-_G4DNAElastic 86245 - 1245054
-e-_G4DNAExcitation 225 - 3169
-e-_G4DNAVibExcitation 9721 - 140212
-e-_G4DNAAttachment 31 - 437
-α _G4DNAIonisation - 9571
-α _G4DNAExcitation - 802
-α _G4DNAChargeDecrease - 2
-α+_G4DNAIonisation - 6
-α+_G4DNAExcitation - 4
-α+_G4DNAChargeIncrease - 2
-He_G4DNAIonisation -
-He_G4DNAChargeIncrease - 1
-He_G4DNAExcitation -
-Photo-electric - 1 - 4
multiple scattering - 75 - 1964
eIonisation - 20 - 177
eBremsstrahlung - 3 - 22
which were scored include the number of emitted particles and their kinetic energies, counts of physical processes generated during calculations of 125I and 213Bi decays respectively, the mean deposited energy, and the mean dose deposit, D
represented as the specifi c energy z. The numerical results and plots depicting the track structures were obtained with the ROOT object-oriented data analysis framework (Brun et al., 1997).
Cluster analysis. Limiting the space by the size of cell nucleus we calculated the frequency distribution of cluster sizes from all particles’ track structures. Here the cluster size is considered as the number of ionizations inside the spherical volume equaling to diameter of the native double-stranded DNA. Fig. 3a shows the distributions computed for 125I and 213Bi. These results show that the most probable cluster size for the concerned nuclides equals to 3 ionizations inside.
This is enough to produce more than one complex DNA lesion including double-strand breaks. In this regard, our data is in agreement with fi ndings reviewed in (Elmroth et al., 2005).
Furthermore, the curve obtained for 213Bi has a pronounced plateau indicating the formation of clusters with the higher number of ionizations equaling to ~24–30. In contrast with this, 125I demonstrates the diff erent pattern of distribution for cluster sizes greater than 20.
Along with the cluster analysis, we estimated the total energy deposited in produced clusters (Fig. 3b). The plot demonstrates that number of created clusters is directly related to deposited energy in created clusters. Accordingly, decreases energy deposition when increases cluster size, but to compare number of clusters, the broader distributions and highly-localized energy deposition in higher cluster size. In the case of Table 3. The mean values of deposited energy ( ), dose deposit (D), and mean specifi c activity as estimated in calculations. Specifi c activity is defi ned as an activity per unit of mass of the primary radionuclide. Activity of radioactive decay is expressed as the number of atoms that decay per unit of time. The value of radioactive decay is expressed here in Ci (Curie) [1 Ci = 3.7×10¹⁰ Bq].
Parameter
125I 213Bi
G4-DNA
G4-Livermore G4-DNA G4- Livermore
, keV 2.98 ±0.96 3.41 ±1.21 216.22 ±12.27 218.91 ±16.34
D, Gy 0.14 ±0.03 1.13 ±0.05 8.47 ±0.04 8.37 ±0.09
Mean specifi c activity, Ci/g 2.23×10⁴ 1.14×10⁴ 2.65×10⁷ 2.09×10⁷
Figure 3. Cluster size distribution (panel a) and distribution of total deposited energy deposited to each created cluster (panel b) in the case of 125I and 213Bi radionuclides. The cluster diameter is set to be 2 nm.
213Bi, localized energy deposition is lower on 1-2 ionizations in cluster and also higher-broader distributions appearing in cluster size more 3 than for 125I.
As above results, we demonstrated that DNA lesions strongly depends on ionization density of higher charged radionuclides. In Fig. 2, we can see that when enable G4-DNA, emitted particles tracks and energy deposits turned out to be distributed more densely than G4-Livermore. A comparative analysis of cluster analysis was performed for G4-DNA and G4-Livermore packages, that shown in Fig. 4. For G4-DNA package, cluster size is higher-broader frequently and total deposited energies have broader distribution in comparison to
G4-Livermore package. This broader distributions and highly-localized energy depositions for each emitted particle in cell nucleus were directly correlated to complex types of DNA lesions.
For G4-Livermore, deposited energy and cluster number are most probable at a cluster of 1 ion, and number of created cluster was fewer. It’s produced to be single-strand or base damage of DNA lesions. In fact, emitted particles and energy depositions was distributed very scarcely for G4-Livermore. Therefore, track structure simulation at nanometer scale need to enable G4-DNA package in furthermore. In contrary, mean energy and dose deposit in cell nucleus were closely equal in the both packages as shown in Table 3.
Figure 4. Distributions of cluster size (ions) (panel a) and distribution of total deposited energy of each created cluster (panel b) in the case of 125I radionuclide, emitted particles generated by G4-DNA and G4-Livermore
packages.
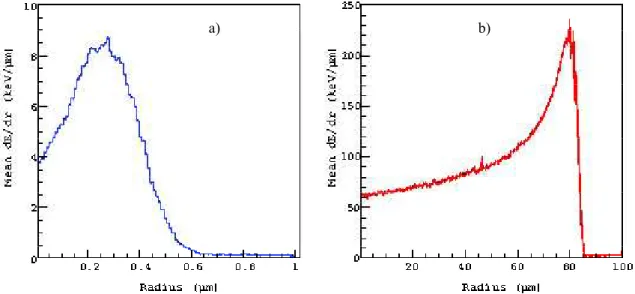
Figure 5. The radial distribution of energy deposited inside the cell nucleus along trajectories of all emitted particles. The results are represented per event of 125I (panel a) and 213Bi (panel b) decay. The radial energy deposition gets
more at 0.3 µm in radius for 125I decays, and for 213Bi decay increase in ionization density is seen at the end of
emitted particles, which also known as Bragg curve and peak occurs about 80 µm in radius.
a) b)
Radial distribution of energy deposition.
In our study, we also computed the radial distribution of energy deposited inside the cell nucleus along all trajectories of emitted particles of both radionuclides (Fig. 5). Depicted curves characterize the so-called longitudinal energy profi le, or depth dose distribution of emitted particles calculated with the G4-DNA package. The comparison of the data obtained for two nuclides shows that 125I delivers the maximal energy at the radius of about 0.3 µm while 213Bi demonstrates a more expanded pattern of energy deposition with the peak within the radius of about 0.3 µm. Considering the eff ect from a single nuclide, these facts suggest that 125I is more convenient to precise killing of individual tumor cells with minimal damage to neighboring ones
whereas 213Bi can be eff ectively used for micro metastases representing lager objects with the radius of up to 80 µm.
Physical characteristics of 125I and 213Bi
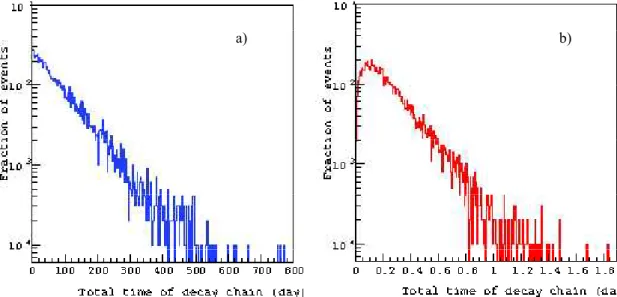
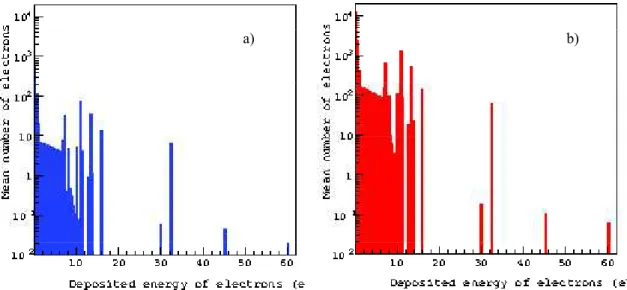
decays. In this section, we report the comparison of several physical characteristics of decays of two radionuclides. We calculated the total life-time of decay chain per event for both radionuclides (Fig. 6) and estimated the kinetic energy spectrum of primary electrons from 1000 decays of each radionuclide (Fig. 7) and the distribution of spatial energy deposition of portion of their electrons emitted only inside the cell nucleus (Fig. 8). In the case of 213Bi, more electrons of high kinetic and deposited energies are generated, which leads to the shorter life time than for 125I. The results on calculation of the kinetic energy spectrum and the
Figure 7. Kinetic energy spectrum of primary electrons per event of 125I (panel a) and 213Bi (panel b) decay.
Figure 6. The total life time of decay chain of 125I (panel a) and 213Bi (panel b) radionuclides.
a) b)
total electron energy deposition of 125I decay were compared with Monte Carlo simulations of other authors (Li et al., 2001; Booz et al., 1987).
Our simulations enabled to obtain the spectrum of specifi c energy in 125I and 213Bi decays inside the cell nucleus (Fig. 9). To estimate the mean specifi c energy, we applied a Gaussian fi t to the computed data. It gave the mean value of 0.14 ±0.03 Gy for 125I and 8.47±0.04 Gy for 213Bi decay. According to defi nition of the absorbed dose (ICRU Report 86, 2011) these values can be considered as the dose absorbed inside the cell nucleus. From our estimations it can be also concluded that 125I may deliver smaller dose with lover probability than 213Bi.
Conclusion
We developed the combined package for simulation the track structures of particles emitting from radionuclides placed inside a cell nucleus. The simulation code integrates
G4-RadioactiveDecay and G4-DNA (and also
G4-Livermore) sub-packages of Geant4 toolkit (version 9.6). Using this approach, we estimated the spatial distribution of energy deposition from decays of 125I and 213Bi radionuclides placed inside the cell nucleus. In particular, the radial distribution of deposited energy along the radius of cell nucleus was estimated, which is most important for directly tumor cell killing. In our
Figure 8. The spatial distribution of energy deposition per event of emitted electron inside the cell nucleus from
125I ( panel a) and 213Bi (panel b) decays.
Figure 9. The spectrum of the specifi c energy per event in the cell nucleus, adjusted to Gaussian distribution. Panel a shows the distribution for decay of 125I; panel b represents the distribution for decay 213Bi.
a) b)
analysis, we also calculated the total life-time of decay chain per decay, kinetic energy spectrum of the emitted electrons and total deposited energy per decay. Our simulations are in the concordance with the data indicating that 213Bi exhibits a shorter time of decay chain than 125I.
In our analysis, we performed the cluster analysis of spatial distribution of energy deposition from particles emitted inside the 1
μm-diameter cell nucleus. In order to address the possibility of DNA damage, we calculated the frequency distribution of emitted particles using the cluster size of 2 nm, which corresponds to the diameter of the native double-stranded DNA helix. Our calculations demonstrate that for 213Bi the probability of ionization inside a cluster is higher than for 125I. 213Bi also exhibits the broader distribution of energy deposition in clusters than 125I. A comparative analysis of cluster analysis
was performed for G4-DNA and G4-Livermore
packages. We was illustrated that when enable
G4-DNA, emitted particles tracks and energy deposits turned out to be distributed more densely and cluster size and total deposited energies per cluster have broader distribution than G4-Livermore. As the results, appeared DNA lesions strongly depends on ionization density.
Our study suggests that the package we use may be utilized in solving not only radiation research problems, but it also may have wide applications in educational and practical purposes.
Acknowledgements
The authors would like to thank academician E. A. Krasavin, director of the JINR Laboratory of Radiation Biology and Dr J. Davaasambuu, director of the Department of Science and Technology MECS, Government of Mongolia for their permanent attention and support.
References
Agostinelli, S., Allison J., Amako K., Apostolakis J., Araujo H., Arce P., Asai M., Axen D., Ba-nerjee S., Barrand G., Behner F., Bellagamba L., Boudreau J., Broglia L., Brunengo A., Bur-khardt H., Chauvie S., Chuma J., Chytracek R., Cooperman G., Cosmo G., Degtyarenko P., Dell’Acqua A., Depaola G., Dietrich D., En-ami R., Feliciello A., Ferguson C., Fesefeldt H., Folger G., Foppiano F., Forti A., Garelli
S., Giani S., Giannitrapani R., Gibin D., Gó-mez Cadenas, J. J., González, I., Gracia Abril, G., Greeniaus, G., Greiner, W., Grichine, V., Grossheim, A., Guatelli, S., Gumplinger, P., Hamatsu, R., Hashimoto, K., Hasui, H., Heik-kinen, A., Howard, A., Ivanchenko, V., John-son, A., Jones, F. W., Kallenbach, J., Kanaya, N., Kawabata, M., Kawabata, Y., Kawaguti, M., Kelner, S., Kent, P., Kimura, A., Kodama, T., Kokoulin, R., Kossov, M., Kurashige, H., Lamanna, E., Lampén, T., Lara, V., Lefebure, V., Lei, F., Liendl, M., Lockman, W., Lon-go, F., Magni, S., Maire, M., Medernach, E., Minamimoto, K., Mora de Freitas, P., Morita, Y., Murakami, K., Nagamatu, M., Nartallo, R., Nieminen, P., Nishimura, T., Ohtsubo, K., Okamura, M., O’Neale, S., Oohata, Y., Paech, K., Perl, J., Pfeiff er, A., Pia, M.G., Ranjard, F., Rybin, A., Sadilov, S., Di Salvo, E., Santin, G., Sasaki, T., Savvas, N., Sawada, Y., Scherer, S., Sei, S., Sirotenko, V., Smith, D., Starkov, N., Stoecker, H., Sulkimo, J., Takahata, M., Tanaka, S., Tcherniaev, E., Safai Tehrani, E., Tropeano, M., Truscott, P., Uno, H., Urban, L., Urban, P., Verderi, M., Walkden, A., Wander, W., Weber, H., Wellisch, J. P., Wenaus, T., Wil-liams, D. C., Wright, D., Yamada, T., Yoshida, H. & Zschiesche, D. 2003. Geant4 a simulation toolkit. Nucl. Instr. Meth. A.. 506: 250–303. Allison, J., Amako, K., Apostolakis, J., Araujo,
H., Dubois, P.A., Asai, M., Barrand, G., Capra, R., Chauvie, S., Chytracek, R., Cirrone, G.A.P., Cooperman, G., Cosmo, G., Cuttone, G., Daquino, G.G., Donszelmann, M., Dressel, M., Folger, G., Foppiano, F., Generowicz, J., Grichine, V., Guatelli, S., Gumplinger, P., Heikkinen, A., Hrivnacova, I., Howard, A., Incerti, S., Ivanchenko, V., Johnson, T., Jones, F., Koi, T., Kokoulin, R., Kossov, M., Kurashige, H., Lara, V., Larsson, S., Lei, F., Link, O., Longo, F., Maire, M., Mantero, A., Mascialino, B., McLaren, I., Lorenzo, P.M., Minamimoto, K., Murakami, K., Nieminen, P., Pandola, L., Parlati, S., Peralta, L., Perl, J., Pfeiff er, A., Pia, M.G., Ribon, A., Rodrigues, P., Russo, G., Sadilov, S., Santin, G., Sasaki, T., Smith, D., Starkov, N., Tanaka, S., Tcherniaev, E., Tome, B., Trindade, A., Truscott, P., Urban, L., Verderi, M., Walkden, A., Wellisch, J.P., Williams, D.C., Wright, D. & Yoshida, H. 2006. Geant4 developments and applications.
***** Amato, E., Italiano A., Minutoli F. & Baldari
S. 2013. Use of the Geant4 Monte Carlo to determine three-dimensional dose factors for radionuclide dosimetry. Nucl. Instrum. Meth. A., 708: 15–18.
Batmunkh, M., Bayarchimeg, L., Lkhagva, O. & Belov, O. 2013. Cluster Analysis of HZE Particle Tracks as Applied to Space Radiobiology Problems. Physics of Particles and Nuclei Letters, 10(7): 854–859.
Booz, J., Paretzke, H.G, Pomplun, E. & Olko, P. 1987. Auger-electron cascades, charged potential and microdosimetry of Iodine-125. Radiat. Environ. Biophys., 26: 151–162. Brun, R. & Rademakers, F. 1997. ROOT – An
object oriented data analysis framework.Nucl. Instrum. Meth. A., 389: 81–86.
Buscombe J.R.,2007. Radionuclides in the man-agement of thyroid cancer. Cancer Imaging, 7: 202–209.
Campos, L. 2008. Dosimetry in thyroid follicles due to low-energy electrons of iodine using the Monte Carlo method. Radiol. Bras., 41: 403–407.
Dadachova, E. 2008. Radioimmunotherapy of infection with 213Bi-labeled antibodies. Curr
Radiopharm., 1: 234–239.
Elmroth, K. & Stenerlow, B. 2005. DNA-incorporated 125I induces more than one double-strand break per decay in mammalian cells.Radiat. Res., 163: 369–373.
ICRU Report 86. 2011. Quantifi cation
and Reporting of Low-Dose and Other Heterogeneous Exposures. Journal of the ICRU. 11( 2): 69 pp.
Fondell, A.2011. Two-step targeting for eff ective radionuclide therapy: Preclinical evaluation of 125I-labelled anthracycline delivered by tumour targeting liposomes, Digital Comprehensive Summaries of Uppsala Dissertations from the Faculty of Medicine. Uppsala: Acta Universitatis Upsaliensis, 708: 1651-6206. Li, W.B., Friedland, W., Pomplun, E., Jacob, P.,
Paretzke, H. & Lassmann. M. 2001. Track structures and dose distributions from decays of 131I and 125I in and around water spheres simula ting micrometastases of diff erentiated thyroid cancer.Radiat. Res., 156: 419–429. Li, W. 2002. Iodine-125 Induced DNA Strand
Breakage: Contributions of Diff erent Physical and Chemical Radiation Action Mechanisms.
Technische Universität München, Dissertation. Ton crova, H.2005. Simulation of DNA damages induced by incorporated 125I.Czech Technical University in Prague, Dissertation.
Tuli, J. 1996. Evaluated nuclear structure data
fi le, Nucl. Instrum. Meth. A. 369: 506–510.
Truscott, P., Fan, L., Dyer, C., Ferguson, C., Gurriaran, R., Nieminen, P., Daly, E., Apostolakis, J., Giani, S., Pia, M.G., Urban, L. & Maire, M. 2000. Geant4-a new Monte Carlo toolkit for simulating space radiation shielding and eff ects, Radiation Eff ects Data Workshop.