ACPD
9, 14059–14079, 2009In situ aerosol optics in Reno, NV, USA
M. Gyawali et al.
Title Page
Abstract Introduction
Conclusions References
Tables Figures
◭ ◮
◭ ◮
Back Close
Full Screen / Esc
Printer-friendly Version
Interactive Discussion Atmos. Chem. Phys. Discuss., 9, 14059–14079, 2009
www.atmos-chem-phys-discuss.net/9/14059/2009/ © Author(s) 2009. This work is distributed under the Creative Commons Attribution 3.0 License.
Atmospheric Chemistry and Physics Discussions
This discussion paper is/has been under review for the journalAtmospheric Chemistry and Physics (ACP). Please refer to the corresponding final paper inACPif available.
In situ aerosol optics in Reno, NV, USA
during and after the summer 2008
California wildfires and the influence of
aerosol coatings
M. Gyawali1, W. P. Arnott1, K. Lewis1, and H. Moosm ¨uller2
1
Physics Department, University of Nevada, Reno, Nevada System of Higher Education, 1664 N. Virginia Street, Reno, NV 89557, USA
2
Desert Research Institute, Nevada System of Higher Education, 2215 Raggio Parkway, Reno, NV 89512, USA
Received: 2 May 2009 – Accepted: 16 June 2009 – Published: 26 June 2009
Correspondence to: M. Gyawali (gyawalim@unr.nevada.edu)
ACPD
9, 14059–14079, 2009In situ aerosol optics in Reno, NV, USA
M. Gyawali et al.
Title Page
Abstract Introduction
Conclusions References
Tables Figures
◭ ◮
◭ ◮
Back Close
Full Screen / Esc
Printer-friendly Version
Interactive Discussion
Abstract
Hundreds of wildfires in Northern California were sparked by lightning during the sum-mer of 2008, resulting in downwind smoke for the months of June and July. Compar-isons are reported for aerosol optics measurements in Reno Nevada made during the very smoky summer month of July and the relatively clean month of August. Photoa-5
coustic instruments equipped with integrating nephelometers were used to measure aerosol light scattering and absorption at wavelengths of 405 nm and 870 nm, reveal-ing a strong variation of the aerosol light absorption with wavelength. Coated sphere calculations were used to show that ˚Angstr ¨om exponents of absorption (AEA) as large as 1.6 are possible even with non-absorbing organic coatings on black carbon cores, 10
suggesting care be exercised when diagnosing AEA. Insight on fuels burned is gleaned from comparison of AEA versus single scattering albedo (SSA) of the ambient mea-surements with laboratory biomass smoke meamea-surements for many fuels. Measure-ments during the month of August, which were largely unaffected by fire smoke, exhibit surprisingly low AEA for aerosol light absorption when the SSA is highest, again likely 15
as a consequence of the underappreciated wavelength dependence of aerosol light absorption by particles coated with non absorbing organic and inorganic matter.
1 Introduction
Biomass burning is a significant global source of trace gases and particles in the atmo-sphere. Optical properties of aerosols emitted from biomass burning are highly uncer-20
tain due to the uncertainty in combustion factors, burned areas, and the types of fuels (Ito and Penner, 2004), the flaming and smoldering phase of burning, as well as rapidly changing atmospheric conditions (Chen et al., 2007; Hudson et al., 2004). Biomass burning aerosols grow upon aging due to coagulation and condensation and exhibit increased scattering coefficients (Johnson et al., 2008). Biomass burning aerosol sig-25
nificantly alter the Earth’s radiation by scattering and absorbing solar radiation (Chen et
ACPD
9, 14059–14079, 2009In situ aerosol optics in Reno, NV, USA
M. Gyawali et al.
Title Page
Abstract Introduction
Conclusions References
Tables Figures
◭ ◮
◭ ◮
Back Close
Full Screen / Esc
Printer-friendly Version
Interactive Discussion al., 2006; Lewis et al., 2008). Biomass burning has short and long term consequences
on the radiation budget (Naik et al., 2007), as the increased light scattering by particles cools the Earth’s surface but the increased CO2 warms the surface in the long term. Accelerating death rates of old forest trees may soon strongly impact short and long term atmospheric composition.
5
The wildfire activity in the western US has increased in recent decades mainly due to severe droughts and abundant fuels (Westerling et al., 2006). California is among the states that have the highest wildfire activity, generally starting mid-May and ending in October (Pfister et al., 2008). In summer 2008, Northern California lightning triggered most of 2780 individual fires observed, burning 4,686 km2(http://en.wikipedia.org/wiki/ 10
Summer 2008 California wildfires). At times, smoke from California wildfires can be observed moving from the west to east coast (Hoffet al., 2005).
In this study, in situ optical characteristics of summer 2008 California wildfire aerosols are reported and compared with those from urban pollution. A dual wavelength pho-toacoustic instrument operating simultaneously at 405 nm and 870 nm was used for 15
the measurement of aerosol light absorption and scattering (Lewis et al., 2008). The simultaneous measurement at these two wavelengths provides insight into the optical characteristics of black carbon (BC) or “soot”, potentially modified by non-absorbing organic carbon (OC) coatings and light absorbing organic carbon (LAOC) or “brown carbon” (BrC), the two main light absorbing carbonaceous substances in the atmo-20
sphere (Moosm ¨uller et al., 2009). The photoacoustic instrument draws sample air continuously through its acoustical resonator and illuminates it with power modulated laser radiation at the acoustic resonance frequency of the resonator. The heating of the particles takes place due to the absorption of laser radiation and the heat rapidly trans-fers to the surrounding air. The resulting periodic pressure fluctuations are measured 25
ACPD
9, 14059–14079, 2009In situ aerosol optics in Reno, NV, USA
M. Gyawali et al.
Title Page
Abstract Introduction
Conclusions References
Tables Figures
◭ ◮
◭ ◮
Back Close
Full Screen / Esc
Printer-friendly Version
Interactive Discussion whereas absorption due to BrC is stronger towards UV regions (Moosm ¨uller et al.,
2009). Hence multi wavelength measurements are needed to adequately address the absorption characteristics of carbonaceous aerosols in the atmosphere (Andreae and Gelencs ´er, 2006). Photoacoustic absorption measurements are not affected by filter matrix artifacts that can be complicated by organic coatings (Lack et al., 2008; Subra-5
manian et al., 2007)
In addition to truly light absorbing organic carbon (LAOC), the light absorption of BC can be enhanced by non-absorbing OC that will be referred to as apparently light absorbing carbon (ALAOC). It is easy to confuse LAOC and ALAOC. In LAOC black carbon cores are coated with organic matter that typically absorbs more strongly at 10
shorter wavelengths than at longer wavelengths. However, for ALAOC, it is acknowl-edged in this definition that there may be strong wavelength dependence in the light absorption amplification of a black carbon core by organic coatings that do not absorb light at all. Later work will refine the definition of the ˚Angstr ¨om exponent of absorption to clearly distinguish between ALAOC and LAOC, and it will be clearly shown that filter 15
based methods do not diagnose ALAOC well because particle bound OC can surround the filter media. Here, an investigation is performed to elucidate the likely error involved in naively interpreting ˚Angstr ¨om exponent of absorption measurements solely in terms of LAOC without considering ALAOC.
2 Measurements and analysis
20
Figure 1 shows a satellite image of the smoke extending from the northern California east, beyond Reno, NV on 10 July, which was the smokiest day of the summer 2008 in Reno, NV.
ACPD
9, 14059–14079, 2009In situ aerosol optics in Reno, NV, USA
M. Gyawali et al.
Title Page
Abstract Introduction
Conclusions References
Tables Figures
◭ ◮
◭ ◮
Back Close
Full Screen / Esc
Printer-friendly Version
Interactive Discussion
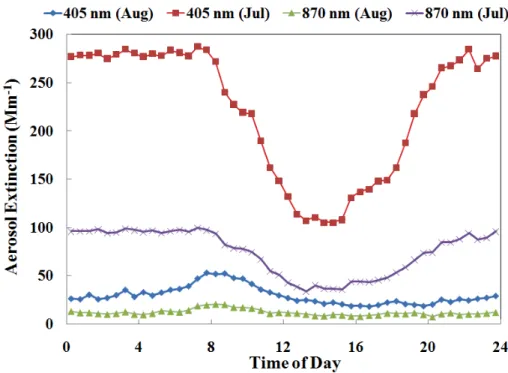
2.1 Aerosol extinction variation
The monthly averaged diurnal aerosol extinction (sum of absorption and scattering) as function of time of day is shown in Fig. 2 and indicates strong impacts of biomass aerosol in July compared to August at both 405 nm and 870 nm. The extinction for July shows a clear diurnal pattern, with aerosol extinction decreasing gradually after 5
8 AM due to the expansion of the boundary layer and increased wind speed diluting the plume. For August, a morning rush hour peak is observed from 6 AM to 11 AM coinciding with increased traffic volume at a time when boundary layer dilution is near its minimum and wind speeds are still low.
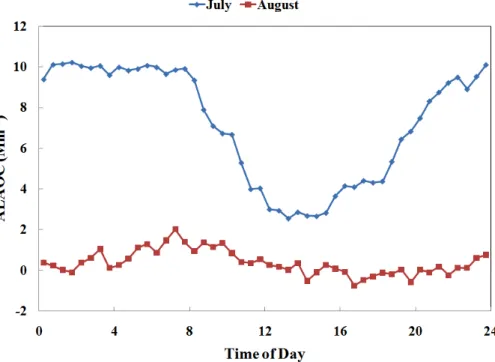
2.2 Naive estimate of LAOC: ALAOC
10
The apparent light absorption coefficient βALAOC due to organic carbon aerosol at 405 nm is conventionally written as
βALAOC =βabs(405 nm)−βabs(870 nm)∗870/405, (1)
whereβabs (405 nm) andβabs (870 nm) are the aerosol absorption coefficients at 405 and 870 nm, respectively. Here, the assumption is that BC absorbs both at 405 nm 15
and 870 nm whereas LAOC absorbs strongly at 405 nm and negligibly at 870 nm. The second term is the equivalent BC absorption at 405 nm assuming inverse wavelength dependence. Equation (1) acknowledges that some of the relative enhancement of absorption at 405 nm may be due to wavelength selective amplification by a non-absorbing organic coating, in addition to any contribution by organic carbon that may 20
ACPD
9, 14059–14079, 2009In situ aerosol optics in Reno, NV, USA
M. Gyawali et al.
Title Page Abstract Introduction Conclusions References Tables Figures ◭ ◮ ◭ ◮ Back Close
Full Screen / Esc
Printer-friendly Version
Interactive Discussion note as much as 10 Mm−1absorption due to ALAOC, suggesting that biomass burning
is the main source of ALAOC during our measurements.
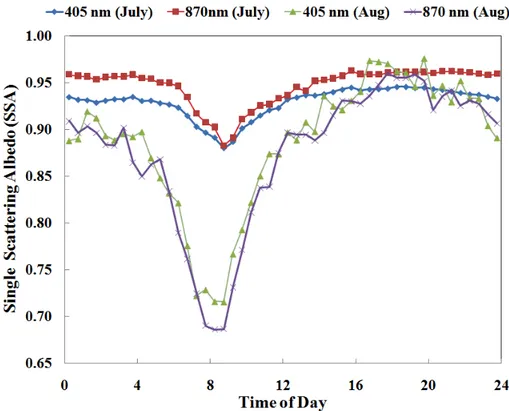
2.3 Single Scattering Albedo (SSA)
Single scattering albedo (SSA) is defined as the ratio of scattering coefficient to extinc-tion coefficient. Figure 4 illustrates the monthly averaged SSA for 405 nm and 870 nm. 5
It depicts the contrasts between SSA for the months of July and August where aerosol absorption is dominated by wildfire aerosols and vehicular emissions, respectively and highlights the different optical properties of the aerosols measured during this time pe-riod. It is noteworthy that the calculated SSA is consistently higher at 870 nm than at 405 nm during July where SSA at 870 nm varies from 0.88 to 0.96 and SSA at 405 nm 10
varies from 0.88 to 0.93. This can be attributed to the large proportion of LAOC in wildfire aerosol transport from California that preferentially absorbs radiation to the UV regions thereby lowering the SSA at 405 nm. Contrary to this observation, during Au-gust SSA at 405 nm (0.71–0.97) is in general higher than SSA at 870 nm (0.68–0.95) suggesting the dominance of the BC emission from vehicles with absorption coeffi -15
cients inversely proportional to the wavelength. Also apparent from Fig. 4 is the strong diurnal cycle on SSA, with minima in the morning rush hour (06:00–10:00 AM) and maxima on either side. This can be explained in terms of local conditions associated with the rush hour vehicular emissions and upward mixing of the aerosol with the ex-pansion of the boundary layer. The photochemical activity during day time and the 20
growth of particle size might have increased the scattering activity of the aerosol that causes the higher value of SSA at both wavelengths in the later part of day.
2.4 Angstr ¨om Exponent of Absorption (AEA)˚
The wavelength dependence of absorption is conventionally quantified using the AEA (αabs), which for the wavelengths of 405 and 870 nm can be written as
25
αabs =−lnβabs(405 nm)
βabs(870 nm) ln
405/870
, (2)
ACPD
9, 14059–14079, 2009In situ aerosol optics in Reno, NV, USA
M. Gyawali et al.
Title Page
Abstract Introduction
Conclusions References
Tables Figures
◭ ◮
◭ ◮
Back Close
Full Screen / Esc
Printer-friendly Version
Interactive Discussion Where βabs (405) and βabs (870) are the absorption coefficients at 405 and 870 nm,
respectively.
A plot of the monthly averaged, diurnal ˚Angstr ¨om exponent of absorption (AEA) for 405–870 nm is shown in Fig. 5. Strong diurnal cycles of AEA during July and August are apparent in these observations. This clearly distinguishes the dependence of AEA 5
for the months of July and August. During July AEA varies from 1.42 to 2.07, and is consistent with the measurements reported elsewhere for biomass burning aerosols (Bergstrom et al., 2007; Clarke et al., 2007; Kirchstetter et al., 2004). The diurnal pattern of AEA for July shows it’s minimum around morning rush hour which can be attributed to the local dominance of vehicular emission of the black carbon. During 10
the “normal” month of August AEA varies from 0.88 to 1.28. Most of the AEA values are closer to 1.0 during the morning rush hour and until afternoon as observed by the same authors and are described as the characteristics of the black carbon or “soot” (Moosm ¨uller et al., 2009). AEA starts to decrease afternoon and becomes minimum in the later part of the day at 0.88. At this time of day, the concentration of BC decreases 15
with the expansion of boundary layer. But mixing, coating, and coagulation of BC with organic and inorganic aerosols affects its absorption in the diluted state. The enhance-ment might be slightly greater for 870 nm than for 405 nm at this time, consistent with low AEA values. Further, our simulations of AEA shows the possibility of getting AEA values less than one for uncoated as well as coated carbon spheres, this suggests that 20
the absorption at 405 nm and 870 nm doesn’t necessarily follow the same pattern as well as that the amplification might be higher for 870 nm.
Bergstrom et al. (2007) pointed out that the observation of AEA less than one is interesting and might be due to the measurements uncertainties or due to slightly larger values of the imaginary part of the refractive index at longer wavelengths for certain 25
ACPD
9, 14059–14079, 2009In situ aerosol optics in Reno, NV, USA
M. Gyawali et al.
Title Page
Abstract Introduction
Conclusions References
Tables Figures
◭ ◮
◭ ◮
Back Close
Full Screen / Esc
Printer-friendly Version
Interactive Discussion
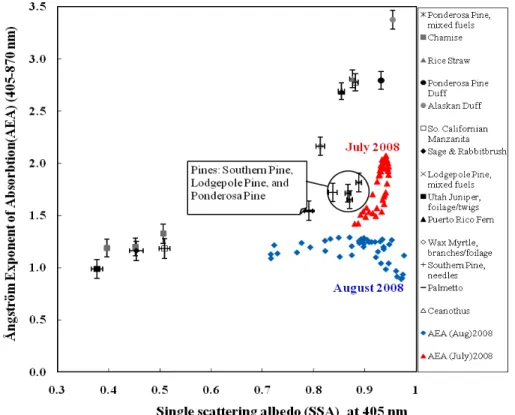
2.5 Comparison with laboratory observations
A comparison of optical properties of California wildfire smoke aerosol of summer 2008 is made with the optical properties of emissions from the laboratory combustion of wildland and agricultural fuels in the Fire Science Laboratory of the USFS in Missoula, MT (Lewis et al., 2008) as shown in Fig. 6. This comparison reveals that the optical 5
properties of the California wildfire smoke aerosol of summer 2008 are closest to those of emissions from the combustion of different pine fuels. The observed SSA at Reno, NV of the California wildfire of summer 2008 is slightly greater than observed at the laboratory, possibly due to the increase of SSA during about six hours of aging since emission (Abel et al., 2003) and also possibly influenced by differences in fuel moisture 10
and combustion conditions.
2.6 Simulations
The aim of the simulations presented here is to investigate the theoretically possible variations on AEA for uncoated and coated carbonaceous spheres. Electromagnetic theory was used to calculate the scattering and absorption cross sections at 405 nm 15
and 870 nm. In this model spherical BC cores are uniformly coated by non-absorbing organic and inorganic materials (Toon and Ackerman, 1981). For uncoated BC spheres with a complex refractive index of (1.55, 0.8i), AEA for 405 and 870 nm varies from
−0.24 to 1.11, as function of the core diameter as shown in Fig. 7. AEA increases
to about 1.11 for a core diameter of about 0.07µm and then decreases continuously, 20
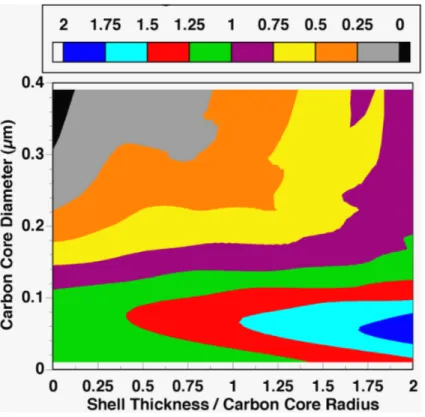
reaching a minimum of about−0.24 around 0.72µm and increases towards its geo-metrical limit of zero for large spheres. For an identical core surrounded by a spherical coating with refractive index of (1.5, 0.0i), AEA becomes as large as 1.6 as shown in Fig. 8, even though the coating is non absorbing. AEA values as large as 1.9 are ob-served for the same core when the coating refractive index is (1.5, 0.012i) at 405 nm 25
and is (1.5, 0.0i) at 870 nm as illustrated in Fig. 9.
ACPD
9, 14059–14079, 2009In situ aerosol optics in Reno, NV, USA
M. Gyawali et al.
Title Page
Abstract Introduction
Conclusions References
Tables Figures
◭ ◮
◭ ◮
Back Close
Full Screen / Esc
Printer-friendly Version
Interactive Discussion
3 Conclusions
The simulations confirm that large AEA values are possible even when coatings do not absorb light. The organic coating need not be intrinsically brown to observe effects commonly referred to as those caused by brown carbon light absorption. For relatively small cores, increasing coating thickness increases the AEA while for large cores, AEA 5
does not change dramatically as function of coating thickness.
On average, during the smoky month of July 2008 aerosol light extinction coefficients observed in Reno, NV were about an order of magnitude larger than those observed during the comparably smoke free month of August 2008. The diurnal variation of aerosol extinction suggests that vertical development of the boundary layer is delayed 10
under smoky conditions, likely due to reduction of the solar forcing at the surface. Comparison with laboratory generated wood smoke suggests that the aerosol optics in July is consistent with a predominant fuel source of pine needles and litter.
Measurements in August were typical of urban plumes. Midday values of the AEA were found to be significantly less than unity, as has been noted before. A likely ex-15
ACPD
9, 14059–14079, 2009In situ aerosol optics in Reno, NV, USA
M. Gyawali et al.
Title Page
Abstract Introduction
Conclusions References
Tables Figures
◭ ◮
◭ ◮
Back Close
Full Screen / Esc
Printer-friendly Version
Interactive Discussion
Acknowledgements. We acknowledge support by NSF, DOE ASP, JFSP through NPS, and the University of Nevada, Reno. We are grateful to the crew of the FLAME1 experiment in Missoula Montana that resulted in the laboratory data on biomass burning aerosol optics. We acknowledge NASA and Jeffery Reid for providing a satellite image and discussions.
References
5
Abel, S. J., Haywood, J. M., Highwood, E. J., Li, J., and Buseck, P. R.: Evolution of biomass burning aerosol properties from an agricultural fire in southern Africa, Geophys. Res. Lett., 30, 1783, doi:10.1029/2003GL017342, 2003.
Andreae, M. O. and Gelencs ´er, A.: Black carbon or brown carbon? The nature of light-absorbing carbonaceous aerosols, Atmos. Chem. Phys., 6, 3131–3148, 2006,
10
http://www.atmos-chem-phys.net/6/3131/2006/.
Arnott, W. P., Moosm ¨uller, H., Rogers, C. F., Jin, T., and Bruch, R.: Photoacoustic spectrometer for measuring light absorption by aerosols: Instrument description, Atmos. Env., 33, 2845– 2852, 1999.
Bergstrom, R. W., Pilewskie, P., Russell, P. B., Redemann, J., Bond, T. C., Quinn, P. K., and
15
Sierau, B.: Spectral absorption properties of atmospheric aerosols, Atmos. Chem. Phys., 7, 5937–5943, 2007,
http://www.atmos-chem-phys.net/7/5937/2007/.
Chen, L.-W. A., Moosm ¨uller, H., Arnott, W. P., Chow, J. C., Watson, J. G., Susott, R. A., Babbitt, R. E., Wold, C. E., Lincoln, E. N., and Hao, W. M.: Emissions from laboratory combustion of
20
wildland fuels: Emission Factors and Source Profiles, Environ. Sci. Technol., 41, 4317–4325, 2007.
Chen, L.-W. A., Moosm ¨uller, H., Arnott, W. P., Chow, J. C., Watson, J. G., Susott, R. A., Babbitt, R. E., Wold, C. E., Lincoln, E. N., and Hao, W. M.: Particle emissions from laboratory com-bustion of wildland fuels: In situ optical and mass meausurements, Geophys. Res. Lett., 33,
25
L04803, doi:10.1029/2005GL024838, 2006.
Clarke, A., McNaughton, C., Kapustin, V., Shinozuka, Y., Howell, S., Dibb, J., Zhou, J., Anderson, B., Brekhovskikh, V., Turner, H., and Pinkerton, M.: Biomass burning and pollution aerosol over North America: Organic components and their influence on
ACPD
9, 14059–14079, 2009In situ aerosol optics in Reno, NV, USA
M. Gyawali et al.
Title Page Abstract Introduction Conclusions References Tables Figures ◭ ◮ ◭ ◮ Back Close
Full Screen / Esc
Printer-friendly Version
Interactive Discussion
tral optical properties and humidification response, J. Geophys. Res., 112, D12S18, doi:10.1029/2006JD007777, 2007.
Hoff, R. M., Palm, S. P., Engel-Cox, J. A., and Spinhirne, J.: GLAS long-range transport obser-vation of the 2003 California forest fire plumes to the northeastern US, Geophys. Res. Lett., 32, L22S08, doi:10.1029/2005GL023723, 2005.
5
Hudson, P. K., Murphy, D. M., Cziczo, D. J., Thomson, D. S., de Gouw, J. A., Warneke, C., Holloway, J., Jost, H.-J., and H ¨ubler, G.: Biomass-burning particle measurements: Characteristic composition and chemical processing, J. Geophys. Res., 109, D23S27, doi:10.1029/2003JD004398, 2004.
Ito, A. and Penner, J. E.: Global estimates of biomass burning emissions based on satellite
10
imagery for the year 2000, J. Geophys. Res., 109, D14S05, doi:10.1029/2003JD004423, 2004.
Johnson, B. T., Osborne, S. R., Haywood, J. M., and Harrison, M. A. J.: Aircraft measurements of biomass burning aerosol over West Africa during DABEX, J. Geophys. Res., 113, D00C06, doi:10.1029/2007JD009451, 2008.
15
Kirchstetter, T. W., Novakov, T., and Hobbs, P. V.: Evidence that the spectral dependence of light absorption by aerosols is affected by organic carbon, J. Geophys. Res., 109, D21208, doi:10.1029/2004JD004999, 2004.
Lack, D. A., Cappa, C. D., Covert, D. S., Baynard, T., Massoli, P., Sierau, B., Bates, T. S., Quinn, P. K., Lovejoy, E. R., and Ravishankara, A. R.: Bias in Filter-Based Aerosol Light Absorption
20
Measurements Due to Organic Aerosol Loading: Evidence from Ambient Measurements, Aer. Sci. Tech., 42, 1033–1041, doi:10.1080/02786820802389277, 2008.
Lewis, K., Arnott, W. P., Moosm ¨uller, H., and Wold, C. E.: Strong spectral variation of biomass smoke light absorption and single scattering albedo observed with a novel dual wavelength photoacoustic instrument, J. Geophys. Res., 113, D16203, doi:10.1029/2007JD009699,
25
2008.
Moosm ¨uller, H., Chakrabarty, R. K., and Arnott, W. P.: Aerosol Light Absorption and its Mea surement: A Review, J. Quant. Spectrosc. Radiat. Transfer, 110, 844–878 ,doi:10.1016/j.jqsrt.2009.02.035, 2009.
Mulholland, G. W. and Bryner, N. P.: Radiometric model of the transmission cell-reciprocal
30
nephelometer, Atmos. Env., 28, 873–887, 1994.
ACPD
9, 14059–14079, 2009In situ aerosol optics in Reno, NV, USA
M. Gyawali et al.
Title Page
Abstract Introduction
Conclusions References
Tables Figures
◭ ◮
◭ ◮
Back Close
Full Screen / Esc
Printer-friendly Version
Interactive Discussion
to emission location, Geophys. Res. Lett., 34, L03818, doi:10.1029/2006GL028149, 2007. Pfister, G. G., Wiedinmyer, C., and Emmons, L. K.: Impacts of the fall 2007 California wildfires
on surface ozone: Integrating local observations with global model simulations, Geophys. Res. Lett., 35, L19814, doi:10.1029/2008GL034747, 2008.
Rahmah, A. A., Arnott, W. P., and Moosm ¨uller, H.: Integrating nephelometer with a low
trunca-5
tion angle and an extended calibration scheme, Meas. Sci. Technol., 17, 1723–1732, 2006. Roden, C. A., Bond, T. C., Conway, S., and Pinel, A. B. O.: Emission Factors and Real-Time
Op-tical Properties of Particles from Traditional Wood Burning Cookstoves, Environ. Sci. Tech., 40, 6750–6757, 2006.
Subramanian, R., Roden, C. A., Boparai, P., and Bond, T. C.: Yellow beads and missing
parti-10
cles: Trouble ahead for filter-based absorption measurements, Aerosol Sci. Tech., 41, 630– 637, 2007.
Toon, O. B. and Ackerman, T. P.: Algorithms for the calculation of scattering by stratified spheres, Appl. Opt., 20, 3657–3660, 1981.
Westerling, A. L., Hidalgo, H. G., Cayan, D. R., and Swetnam, T. W.: Warming and Earlier
15
Spring Increase Western U.S. Forest Wildfire Activity, Science, 313, 940–943, 2006.
Yang, M., Howell, S. G., Zhuang, J., and Huebert, B. J.: Attribution of aerosol light absorption to black carbon, brown carbon, and dust in China – interpretations of atmospheric measure-ments during EAST-AIRE, Atmos. Chem. Phys., 9, 2035–2050, 2009,
http://www.atmos-chem-phys.net/9/2035/2009/.
20
ACPD
9, 14059–14079, 2009In situ aerosol optics in Reno, NV, USA
M. Gyawali et al.
Title Page
Abstract Introduction
Conclusions References
Tables Figures
◭ ◮
◭ ◮
Back Close
Full Screen / Esc
Printer-friendly Version
Interactive Discussion Reno, NV
San Francisco, CA
185 Miles
Cloud Smoke
ACPD
9, 14059–14079, 2009In situ aerosol optics in Reno, NV, USA
M. Gyawali et al.
Title Page
Abstract Introduction
Conclusions References
Tables Figures
◭ ◮
◭ ◮
Back Close
Full Screen / Esc
Printer-friendly Version
Interactive Discussion
Fig. 2. The monthly averaged, diurnal aerosol extinction at 405 nm and 870 nm for July and August 2008.
ACPD
9, 14059–14079, 2009In situ aerosol optics in Reno, NV, USA
M. Gyawali et al.
Title Page
Abstract Introduction
Conclusions References
Tables Figures
◭ ◮
◭ ◮
Back Close
Full Screen / Esc
Printer-friendly Version
Interactive Discussion
ACPD
9, 14059–14079, 2009In situ aerosol optics in Reno, NV, USA
M. Gyawali et al.
Title Page
Abstract Introduction
Conclusions References
Tables Figures
◭ ◮
◭ ◮
Back Close
Full Screen / Esc
Printer-friendly Version
Interactive Discussion
Figure (4)
Fig. 4. The monthly averaged, diurnal aerosol SSA for 405 nm and 870 nm for the months of July and August 2008. SSA is higher for the smoky month of July. Note the minimum around the morning rush hour due to the higher vehicular emission. LAOC causes the SSA at 405 nm to be lower than at 870 nm in July.
ACPD
9, 14059–14079, 2009In situ aerosol optics in Reno, NV, USA
M. Gyawali et al.
Title Page
Abstract Introduction
Conclusions References
Tables Figures
◭ ◮
◭ ◮
Back Close
Full Screen / Esc
Printer-friendly Version
Interactive Discussion
ACPD
9, 14059–14079, 2009In situ aerosol optics in Reno, NV, USA
M. Gyawali et al.
Title Page
Abstract Introduction
Conclusions References
Tables Figures
◭ ◮
◭ ◮
Back Close
Full Screen / Esc
Printer-friendly Version
Interactive Discussion
Fig. 6. A comparison of monthly averaged, diurnal ˚Angstr ¨om exponent of absorption (AEA) versus single scattering albedo (SSA) at 405 nm for the months of July and August 2008 with the AEA and SSA of the laboratory burned fuels. The comparison illustrates that the optical properties of California wildfires aerosols of 2008 are similar to pine smoke aerosols.
ACPD
9, 14059–14079, 2009In situ aerosol optics in Reno, NV, USA
M. Gyawali et al.
Title Page
Abstract Introduction
Conclusions References
Tables Figures
◭ ◮
◭ ◮
Back Close
Full Screen / Esc
Printer-friendly Version
Interactive Discussion
ACPD
9, 14059–14079, 2009In situ aerosol optics in Reno, NV, USA
M. Gyawali et al.
Title Page
Abstract Introduction
Conclusions References
Tables Figures
◭ ◮
◭ ◮
Back Close
Full Screen / Esc
Printer-friendly Version
Interactive Discussion
Fig. 8.Simulation of the ˚Angstr ¨om exponent of absorption from values at 405 nm and 870 nm as a function of coating thickness and core diameter for a core with refractive index (1.55, 0.8i) and a coating with refractive index (1.5, 0.0i). In this case, the coating does not absorb light.
ACPD
9, 14059–14079, 2009In situ aerosol optics in Reno, NV, USA
M. Gyawali et al.
Title Page
Abstract Introduction
Conclusions References
Tables Figures
◭ ◮
◭ ◮
Back Close
Full Screen / Esc
Printer-friendly Version
Interactive Discussion