ACPD
9, 12519–12558, 2009Aerosol optical properties relevant to
regional remote sensing of CCN
Y. Shinozuka et al.
Title Page
Abstract Introduction
Conclusions References
Tables Figures
◭ ◮
◭ ◮
Back Close
Full Screen / Esc
Printer-friendly Version
Interactive Discussion Atmos. Chem. Phys. Discuss., 9, 12519–12558, 2009
www.atmos-chem-phys-discuss.net/9/12519/2009/ © Author(s) 2009. This work is distributed under the Creative Commons Attribution 3.0 License.
Atmospheric Chemistry and Physics Discussions
This discussion paper is/has been under review for the journalAtmospheric Chemistry and Physics (ACP). Please refer to the corresponding final paper inACPif available.
Aerosol optical properties relevant to
regional remote sensing of CCN activity
and links to their organic mass fraction:
airborne observations over Central
Mexico and the US West Coast during
MILAGRO/INTEX-B
Y. Shinozuka1,*, A. D. Clarke1, P. F. DeCarlo2,3,**, J. L. Jimenez2,4, E. J. Dunlea2, G. C. Roberts5, J. M. Tomlinson6, D. R. Collins6, S. G. Howell1, V. N. Kapustin1, C. S. McNaughton1, and J. Zhou1
1
School of Ocean and Earth Science and Technology, University of Hawaii, Honolulu, HI, USA
2
Cooperative Institute for Research in the Environmental Sciences, University of Colorado, Boulder, CO, USA
3
Dept. of Atmospheric and Oceanic Sciences, University of Colorado, Boulder, CO, USA
4
ACPD
9, 12519–12558, 2009Aerosol optical properties relevant to
regional remote sensing of CCN
Y. Shinozuka et al.
Title Page
Abstract Introduction
Conclusions References
Tables Figures
◭ ◮
◭ ◮
Back Close
Full Screen / Esc
Printer-friendly Version
Interactive Discussion
5
Center for Atmospheric Sciences, Scripps Institution of Oceanography, La Jolla, CA, USA
6
Department of Atmospheric Sciences, Texas A&M University, College Station, TX, USA ∗
now at: National Aeronautics and Space Administration Ames Research Center, MS 245-5, Moffett Field, CA, USA
∗∗now at: Paul Scherrer Institut, 5232 Villigen-PSI, Switzerland
Received: 11 April 2009 – Accepted: 6 May 2009 – Published: 26 May 2009
Correspondence to: Y. Shinozuka (yohei@hawaii.edu)
ACPD
9, 12519–12558, 2009Aerosol optical properties relevant to
regional remote sensing of CCN
Y. Shinozuka et al.
Title Page
Abstract Introduction
Conclusions References
Tables Figures
◭ ◮
◭ ◮
Back Close
Full Screen / Esc
Printer-friendly Version
Interactive Discussion
Abstract
Remote sensing of cloud condensation nuclei (CCN) would help evaluate the indirect effects of tropospheric aerosols on clouds and climate. To assess its feasibility, we examined relationships of submicron aerosol composition to CCN activity and optical properties observed during the MILAGRO/INTEX-B aircraft campaigns. An indicator of 5
CCN activity,κ, was calculated from hygroscopicity measured under saturation. κ for dry 100-nm particles decreased with the organic fraction of non-refractory mass of sub-micron particles (OMF) as 10(−0.43−0.44∗OMF)over Central Mexico and 10(−0.29−0.70∗OMF) over the US West Coast. These fits represent the critical dry diameter, centered near 100 nm for 0.2% supersaturation but varied asκ(−1/3), within measurement uncertainty 10
(∼20%). The decreasing trends of CCN activity with the organic content, evident also
in our direct CCN counts, were consistent with previous ground and laboratory obser-vations of highly organic particles. The wider range of OMF, 0–0.8, for our research areas means that aerosol composition will be more critical for estimation of CCN con-centration than at the fixed sites previously studied. Furthermore, the wavelength de-15
pendence of extinction was anti-correlated with OMF as−0.70*OMF+2.0 for Central
Mexico’s urban and industrial pollution air masses, for unclear reasons. The Angstrom exponent of absorption increased with OMF, more rapidly under higher single scatter-ing albedo, as expected for the interplay between soot and colored weak absorbers (some organic species and dust). Because remote sensing products currently use the 20
wavelength dependence of extinction albeit in the column integral form and may poten-tially include that of absorption, these regional spectral dependencies are expected to facilitate retrievals of aerosol bulk chemistry and CCN activity over Central Mexico.
1 Introduction
Clouds act on the Earth’s energy balance by reflecting incoming visible radiation and 25
ACPD
9, 12519–12558, 2009Aerosol optical properties relevant to
regional remote sensing of CCN
Y. Shinozuka et al.
Title Page
Abstract Introduction
Conclusions References
Tables Figures
◭ ◮
◭ ◮
Back Close
Full Screen / Esc
Printer-friendly Version
Interactive Discussion as cloud condensation nuclei (CCN) affect cloud properties such as reflectivity,
cover-age, precipitation efficiency and lifetime (Twomey, 1974; Albrecht, 1989). To assess these so-called aerosol indirect effects, more complete knowledge of the CCN in the atmosphere for common cloud fields is crucial.
Ambient measurements of CCN in this context are sparse. Their relatively short res-5
idence time in the troposphere, ranging from days to weeks, makes their concentration too variable over time and too inhomogeneous over space to adequately characterize from aircraft, ship or ground. In this regard, satellites, with their extensive and frequent coverage, would be a preferred observation platform.
Because aerosol chemistry influences both optical properties and CCN activation 10
it can impact the satellite remote sensing of CCN. According to the Kohler equation the critical dry diameter – the minimum diameter of aerosols that can serve as CCN – is determined by the solubility and surface tension of the particles, at a given su-persaturation and temperature. These chemistry-dependent parameters, expressed collectively as a single hygroscopicity parameter,κ (Petters and Kreidenweis, 2007), 15
are poorly constrained for most aerosol components, particularly for the various types of organic compounds (Shulman et al., 1996; Facchini et al., 1999; Nenes et al., 2002; Raymond and Pandis, 2002; Kanakidou et al., 2005; Hartz et al., 2006; Ervens et al., 2007; Stroud et al., 2007; Cubison et al., 2008). Even if the number of aerosols was ac-curately retrieved, the uncertainty in the threshold diameter would hamper estimation 20
of CCN concentration.
In this paper we approximate relationships between aerosol chemical composition and CCN activity over the Central Mexico and the US West Coast (Sect. 3), and present a potential remote-sensing method to infer the aerosol bulk chemical composition over Central Mexico (Sect. 4). We use aerosol size distribution, chemical composition, hy-25
ACPD
9, 12519–12558, 2009Aerosol optical properties relevant to
regional remote sensing of CCN
Y. Shinozuka et al.
Title Page
Abstract Introduction
Conclusions References
Tables Figures
◭ ◮
◭ ◮
Back Close
Full Screen / Esc
Printer-friendly Version
Interactive Discussion
2 Experiments and instruments
2.1 Experiments
The Megacities Impact on Regional and Global Environment (MIRAGE) Experiment took place in March 2006 as a part of the Megacity Initiative: Local and Global Re-search Observations (MILAGRO) Campaign (Molina et al., 2009; DeCarlo et al., 2008). 5
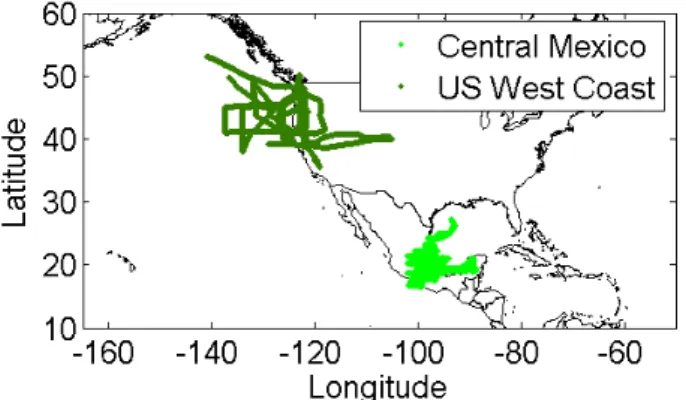
The National Center for Atmospheric Research C130 aircraft was employed to sample the aerosols and gases above Central Mexico (Fig. 1).
During the second part (17 April–15 May) of the Intercontinental Chemical Transport Experiment – Phase B (INTEX-B) (Singh et al., 2009), the C130 flew over the US West Coast (Fig. 1) with the same instruments as those employed during MILAGRO. Atmo-10
spheric constituents arising from anthropogenic and biogenic emissions from the local areas (e.g., Seattle, Central Valley) and long-range transport from Asia were sampled.
2.2 Instrumentation
Aerosols were collected and conveyed to most of the aerosol instrumentation aboard the C130 aircraft through the University of Hawaii solid diffuser inlet. This inlet and 15
sample plumbing has recently been shown to pass dust and sea-salt particles with dry aerodynamic diameter of 5.0µm with a better than 50% efficiency during the DC-8 Inlet/Instrument Characterization Experiment over and near California (McNaughton et al., 2007). The submicron accumulation-mode particles that usually dominate CCN are sampled with nearly 100% efficiency. However, for a few exceptional cases with heavy 20
dust or sea-salt concentrations encountered during the experiments, the data are more uncertain than for the rest of the periods.
An optical particle counter (OPC, a modified LAS-X, Particle Measurement Systems, Boulder, Colorado) measured the dry (RH controlled under 30% with a dilution flow) aerosol size distribution between 100 nm and about 20µm (Clarke, 1991). Its He-Ne 25
ACPD
9, 12519–12558, 2009Aerosol optical properties relevant to
regional remote sensing of CCN
Y. Shinozuka et al.
Title Page
Abstract Introduction
Conclusions References
Tables Figures
◭ ◮
◭ ◮
Back Close
Full Screen / Esc
Printer-friendly Version
Interactive Discussion degrees. The particle size was calibrated with polystyrene latex spheres whose
refrac-tive index is 1.59. For calibrating for the coarse mode, glass beads with a refracrefrac-tive index of 1.54 were also used. A size distribution was obtained every 3 s, but averaged over 30 s to reduce noise due to low counting statistics at about 1µm and larger.
The number of aerosol particles measured with the OPC can be different from the 5
number of particles larger than 100 nm because of imprecise sizing at the first OPC channel. The difference was estimated to be random and typically within 25% of the OPC number concentration, through comparison with the difference of two independent number counts, total condensation nuclei (CN,>10 nm nominal detection size) and the DMA integral (10–100 nm, see below). No systematic bias with the presence of a 10
specific aerosol component was evident.
Smaller particles with mobility diameters between 10 to 250 nm were measured with a Radial Differential Mobility Analyzer (DMA) under dry conditions. DMA samples were collected over 20 s and held in a lagged aerosol grab chamber (Clarke et al., 1998) for subsequent DMA analysis. The measured mobility distribution was inverted to an 15
aerosol size distribution by taking into account the sampling line losses, bipolar charg-ing probabilities, calibrated DMA transfer functions regardcharg-ing DMA diffusion broadening and losses, and particle counting efficiencies (Zhou, 2001; Zhou et al., 2002). Physi-cal morphologies other than sphere, which are common for freshly emitted combustion particles such as in fresh biomass burning plumes, can affect the DMA sizing (DeCarlo 20
et al., 2004) but this effect was not considered.
Both DMA and OPC measurements allowed for real-time thermal analysis of par-ticles at select temperatures to infer the size resolved chemical composition continu-ously throughout the aircraft campaigns. One of the analyses in this paper shows data collected for particles heated to 300◦C, and all other data are for unheated particles. 25
ACPD
9, 12519–12558, 2009Aerosol optical properties relevant to
regional remote sensing of CCN
Y. Shinozuka et al.
Title Page
Abstract Introduction
Conclusions References
Tables Figures
◭ ◮
◭ ◮
Back Close
Full Screen / Esc
Printer-friendly Version
Interactive Discussion Total and submicrometer aerosol scattering coefficients were measured at 450, 550
and 700 nm using two TSI model 3563 integrating nephelometers (Anderson et al., 1996; Heintzenberg and Charlson, 1996; Anderson et al., 2003). The measurements were made every second, but averaged over 30 s for the present study. The rela-tive humidity in the instrument was not acrela-tively controlled but kept to <30%, often 5
near 20%, by ram heating and cabin temperatures higher than the ambient. The light scattering measured over the TSI nephelometer’s detection angles of 7–170◦ were corrected to 0–180◦based upon correction factors calculated from the OPC size distribution using Mie theory with the calibration particle refractive index as an ap-proximation. Before this calculation, we confirmed that these two optical instruments 10
operated consistently with each other: The scattering over 7–170◦ derived from the OPC size distributions (30 s average) over the study region agrees with the uncor-rected nephelometer scattering within about 10%, with the coefficient of determina-tion (R2) being 0.83–0.89 for the 3 wavelengths, as illustrated in the online supple-mentary material (Fig. S1 and Table S1 at http://www.atmos-chem-phys-discuss.net/ 15
9/12519/2009/acpd-9-12519-2009-supplement.pdf). The derived scattering Angstrom exponents (−∆logσ/∆logλ, where σ is the scattering, and λ, the wavelength) mostly
take values between 0 and 2.5, and agree within 0.2 between the nephelometer and OPC. The calculated correction factor, σ0−180 deg/σ7−170 deg, lies between 1.0–1.1 for
the Angstrom exponent of 2, indicating that the angular truncation requires a minor 20
(0–10%) adjustment for fine particles. The correction factor for coarse particles at the Angstrom exponent of 0 is larger: 1.7 for dust over Mexico and 1.3 for sea salt over the northeastern Pacific Ocean, both at 550 nm. A 5–10% variability is associated with the angular truncation correction factors for the entire observed range of Angstrom ex-ponent. This variability is much larger than the error arising from gas calibration (∼1%
25
ACPD
9, 12519–12558, 2009Aerosol optical properties relevant to
regional remote sensing of CCN
Y. Shinozuka et al.
Title Page
Abstract Introduction
Conclusions References
Tables Figures
◭ ◮
◭ ◮
Back Close
Full Screen / Esc
Printer-friendly Version
Interactive Discussion agreed well with independent observations (Rogers et al., 2009).
A prototype 3-wavelength Radiance Research particle soot absorption photometer (PSAP) measured aerosol light absorption at 470, 530 and 660 nm. The PSAP pro-duces a continuous measurement of absorption by monitoring the change in transmit-tance across a filter using an alternating 3-wavelength LED. This filter-based measure-5
ment of absorption includes artifact response due to particulate light scattering (Bond et al., 1999). This is a function of the ratio of the scattering coefficient to the extinction coefficient (i.e., single scattering albedo, SSA) and the wavelength. We correct our data for the scattering artifact as well as calibration error after Virkkula et al. (2005). This correction is larger than the classic correction scheme widely used for a single-10
wavelength (at 530 nm) prototype of the PSAP (Bond et al., 1999). We are unaware of the reason why the two correction schemes at an identical wavelength can differ by about 20% of the uncorrected absorption (see related discussions by Cappa et al., 2008). Because the absorption rarely exceeded 10% of the extinction, the absolute er-ror in SSA is expected to be typically 0.02. The average instrument noise computed as 15
the average standard deviation for six, 300 s (5-min) averages of the 1-Hz data taken in our laboratory for filtered air is 0.56 Mm−1 for all wavelengths (McNaughton et al., 2009).
The CCN concentration was measured with a continuous-flow (0.5 L/min) stream-wise thermal-gradient CCN counter (Roberts and Nenes, 2005; Lance et al., 2006). 20
Sampled particles were exposed to a supersaturation established by a constant tem-perature gradient in the stream-wise direction along the vertical CCN column. Activated particles were detected by an optical particle counter at the exit of the column. The su-persaturation was between 0.18±0.09%, roughly corresponding to the lower end of the
typical range of supersaturation found in the global troposphere (Pruppacher and Klett, 25
1980; Hudson and Svensson, 1995; Hoppel et al., 1996). A constant pressure con-troller was not deployed for this experiment; hence, only data from level legs are used for the analysis of the CCN data.
(HR-ToF-ACPD
9, 12519–12558, 2009Aerosol optical properties relevant to
regional remote sensing of CCN
Y. Shinozuka et al.
Title Page
Abstract Introduction
Conclusions References
Tables Figures
◭ ◮
◭ ◮
Back Close
Full Screen / Esc
Printer-friendly Version
Interactive Discussion AMS, hereinafter “AMS”) operated by the University of Colorado measured the mass
concentration of submicron non-refractory aerosol species. In this paper “non-refractory” is empirically defined as those species that evaporate in a few seconds un-der high vacuum at 600◦C, and includes essentially all of the organic species and most sulfates and nitrates, including their ammonium salts. The AMS (DeCarlo et al., 2006) 5
and the data that can be obtained from it (Canagaratna et al., 2007; Aiken et al., 2008) have been described previously in the literature. Briefly, the sampled particles are intro-duced in a vacuum chamber using an aerodynamic lens, and within 10 ms are vapor-ized at a resistively heated surface (600◦C). The resulting gas phase plume undergoes electron ionization (70 eV), and is mass-analyzed using a high-resolution time-of-flight 10
mass spectrometer (H-TOF, Tofwerk, Thun, Switzerland). The resulting mass spectra are used to quantify the species mass concentrations using previously documented calibration and analysis methods (Jimenez et al., 2003; Allan et al., 2004; DeCarlo et al., 2006). For mass fractions of bulk aerosol composition the errors are generally about 10% except for very low aerosol concentrations. The AMS also recorded size 15
distributions of the species, but this type of data is not used in the present paper. The AMS sampled through a separate inlet which had high transmission for submicron par-ticles as characterized by Dunlea et al. (2008). More detailed discussion of AMS results during these campaigns are presented by DeCarlo et al. (2008), Dunlea et al. (2008), Aiken et al. (2007, 2008, 2009), Van Donkelaar et al. (2008), and Heald et al. (2008). 20
Size-resolved particle hygroscopicity was measured with the tandem differential mo-bility analyzer (TDMA) of Texas A&M University (Gasparini et al., 2004; Tomlinson et al., 2007). Sequential measurements were made to characterize the growth of se-lected particles with dry (∼20% RH) diameters including 50, 100, 200 and 300 nm. The
voltage applied in the first DMA was fixed in order to select a monodisperse aerosol. 25
ACPD
9, 12519–12558, 2009Aerosol optical properties relevant to
regional remote sensing of CCN
Y. Shinozuka et al.
Title Page
Abstract Introduction
Conclusions References
Tables Figures
◭ ◮
◭ ◮
Back Close
Full Screen / Esc
Printer-friendly Version
Interactive Discussion factor. For a given aerosol distribution, several growth factor modes may be observed
when multiple particle types are present. Any scan in which the relative humidity de-viated by more than 5% below or 7% above 84% RH was discarded. The “growth” factor for dry (∼20% RH) particles was usually found to be within 5% of the expected
value (1.00) (Gasparini et al., 2004), which provides an indication of the measurement 5
accuracy.
2.3 Data processing
When combining data from multiple instruments throughout this paper, we excluded cases where the particle light scattering varied widely – the standard deviation ex-ceeding half of the mean – within each 30-s averaging time period. This reduces the 10
influence of a change in aerosol properties introduced by temporal mismatch among the instruments, for example, the 10-s gap between a 20-s DMA sampling and a 30-s OPC cycle.
3 Observed CCN critical dry diameter and its relationship with bulk aerosol chemistry
15
A common method of deriving CCN concentration is to integrate dry particle number size distribution from the critical dry diameter, Dd c. We estimate Dd c independently from two measurements, CCN counts (Sect. 3.1) and hygroscopicity (Sect. 3.2), before evaluating the results against bulk aerosol chemistry (Sect. 3.3).
3.1 EstimatingDd cfrom CCN counts
20
ACPD
9, 12519–12558, 2009Aerosol optical properties relevant to
regional remote sensing of CCN
Y. Shinozuka et al.
Title Page
Abstract Introduction
Conclusions References
Tables Figures
◭ ◮
◭ ◮
Back Close
Full Screen / Esc
Printer-friendly Version
Interactive Discussion over Central Mexico and averaged over 30 s. TheDd cis estimated to be 100 nm for the
data points exactly on the 1:1 line where the number integral from 100 nm agrees with the CCN concentration. This approximation assumes the diameter cut is sharp such that all particles above it, and none below, are activated, as if particles were homoge-neously mixed. The data points above the 1:1 line represent cases withDd c>100 nm
5
(some particles larger than 100 nm were not activated as CCN) and those below the line, Dd c<100 nm. Similar exercises were made for threshold diameters other than 100 nm.
The value ofDd cestimated this way was adjusted to a fixed 0.20% supersaturation using Kohler theory which describes a linear relationship with a slope of−3/2 between
10
the critical diameter and supersaturation both on logarithmic scales. For example, the Dd cestimated from a measurement at 0.15% supersaturation was decreased by 17%, reflecting the fact that aerosols of identical chemical properties would activate at this smaller diameter if brought to 0.20% supersaturation.
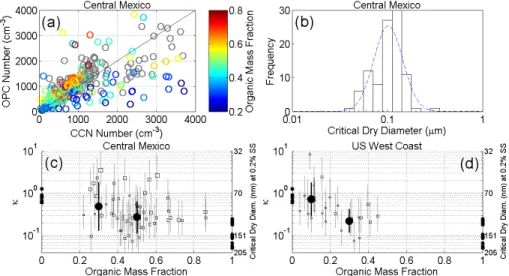
A lognormal fit to the frequency distribution of these adjusted Dd c values peaks at 15
102 nm, with a geometric standard deviation (sigma) of 1.4 (Fig. 2b). This apparent variation inDd cis partially attributable to measurements uncertainties in
supersatura-tion and sizing. The supersaturasupersatura-tion of the CCN counter can be inaccurate by up to 20% (Rose et al., 2008). This translates into a precision in critical diameter of∼12%,
based on the−3/2 linear relationship mentioned above. The combined sizing error, on
20
the other hand, is about 25% in terms of particle number (Sect. 2.2), equivalent to an error in Dd c up to 20% depending on the shape of size distribution. Because these uncertainties should be random and independent of each other, the overall precision in the derivedDd cis the square root of sum of the squares of them, which is 20–25%. The variability in the aerosol number during the course of each 30 s measurement time 25
period is similar or smaller. The CN counts indicates that it is 20% in number, which corresponds to a∼15% change inDd c.
ACPD
9, 12519–12558, 2009Aerosol optical properties relevant to
regional remote sensing of CCN
Y. Shinozuka et al.
Title Page
Abstract Introduction
Conclusions References
Tables Figures
◭ ◮
◭ ◮
Back Close
Full Screen / Esc
Printer-friendly Version
Interactive Discussion indeed not significantly smaller than 40%, because the observed variability should be
the addition in quadrature of the actual variability and the random error. This implies that, if CCN critical dry diameter is to be estimated by integrating aerosol number distributions from a single fixed value of critical dry diameter without consideration of the chemical composition over a wide geographical region, the estimate will be no more 5
accurate than about 40%. This conclusion from our data over Central Mexico appears to apply to those over the US West Coast as well, though we hesitate to quantify the variation in the estimated critical dry diameter due to the smaller number of samples. For both regions, more constraints onDd care desirable, and are pursued in Sect. 3.3 by evaluating it against the organic mass fraction (Fig. 2c and d).
10
3.2 EstimatingDd cfrom hygroscopicity
The critical diameterDd ccan also be estimated from the particle hygroscopicity
mea-sured below saturation with the TDMA, as a result of its relationship with the CCN activity above saturation. The measured mobility diameter growth in response to water uptake, i.e., the humidified diameter divided by the dry one, is plotted over the vertical 15
axis of Fig. 3a and b. The concentration density is indicated by color. (The horizontal axis will be discussed in Sects. 3.3 and 4.2.) The growth factor is seen to typically range from 1 (low hygroscopicity) to 1.6 (high). An inhomogeneous mix of particles can result in more than one peak on the growth factor distribution.
To derive Dd c for each TDMA distribution, the following equation from Petters and 20
Kreidenweis (2007):
S(D)= D
3
−Dd3
D3
−D3d(1−κ)
exp
4σM
w
RT ρwD
(1)
was solved forκ, the hygroscopicity parameter. S is the saturation ratio over an aque-ous solution droplet (0.84),D and Dd the humidified and dry diameters, respectively,
ACPD
9, 12519–12558, 2009Aerosol optical properties relevant to
regional remote sensing of CCN
Y. Shinozuka et al.
Title Page
Abstract Introduction
Conclusions References
Tables Figures
◭ ◮
◭ ◮
Back Close
Full Screen / Esc
Printer-friendly Version
Interactive Discussion weight of pure water (18 g mol−1), R the gas constant (8.3 J K−1mol−1), T the
tem-perature (∼298 K), andρw the density of water (∼1 g cm−
3
). Note that we ignore the effect of organics on the surface tension on purpose, in accord with the formulation by Petters and Kreidenweis (2007), so that all chemical effects are lumped into κ. The hygroscopicity parameter is linked toDd cby:
5
κ= 27D43A3
d cln
2S
c
A= 4σMw RT ρw
(2)
whereSc is the saturation ratio for which the critical dry diameter is derived.
Substi-tuting the applicable numbers into these two equations (with no experimental results involved), the relationship betweenκandDd cunder 0.2% supersaturation for our con-ditions is
10
Dd c=κ(−1/3)×70 nm (3)
For very hygroscopic aerosol similar to sodium chloride the hygroscopicity parame-ter κ is 1 (Dd c=70 nm) and for low hygroscopicity typical of many organics κ is 0.1 (Dd c=151 nm). The precision in the estimated diameter was determined to be∼20%
based on the random uncertainty in the TDMA relative humidity (assumed to be 3 15
percentage points) and the random sizing error (2% of the nominal size).
The estimated geometric mean critical dry diameters for CCN activation are 109, 121, 117 and 110 nm when using as input the measurements with dry diameters of 50, 100, 200 and 300 nm, respectively, with a geometric standard deviation (sigma) of 1.1–1.2. The same analysis applied to the data taken over the US West Coast results 20
ACPD
9, 12519–12558, 2009Aerosol optical properties relevant to
regional remote sensing of CCN
Y. Shinozuka et al.
Title Page
Abstract Introduction
Conclusions References
Tables Figures
◭ ◮
◭ ◮
Back Close
Full Screen / Esc
Printer-friendly Version
Interactive Discussion
3.3 The relationship ofDd cwith organic mass fraction of submicron aerosols
According to Kohler theory, Dd c depends on the aerosol chemistry at a given super-saturation. Here we evaluate the strength of this relationship in our data. As a proxy for bulk aerosol chemical composition we use the organic mass fraction (OMF) ob-tained from the C130 AMS measurements of non-refractory components of submicron 5
aerosols, the size most relevant to CCN activation. Although refractory components are not measured by the AMS, black carbon and dust comprised only a small fraction of the submicron range in and around Mexico City (Aiken et al., 2009; Subramanian et al., 2009) so that the OMF calculated here is still approximately representative of the true OMF of the submicron mode.
10
The particle growth factor tends to be high under low OMF (Fig. 3b), consistent with trends reported by Quinn et al. (2005) and the fact that the main non-organic compo-nents of the submicron mode are inorganic salts (DeCarlo et al., 2008). Somewhat less clearly, the marker color of Fig. 2a indicates that the CCN concentration tends to exceed the OPC integral number under low OMF (high sulfate, nitrate and ammonium) 15
over Central Mexico, especially for CCN concentration larger than ∼500 cm−3. This
observation suggests that organic particles were less effectively activated than sulfate and nitrate particles near 100 nm in general.
The derived critical dry diameter is a more direct and convenient parameter than the number concentration and the growth factor for the purpose of examining the CCN 20
activity of particles. Squares in Fig. 3c illustrate the relationship between Dd c de-duced from the TDMA data for the dry diameters of 100 nm and OMF, with the grey vertical lines indicating the estimated measurement errors. Petters and Kreidenweis’s (2007) hygroscopicity parameter, κ, estimated from the same TDMA measurements is also shown in the left vertical axis to facilitate adjustment ofDd cto different super-25
ACPD
9, 12519–12558, 2009Aerosol optical properties relevant to
regional remote sensing of CCN
Y. Shinozuka et al.
Title Page
Abstract Introduction
Conclusions References
Tables Figures
◭ ◮
◭ ◮
Back Close
Full Screen / Esc
Printer-friendly Version
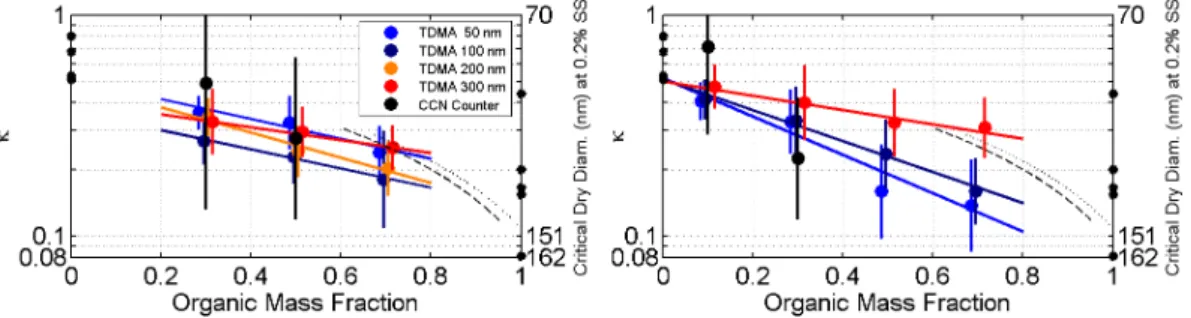
Interactive Discussion To quantify the dependency,Dd c andκ averaged on a logarithmic scale over each
0.2 OMF bin are superimposed as circles in Fig. 3c for Central Mexico and Fig. 3d for the US West Coast for dry 100 nm particles, and shown in Fig. 4 for all TDMA sizes to facilitate comparisons. As noted in Sect. 2.2, the measurement error associated with the number count is random and not biased by aerosol chemistry. As measurement 5
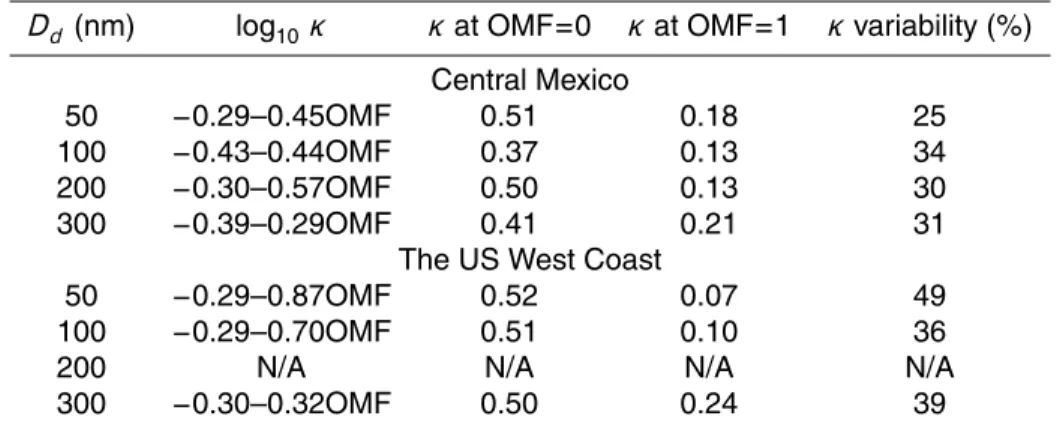
errors in the CCN concentration and TDMA growth factor are likely random, the lack of systematic biases means the averageDd cis neither significantly overestimated nor un-derestimated. The log10κ-OMF relationship approximated by linear regression through the bin average is also depicted in these figures, and parameterized in Table 1. Values ofκreported previously for various ionic and organic species and tabulated by Petters 10
and Kreidenweis (2007) are represented by black dots.
The critical diameter generally increases, and κ decreases, as the OMF increases, as expected from the lower solubility of organic compounds relative to the inorganic. A closer look at Fig. 4 reveals subtle variations in the OMF-κ relationships with region and particle size. Compared with Central Mexico, the US West Coast exhibits higher 15
variation in the particle hygroscopicity with both size and chemical component. This perhaps reflects the more diverse sources of particles (Central Valley pollution of urban and agricultural mix, Asian fossil fuel and biomass combustion, and possibly ocean surface), sampled over and offthe US West Coast. In fact, the hygroscopicity tends to be higher for samples from California than those from the State of Washington for 20
OMF greater than 0.6. We do not know why the dry 50- and 100-nm particles are less hygroscopic over the US West Coast than over Central Mexico, for OMF=0.4–0.8. The organics sampled in Asian plumes over the West Coast were essentially all aged and oxygenated (OOA-I), whereas the organics over Central Mexico were mostly a combination of fresher and aged oxygenated (OOA-I and OOA-II). More oxygenated 25
ACPD
9, 12519–12558, 2009Aerosol optical properties relevant to
regional remote sensing of CCN
Y. Shinozuka et al.
Title Page
Abstract Introduction
Conclusions References
Tables Figures
◭ ◮
◭ ◮
Back Close
Full Screen / Esc
Printer-friendly Version
Interactive Discussion move to the left in the figure.
The dependence we observed is approximated as Log10κ=−0.43−0.44∗OMF for Central Mexico
−0.29−0.70∗OMF for the US West Coast (4)
for dry 100 nm particles. These equations giveκ of 0.37 and 0.13 at OMF=0 and 1, 5
respectively, for Central Mexico, and κ of 0.51 and 0.10 for the US West Coast, as noted in Table 1. The values at OMF=1 are similar to the values near 0.1 reported for Amazon (Gunthe et al., 2009) and chamber-generated secondary organic aerosols (King et al., 2007).
For Amazon’s air masses sampled from a 110-m-tall tower Gunthe et al. (2009) ex-10
pressedκas 0.1Xm,org+0.6Xm,inorgwhereXm,organdXm,inorgare organic and inorganic
mass fractions, or OMF and (1–OMF), respectively. Their more precise expressions, representing two different methods of selecting particle sizes, are shown in Fig. 4. This fit, derived from their data taken mostly underXm,org of 0.65–0.95, falls within the
vari-ability of our observations even over the range of low OMF values that they did not 15
sample (our expressions are based on observations over OMF=0.2–0.8 for Central Mexico, 0–0.8 for the US West Coast). This is in spite of noticeable differences in chemical composition, e.g., less nitrate and, presumably, dust over Amazon than over Central Mexico. To be precise, we found thatκ decreases more slowly with the OMF, from values near 0.4–0.5, rather than 0.6, at OMF=0 towards values a little higher than 20
0.1 at OMF=1. The smaller variation in our κ with OMF is most notable with Central Mexico (at all dry particle sizes) and the US West Coast 300-nm particles. We prefer logarithmic scales to linear ones in expressing the critical dry diameter and hence the κ, as conventional with aerosol diameters.
Dusek et al. (2006) argue that size matters more than chemistry in determining CCN 25
ACPD
9, 12519–12558, 2009Aerosol optical properties relevant to
regional remote sensing of CCN
Y. Shinozuka et al.
Title Page
Abstract Introduction
Conclusions References
Tables Figures
◭ ◮
◭ ◮
Back Close
Full Screen / Esc
Printer-friendly Version
Interactive Discussion matters more in the atmosphere above Central Mexico and the US West Coast because
of more diverse aerosol sources than at the fixed site previously studied.
The variability inDd capparent at any given OMF, once adjusted for the measurement error, provides an estimate of uncertainty in bulk-chemistry-basedDd c observations.
To quantify the apparent variability, the root mean square (RMS) of the log10κdifference
5
between the individual data points and the fit was calculated. It is between 0.1 and 0.2. That translates into 25–50% relative apparent variation inκ depending on the dry particle diameter (∼35% for 100-nm particles), as listed in the right most column of
Table 1, and into an 8–14% variation inDd c. This degree of deviation from the fit is smaller than the estimated measurement uncertainty of∼20% inDd c(Sect. 3.2), even
10
without considering the likely exaggeration due to the∼10% measurement uncertainty
in OMF (Sect. 2.2). That implies that the natural variability in critical dry diameter at a given OMF is much smaller than∼20%. In other words, the CCN activity of particles
does not noticeably vary among ionic species and among organic species, or with their state of mixing. It is very useful that the OMF constrainsDd cto such a small range of 15
values for a collection of aerosols of unknown detailed chemical properties and state of mixing.
Meanwhile, theDd cderived from the CCN counter measurements shown in Fig. 2c and d is more variable than those based on the TDMA measurement (Fig. 3c and d). As the vertical black bars indicate, the apparent variability inDd cfor each bin average
20
value exceeds half a logarithmic decade, significantly larger than those for the TDMA-based measurements. The RMS of the log10κ difference between the individual data
points and the fit over the entire OMF span is 0.52 for Central Mexico and 0.61 for the US West Coast. This is largely caused by pressure variations in the CCN col-umn, in which a constant pressure controller was not installed during our experiments. 25
The derivedDd c tends to be small especially when the CCN concentration exceeds
ACPD
9, 12519–12558, 2009Aerosol optical properties relevant to
regional remote sensing of CCN
Y. Shinozuka et al.
Title Page
Abstract Introduction
Conclusions References
Tables Figures
◭ ◮
◭ ◮
Back Close
Full Screen / Esc
Printer-friendly Version
Interactive Discussion 0.3 and 0.6, not the low values for which Dd c is expected to be small. Even so, the
average appears to agree reasonably with the TDMA estimates (Fig. 4).
In summary,Dd cfor 0.2% supersaturation is near 100 nm over Central Mexico and the US West Coast, and correlated with the OMF over 0.2–0.8 and 0–0.8, respectively. If the critical dry diameter at a given OMF value varies by much less than 20%, as 5
our TDMA measurements suggest, knowledge of the OMF would certainly improve estimation of CCN concentration.
4 Optical signatures of the organic mass fraction and hygroscopicity
4.1 Optical signatures of the organic mass fraction
Remote-sensing-based estimates of bulk aerosol chemistry, which would facilitate in-10
ference of CCN activity as discussed in the previous section, requires well-defined relationships between aerosol optical and chemical properties. Few examples of such relationships are known. Both ionic and organic compounds typically reside in the ac-cumulation mode and have similar values of refractive index, resulting in similar light scattering efficiency and wavelength dependence between them. Over Central Mex-15
ico, however, the wavelength dependences of light extinction and absorption can help differentiate aerosol components, as demonstrated below.
4.1.1 Wavelength dependence of extinction
Several remote-sensing instruments are capable of retrieving the Angstrom exponent of extinction (−∆logσ/∆logλ, whereσ is the extinction, andλ, the wavelength), albeit
20
on a column integral basis (Remer et al., 2006; Kahn et al., 2005). If related to the Angstrom exponent, aerosol chemical properties such as the organic mass fraction (OMF) may be estimated from space-borne and ground optical measurements.
ACPD
9, 12519–12558, 2009Aerosol optical properties relevant to
regional remote sensing of CCN
Y. Shinozuka et al.
Title Page
Abstract Introduction
Conclusions References
Tables Figures
◭ ◮
◭ ◮
Back Close
Full Screen / Esc
Printer-friendly Version
Interactive Discussion figure, were identified not only by the optical properties (the extinction Angstrom
expo-nent and the single scattering albedo, SSA, at 530 nm) but also by air mass location and relative humidity (not shown). The most prominent outlier is the dust, charac-terized by the extinction Angstrom exponent smaller than 1.3 and SSA near 0.98. The coarse/submicron volume ratio derived from the OPC size distribution (not shown) gen-5
erally exceeds 20 for these samples. Another outlier group, the marine aerosols sam-pled over Gulf of Mexico over 0–2 km above sea level also had low extinction Angstrom exponent, indicative of coarse sea salt particles. Sulfate mass, presumably derived from precursors of oceanic origin and possibly from the volcanic and refinery sources nearby (DeCarlo et al., 2008), kept the organic fraction of submicron marine aerosols 10
low (<∼0.4). Furthermore, the air masses sampled to the east of 94◦W had high
Angstrom exponents and generally high OMF, as expected for biomass burning plumes that dominated the observed aerosol concentrations when sampling near and over the Yucatan peninsula (Yokelson et al., 2009). Satellite algorithms are likely to identify these outliers by their geographical location and wavelength dependence, as well as 15
ancillary model or satellite information of surface wind speed, humidity, existence of elevated plumes and other environmental parameters.
After excluding these air mass types, our Central Mexico pollution data show a clear anti-correlation. A fit of the extinction Angstrom exponent,Aext, to the median values in
OMF bins with a width of 0.1 is 20
Aext=−0.70∗OMF+2.0 (5)
This linear regression, if extrapolated, reaches extinction Angstrom exponent of 2.0 and 1.3 for completely ionic and organic non-refractory aerosols, respectively.
The equation above, in a reversed form (OMF=−(Aext–2.0)/0.70), predicts the
or-ganic mass fraction for a known value of extinction Angstrom exponent. The root mean 25
square (RMS) of the difference between the observed and fitted OMF values, a mea-sure of the predictability, is 0.3. In terms of the sulfate mass fraction (SMF) Aext is
ACPD
9, 12519–12558, 2009Aerosol optical properties relevant to
regional remote sensing of CCN
Y. Shinozuka et al.
Title Page
Abstract Introduction
Conclusions References
Tables Figures
◭ ◮
◭ ◮
Back Close
Full Screen / Esc
Printer-friendly Version
Interactive Discussion nitrate fraction shows an even weaker relationship with the Angstrom exponent. The
Angstrom exponent for ambient (not necessarily dry) aerosols would relate to the OMF similarly. This is because, unless the RH is higher than 95%, humidity changes do not significantly influence the wavelength dependence, as the scattering coefficients at all wavelengths change by similar factors and because absorption is usually a minor 5
fraction of extinction. According to a simulation of diameter growth factor using the size distributions over North America (Shinozuka et al., 2007) and another similar calcula-tion (Anderson et al., 2005), the absolute difference in Angstrom exponent between dry and ambient conditions is 0.2 or smaller, unless both the humidity response and the dry Angstrom exponent exceed∼2.
10
In the rest of this section we attempt to ascertain the cause for the anti-correlation between OMF and extinction Angstrom exponent. First we demonstrate that the ob-served relationship is a manifestation of coexistence of coarse particles and submicron organic masses over the region. Then we discuss potential causes of their link.
The presence of coarse particles predictably dominates the variation in the Angstrom 15
exponent. The OPC size distribution averaged over the entire experiment over Central Mexico for different OMF values (0.2–0.4, 0.4–0.6, 0.6–0.8) are shown in Fig. 5b. The size distribution of extinction was computed with Mie theory with a constant refractive index of 1.59, divided (normalized) by the simultaneously measured nephelometer to-tal scattering coefficient and averaged. Concentrations of both unheated and heated 20
(to 300◦C) particles are enhanced above 5µm, particularly for the highest OMF bin. Consistently, the calculated Angstrom exponent (thin squares in Fig. 5a) matches the nephelometer-based Angstrom exponent within 0.2, and varies almost as widely if a little more steeply with the OMF. In contrast, that calculated for OPC particles up to 750 nm, which roughly corresponds to 1µm aerodynamic diameter, varies between 25
ACPD
9, 12519–12558, 2009Aerosol optical properties relevant to
regional remote sensing of CCN
Y. Shinozuka et al.
Title Page
Abstract Introduction
Conclusions References
Tables Figures
◭ ◮
◭ ◮
Back Close
Full Screen / Esc
Printer-friendly Version
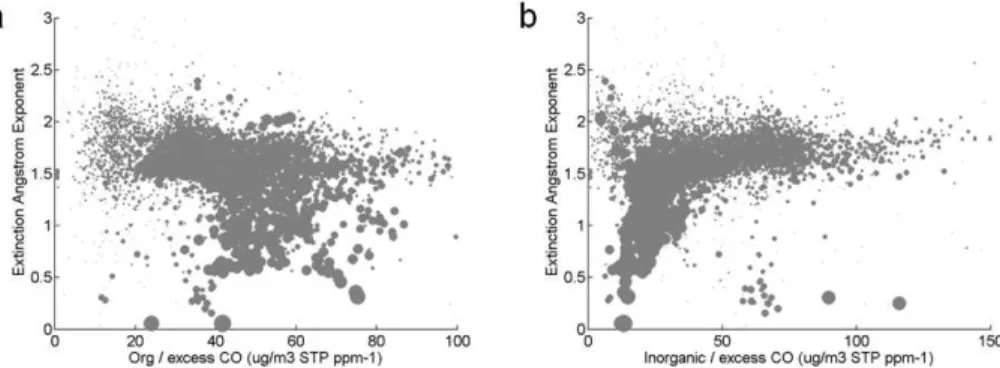
Interactive Discussion Low wavelength dependence was typically associated with relatively high organic
and low inorganic mass in submicron aerosols. Figure 6 compares the extinction Angstrom exponent with the mass of submicron non-refractory organic/inorganic ma-terial divided by excess CO (total CO minus the background value, the latter varying around ∼0.07 ppmv from flight to flight (DeCarlo et al., 2008)). The relative organic
5
mass often exceeded 40µg m−3
STP ppm−1, and the relative inorganic mass seldom exceeded 30µg m−3
STP ppm−1, when the extinction Angstrom exponent was near or below 1.3. This is in contrast to cases with high Angstrom exponent where mass of each component took a wider range of values.
The cause for the coexistence of coarse particles and submicron organic mass is, 10
meanwhile, unclear. Dust has been observed to effectively take up aerosol precur-sors such as sulfur dioxide (SO2), nitrogen dioxide (NO2) and nitric acid (HNO3) on
the surface (Zhang et al., 2000; Kline et al., 2004; McNaughton et al., 2009), due to the presence of iron and manganese as catalysts for the formation of these anions, fixing with calcium carbonate or reaction of sulfuric and nitric acids. Dust uptake would 15
decrease the anion supply to the non-dust submicron particles. Indeed, the ratio of inorganic mass to excess carbon monoxide concentration was observed to decrease with decreasing Angstrom exponent (Fig. 6b). This could increase the OMF, the relative measure of organic mass in the submicron aerosols. However, this hypothesis about the inorganic compounds and dust does not explain the persistently high submicron 20
organic mass observed under low Angstrom exponent (Fig. 6a).
Unregulated combustion in power plants and other industrial processes may gener-ate significant coarse fly ash and submicron organic mgener-aterial. Some air masses from recent forest fires, marked by enhanced hydrogen cyanide (HCN) relative to carbon monoxide, were associated with supermicron particles, but not all of them were. Aiken 25
ACPD
9, 12519–12558, 2009Aerosol optical properties relevant to
regional remote sensing of CCN
Y. Shinozuka et al.
Title Page
Abstract Introduction
Conclusions References
Tables Figures
◭ ◮
◭ ◮
Back Close
Full Screen / Esc
Printer-friendly Version
Interactive Discussion represent only a small fraction of the observed data anyway.
4.1.2 Wavelength dependence of absorption
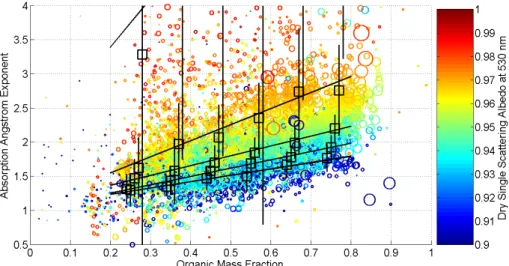
Particle absorption may eventually become a tool for identifying some aerosol com-ponents by satellite observations. Figure 7 illustrates the relationship among the Angstrom exponent of absorption (AAE) obtained with the 3-wavelength PSAP (plot-5
ted over the vertical axis), single scattering albedo at 530 nm (SSA, indicated by the marker color) and OMF (horizontal axis) over Central Mexico. For the SSA classes up to 0.98 shown in the figure, the wavelength dependence of absorption decreases with decreasing OMF. If extrapolated to an OMF of 0, indicative of absence of organic material and, as discussed in Sect. 4.1.1, dust, the AAE would be 1.0–1.1. This obser-10
vation is consistent with the fact that black carbon absorbs strongly at all wavelengths (Bergstrom et al., 2002; Kirchstetter et al., 2004). It is also evident that the AAE gen-erally increases as OMF or SSA increases. This can be explained by the presence of humic like substances (HULIS) and dust, which are colored (i.e., high AAE), weak (high SSA) absorbers associated with high OMF.
15
The OMF-SSA-AAE relationships given in Fig. 7 can be used to test model calcula-tions for Central Mexico. Also, high wavelength dependence of absorption in the visible wavelengths may be associated with even higher dependence near 300 nm, as Barnard et al. (2008) observed in Mexico City. That may have implications on photolysis rates (of NO2, for example), satellite retrievals of certain trace gases and solar heating rates.
20
ACPD
9, 12519–12558, 2009Aerosol optical properties relevant to
regional remote sensing of CCN
Y. Shinozuka et al.
Title Page
Abstract Introduction
Conclusions References
Tables Figures
◭ ◮
◭ ◮
Back Close
Full Screen / Esc
Printer-friendly Version
Interactive Discussion
4.2 Wavelength dependence of extinction and hygroscopicity
The CCN activity may be extrapolated from the humidity response of aerosol size below saturation, as discussed in Sect. 3.2. Consequently, remote sensing of aerosol hygro-scopicity would be of value in refining remote sensing of CCN. Unfortunately, only a weak relationship was evident between the TDMA hygroscopicity and the extinction 5
Angstrom exponent (Fig. 3a). For the air masses with high dust mass indicated by the extinction Angstrom exponent smaller than 1.3, the growth factor is near 1, as expected for its hydrophobic nature.
5 Conclusions
Aerosol chemical composition, hygroscopicity, size distributions and multi-wavelength 10
scattering/absorption as well as CCN number concentrations were measured over Central Mexico and the US West Coast from aircraft. The relationships between these aerosol properties were examined to assess whether the optical signals that satellites detect can be used to assess aerosol properties including the critical dry diameter. The remote sensing strategy employed in this study is to infer the aerosol chemical 15
composition and to derive the critical dry diameter at 0.2% supersaturation. This su-persaturation is characteristic of extensive low and weakly convective clouds expected to exert a significant climate impact. The findings were:
– The hygroscopicity parameter, κ, for dry 100 nm particles decreases with the organic fraction of submicron non-refractory aerosol mass (OMF) as 20
10(−0.43−0.44∗OMF) and 10(−0.29−0.70∗OMF) over Central Mexico and the US West Coast, respectively. These fits represent the critical dry diameter, which is cen-tered near 100 nm but varied asκ(−1/3)
, within measurement uncertainty (∼20%).
ACPD
9, 12519–12558, 2009Aerosol optical properties relevant to
regional remote sensing of CCN
Y. Shinozuka et al.
Title Page
Abstract Introduction
Conclusions References
Tables Figures
◭ ◮
◭ ◮
Back Close
Full Screen / Esc
Printer-friendly Version
Interactive Discussion stronger impact of the aerosol chemical composition in determining the CCN
con-centration over the regions we investigated compared to weaker dependencies recently found for fixed-point studies elsewhere (Sect. 3).
– OMF may be inferred from optical measurements (and possibly remote sensing) to an absolute uncertainty of about 0.3 for Central Mexico’s pollution particles. 5
Its anti-correlation with the extinction Angstrom exponent (Aext) was observed to
be Aext=−0.70*OMF+2.0. The cause for the underlying coexistence of coarse
particles and submicron organic mass is not clear (Sect. 4.1.1).
– The Angstrom exponent of absorption increased with OMF, more rapidly under higher SSA, as expected for the interplay between soot and colored weak ab-10
sorbers (some organic species and dust) (Sect. 4.1.2).
These observations provide an improved context for understanding the capabilities and limitations for inferring CCN from spectral remote sensing. Moreover, regional charac-teristics that link spectral properties to aerosol physical chemistry suggest potential for tailoring retrievals to specific regions. An example was given for Central Mexico 15
where coarse particle dust revealed in the extinction Angstrom exponent was related to the organic mass fraction of the accumulation mode. Likewise, different couplings between aerosol physicochemistry and optics may exist over other regions. Implement-ing retrieval schemes for individual reasons will probably be essential to the objective of inferring CCN using remote sensing.
20
Acknowledgements. We would like to acknowledge support of part of our team through NASA grant NNG04GB39G for this work. YS was partially funded by NASA Earth System Sci-ence Graduate Student Fellowship (ESSF/05-0000-0186, 06-ESSF 06R-0111, 07-Earth07R-0100) and NASA Postdoctoral Fellowship. EJD, PFD, and JLJ were supported by NASA NNG06GB03G and NSF-ATM 0513116 and ATM-0513116, and PDF was recipient of an EPA 25
ACPD
9, 12519–12558, 2009Aerosol optical properties relevant to
regional remote sensing of CCN
Y. Shinozuka et al.
Title Page
Abstract Introduction
Conclusions References
Tables Figures
◭ ◮
◭ ◮
Back Close
Full Screen / Esc
Printer-friendly Version
Interactive Discussion
References
Aiken, A. C., DeCarlo, P. F., and Jimenez, J. L.: Elemental Analysis of Organic Species with Electron Ionization High-Resolution Mass Spectrometry, Analyt. Chemistry, 79, 8350–8358, 2007.
Aiken, A. C., DeCarlo, P. F., Kroll, J. H., et al.: O/C and OM/OC Ratios of Primary, Secondary, 5
and Ambient Organic Aerosols with High Resolution Time-of-Flight Aerosol Mass Spectrom-etry, Environ. Sci. Technol., 42, 4478–4485, 2008.
Aiken, A. C., Salcedo, D., Cubison, M. J., Huffman, J. A., DeCarlo, P. F., Ulbrich, I. M., Docherty, K. S., Sueper, D., Kimmel, J. R., Worsnop, D. R., Trimborn, A., Northway, M., Stone, E. A., Schauer, J. J., Volkamer, R., Fortner, E., de Foy, B., Wang, J., Laskin, A., Shutthanandan, 10
V., Zheng, J., Zhang, R., Gaffney, J., Marley, N. A., Paredes-Miranda, G., Arnott, W. P., Molina, L. T., Sosa, G., and Jimenez, J. L.: Mexico City aerosol analysis during MILAGRO using high resolution aerosol mass spectrometry at the urban supersite (T0) – Part 1: Fine particle composition and organic source apportionment, Atmos. Chem. Phys. Discuss., 9, 8377–8427, 2009, http://www.atmos-chem-phys-discuss.net/9/8377/2009/.
15
Albrecht, B. A.: Aerosols, cloud microphysics, and fractional cloudiness, Science, 245, 1227– 1230, 1989.
Allan, J. D., Coe, H., Bower, K. N., et al.: Technical note: Extraction of chemically resolved mass spectra from Aerodyne aerosol mass spectrometer data, J. Aerosol Sci., 35, 909–922, 2004.
20
An, W. J., Pathak, R. K., Lee, B. H., and Pandis, S. N.: Aerosol volatility measurement using an improved thermodenuder: Application to secondary organic aerosol, J. Aerosol Sci., 38, 305–314, doi:10.1016/j.jaerosci.2006.12.002, 2007.
Anderson, T. L., Covert, D. S., Marshall, S. F., Laucks, M. L., Charlson, R. J., Waggoner, A. P., Ogren, J. A., Caldow, R., Holm, R. L., Quant, F. R., Sem, G. J., Wiedensohler, A., Ahlquist, 25
N. A., and Bates, T. S.: Performance characteristics of a high-sensitivity, three-wavelength, total scatter/backscatter nephelometer, J. Atmos. Oceanic Technol., 13, 967–986, 1996. Anderson, T. L., Masonis, S. J., Covert, D. S., Ahlquist, N. C., Howell, S. G., Clarke,
A. D., and McNaughton, C. S.: Variability of aerosol optical properties derived from in situ aircraft measurements during ACE-Asia, J. Geophys. Res., 108(D23), 8647, 30
doi:10.1029/2002JD003247, 2003.
ACPD
9, 12519–12558, 2009Aerosol optical properties relevant to
regional remote sensing of CCN
Y. Shinozuka et al.
Title Page
Abstract Introduction
Conclusions References
Tables Figures
◭ ◮
◭ ◮
Back Close
Full Screen / Esc
Printer-friendly Version
Interactive Discussion the MODIS satellite retrieval of aerosol fine-mode fraction, J. Geophys. Res., 110, D18204,
doi:10.1029/2005JD005978, 2005.
Barnard, J. C., Volkamer, R., and Kassianov, E. I.: Estimation of the mass absorption cross section of the organic carbon component of aerosols in the Mexico City Metropolitan Area, Atmos. Chem. Phys., 8, 6665–6679, 2008,
5
http://www.atmos-chem-phys.net/8/6665/2008/.
Bergstrom, R. W., Russell, P. B., and Hignett, P.: Wavelength dependence of the absorption of black carbon particles: Predictions and results from the TARFOX experiment and implica-tions for the aerosol single scattering albedo, J. Atmos. Sci., 59(3), 567–577, 2002.
Bond, T. C., Anderson, T. L., and Campbell, D.: Calibration and intercomparison of filter-based 10
measurements of visible light absorption by aerosols, Aerosol Sci. Technol., 30, 582–600, 1999.
Canagaratna, M. R., Jayne, J. T., Jimenez, J. L., et al.: Chemical and Microphysical Charac-terization of Ambient Aerosols with the Aerodyne Aerosol Mass Spectrometer, Mass Spec-trometry Rev., 26, 185–222, 2007.
15
Cappa, C. D., Lack, D. A., Burkholder, J. B., and Ravishankara, A. R.: Bias in filter based aerosol light absorption measurements due to organic aerosol loading: Evidence from labo-ratory measurements, Aerosol Sci. Technol., 42(12), 1022–1032, 2008.
Clarke, A. D.: A thermo-optic technique for in situ analysis of size-resolved aerosol physico-chemistry, Atmos. Environ., 25A, 635–644, 1991.
20
Clarke, A. D., Varner, J. L., Eisele, F., Mauldin, R. L., Tanner, D., and Litchy, M.: Particle production in the remote marine atmosphere: Cloud outflow and subsidence during ACE 1, J. Geophys. Res., 103(D13), 16397–16409, 1998.
Cubison, M. J., Ervens, B., Feingold, G., Docherty, K. S., Ulbrich, I. M., Shields, L., Prather, K., Hering, S., and Jimenez, J. L.: The influence of chemical composition and mixing state of 25
Los Angeles urban aerosol on CCN number and cloud properties, Atmos. Chem. Phys., 8, 5649–5667, 2008, http://www.atmos-chem-phys.net/8/5649/2008/.
DeCarlo, P., Slowik, J. G., Worsnop, D. R., Davidovits, P., and Jimenez, J. L.: Parti-cle Morphology and Density Characterization by Combined Mobility and Aerodynamic Diameter Measurements. Part 1: Theory, Aerosol Sci. Technol., 38, 1185–1205, 30
doi:10.1080/027868290903907, 2004.
ACPD
9, 12519–12558, 2009Aerosol optical properties relevant to
regional remote sensing of CCN
Y. Shinozuka et al.
Title Page
Abstract Introduction
Conclusions References
Tables Figures
◭ ◮
◭ ◮
Back Close
Full Screen / Esc
Printer-friendly Version
Interactive Discussion Weinheimer, A. J., Montzka, D. D., Campos, T., and Jimenez, J. L.: Fast airborne aerosol size
and chemistry measurements above Mexico City and Central Mexico during the MILAGRO campaign, Atmos. Chem. Phys., 8, 4027–4048, 2008,
http://www.atmos-chem-phys.net/8/4027/2008/.
DeCarlo, P. F., Kimmel, J. R., Trimborn, A., Northway, M. J., Jayne, J. T., Aiken, A. C., Gonin, M., 5
Fuhrer, K., Horvath, T., Docherty, K. S., Worsnop, D. R., and Jimenez, J. L.: Field-Deployable, High-Resolution, Time-of-Flight Aerosol Mass Spectrometer, Anal. Chem., 78(24), 8281– 8289, 2006.
Dunlea, E. J., DeCarlo, P. F., Aiken, A. C., Kimmel, J. R., Peltier, R. E., Weber, R. J., Tomlison, J., Collins, D. R., Shinozuka, Y., McNaughton, C. S., Howell, S. G., Clarke, A. D., Emmons, L. 10
K., Apel, E. C., Pfister, G. G., van Donkelaar, A., Martin, R. V., Millet, D. B., Heald, C. L., and Jimenez, J. L.: Evolution of Asian aerosols during transpacific transport in INTEX-B, Atmos. Chem. Phys. Discuss., 8, 15375–15461, 2008,
http://www.atmos-chem-phys-discuss.net/8/15375/2008/.
Dusek, U., Frank, G. P., Hildebrandt, L., et al.: Size Matters More Than Chemistry for Cloud-15
Nucleating Ability of Aerosol Particles, Science, 312, 1375–1378, 2006.
Ervens, B., Cubison, M., Andrews, E., Feingold, G., Ogren, J. A., Jimenez, J. L., DeCarlo, P., and Nenes, A.: Prediction of CCN number concentration using Measurements of Aerosol Size Distributions and Composition and Light Scattering Enhancement due to Humidity, J. Geophys. Res.-Atmos., 112, D10S32, doi:10.1029/2006JD007426, 2007.
20
Facchini, M. C., Mircea, M., Sandro, F., and Charlson, R. J.: Cloud albedo enhancement by surface-active organic solutes in growing droplets, Nature, 401(6750), 257–259, 1999. Faulhaber, A. E., Thomas, B. M., Jimenez, J. L., Jayne, J. T., Worsnop, D. R., and Ziemann,
P. J.: Characterization of a thermodenuder-particle beam mass spectrometer system for the study of organic aerosol volatility and composition, Atmos. Meas. Tech., 2, 15–31, 2009, 25
http://www.atmos-meas-tech.net/2/15/2009/.
Gasparini, R., Li, R., and Collins, D. R.: Integration of size distributions and size-resolved hygroscopicity measured during the Houston Supersite for compositional categorization of the aerosol, Atmos. Environ., 38(20), 3285–3303, 2004.
Gunthe, S. S., King, S. M., Rose, D., Chen, Q., Roldin, P., Farmer, D. K., Jimenez, J. L., 30
ACPD
9, 12519–12558, 2009Aerosol optical properties relevant to
regional remote sensing of CCN
Y. Shinozuka et al.
Title Page
Abstract Introduction
Conclusions References
Tables Figures
◭ ◮
◭ ◮
Back Close
Full Screen / Esc
Printer-friendly Version
Interactive Discussion 3870, 2009, http://www.atmos-chem-phys-discuss.net/9/3811/2009/.
Hartz, K. E. H., Tischuk, J. E., Chan, M. N., Donahue, C. K. C. N. M., and Pandis, S. N.: Cloud condensation nuclei activation of limited solubility organic aerosol, Atmos. Environ., 40(4), 605–617, 2006.
Heald, C. L., Goldstein, A. H., Allan, J. D., Aiken, A. C., Apel, E., Atlas, E. L., Baker, A. K., 5
Bates, T. S., Beyersdorf, A. J., Blake, D. R., Campos, T., Coe, H., Crounse, J. D., DeCarlo, P. F., de Gouw, J. A., Dunlea, E. J., Flocke, F. M., Fried, A., Goldan, P., Griffin, R. J., Herndon, S. C., Holloway, J. S., Holzinger, R., Jimenez, J. L., Junkermann, W., Kuster, W. C., Lewis, A. C., Meinardi, S., Millet, D. B., Onasch, T., Polidori, A., Quinn, P. K., Riemer, D. D., Roberts, J. M., Salcedo, D., Sive, B., Swanson, A. L., Talbot, R., Warneke, C., Weber, R. J., Weibring, 10
P., Wennberg, P. O., Worsnop, D. R., Wittig, A. E., Zhang, R., Zheng, J., and Zheng, W.: Total observed organic carbon (TOOC) in the atmosphere: a synthesis of North American observations, Atmos. Chem. Phys., 8, 2007–2025, 2008,
http://www.atmos-chem-phys.net/8/2007/2008/.
Heintzenberg, J. and Charlson, R. J.: Design and Applications of the Integrating Nephelometer: 15
A Review, J. Atmos. Oceanic Technol., 13, 987–1000, 1996.
Hoppel, W. A., Frick, G. M., and Fitzgerald, J. W.: Deducing droplet concentration and super-saturation in marine boundary layer clouds from surface aerosol measurements, J. Geophys. Res., 101(D21), 26553–26565, 1996.
Hudson, J. G. and Svensson, G.: Cloud Microphysical Relationships in California Marine Stra-20
tus, J. Appl. Meteorol., 34(12), 2655–2666, 1995.
Huffman, J. A., Ziemann, P. J., Jayne, J. T., Worsnop, D. R., and Jimenez, J. L.: Development and Characterization of a Fast-Stepping/Scanning Thermodenuder for Chemically-Resolved Aerosol Volatility Measurements, Aerosol Sci. Technol., 42, 395–407, 2008.
Dusek, U., Frank, G. P., Hildebrandt, L., et al.: Ambient Aerosol Sampling with an Aerosol Mass 25
Spectrometer, J. Geophys. Res., 108, 8425, doi:8410.1029/2001JD001213, 2003.
Kahn, R. A., Gaitley, B. J., Martonchik, J. V., et al.: Multiangle Imaging Spectrora-diometer (MISR) global aerosol optical depth validation based on 2 years of coincident Aerosol Robotic Network (AERONET) observations, J. Geophys. Res., 110, D10S04, doi:10.1029/2004JD004706, 2005.
30
ACPD
9, 12519–12558, 2009Aerosol optical properties relevant to
regional remote sensing of CCN
Y. Shinozuka et al.
Title Page
Abstract Introduction
Conclusions References
Tables Figures
◭ ◮
◭ ◮
Back Close
Full Screen / Esc
Printer-friendly Version
Interactive Discussion E., Stephanou, E. G., and Wilson, J.: Organic aerosol and global climate modelling: a review,
Atmos. Chem. Phys., 5, 1053–1123, 2005, http://www.atmos-chem-phys.net/5/1053/2005/. King, S. M., Rosenoern, T., Shilling, J. E., Chen, Q., and Martin, S. T.: Cloud condensation
nucleus activity of secondary organic aerosol particles mixed with sulfate, Geophys. Res. Lett., 34, L24806, doi:10.1029/2007GL030390, 2007.
5
Kirchstetter, T. W., Novakov, T., and Hobbs, P. V.: Evidence that the spectral dependence of light absorption by aerosols is affected by organic carbon, J. Geophys. Res., 109, D21208, doi:10.1029/2004JD004999, 2004.
Kline, J., Huebert, B., Howell, S., Blomquist, B., Zhuang, J., Bertram, T., and Carrillo, J.: Aerosol composition and size versus altitude measured from the C-130 during ACE-Asia, J. Geophys. 10
Res., 109, D19S08, doi:10.1029/2004JD004540, 2004.
Lance, S., Medina, J., Smith, J., and Nenes, A.: Mapping the Operation of the DMT Continuous Flow CCN Counter, Aerosol Sci. Technol., 40, 242–254, 2006.
McNaughton, C. S., Clarke, A. D., Howell, S. G., Pinkerton, M., Anderson, B. E., Thornhill, K. L., Winstead, E. L., Hudgins, C. H., Dibb, J. E., Scheuer, E., and Maring, H.: Results from the 15
DC-8 inlet characterization experiment (DICE): Airborne versus surface sampling of mineral dust and sea salt aerosols, Aerosol Sci. Technol., 41(2), 136–159, 2007.
McNaughton, C. S., Clarke, A. D., Kapustin, V., Shinozuka, Y., Howell, S. G., Anderson, B. E., Winstead, E., Dibb, J., Scheuer, E., Cohen, R. C., Wooldridge, P., Perring, A., Huey, L. G., Kim, S., Jimenez, J. L., Dunlea, E. J., DeCarlo, P. F., Wennberg, P. O., Crounse, J. D., Wein-20
heimer, A. J., and Flocke, F.: Observations of heterogeneous reactions between Asian pol-lution and mineral dust over the Eastern North Pacific during INTEX-B, Atmos. Chem. Phys. Discuss., 9, 8469–8539, 2009, http://www.atmos-chem-phys-discuss.net/9/8469/2009/. Molina, L. T., Madronich, S., Gaffney, J., et al.: An Overview of MILAGRO 2006 Campaign:
Mexico City Emissions and its Transport and Transformation, Atmos. Chem. Phys. Discuss., 25
in preparation, 2009.
Nenes, A., Charlson, R. J., Facchini, M. C., Kulmala, M., Laaksonen, A., and Seinfeld, J. H.: Can chemical effects on cloud droplet number rival the first indirect effect?, Geophys. Res. Lett., 29(17), 1848, doi:10.1029/2002GL015295, 2002.
Petters, M. D. and Kreidenweis, S. M.: A single parameter representation of hygroscopic growth 30
and cloud condensation nucleus activity, Atmos. Chem. Phys., 7, 1961–1971, 2007, http://www.atmos-chem-phys.net/7/1961/2007/.
ACPD
9, 12519–12558, 2009Aerosol optical properties relevant to
regional remote sensing of CCN
Y. Shinozuka et al.
Title Page
Abstract Introduction
Conclusions References
Tables Figures
◭ ◮
◭ ◮
Back Close
Full Screen / Esc
Printer-friendly Version
Interactive Discussion Klett, Kluwer Academic Pub, Dordrecht, The Netherlands, 1980.
Quinn, P. K., Bates, T. S., Baynard, T., et al.: Impact of particulate organic matter on the relative humidity dependence of light scattering: A simplified parameterization, Geophys. Res. Lett., 32, L22809, doi:22810.21029/22005GL024322, 2005.
Raymond, T. M. and Pandis, S. N.: Cloud activation of single-component organic aerosol parti-5
cles, J. Geophys. Res., 107(D24), 4787, doi:10.1029/2002JD002159, 2002.
Remer, L. A., Kaufman, Y. J., Tanr ´e, D., et al.: The MODIS Aerosol Algorithm, Products, and Validation, J. Atmos. Sci., 62, 947–973, 2006.
Roberts, G. C. and Nenes, A.: A Continuous-Flow Streamwise Thermal-Gradient CCN Cham-ber for Atmospheric Measurements, Aerosol Sci. Technol., 39, 206–221, 2005.
10
Rogers, R. R., Hair, J. W., Hostetler, C. A., Ferrare, R. A., Obland, M. D., Cook, A. L., Harper, D. B., Burton, S. P., Shinozuka, Y., McNaughton, C. S., Clarke, A. D., Redemann, J., Russell, P. B., Livingston, J. M., and Kleinman, L. I.: NASA LaRC airborne high spectral resolution lidar aerosol measurements during MILAGRO: observations and validation, Atmos. Chem. Phys. Discuss., 9, 8817–8856, 2009, http://www.atmos-chem-phys-discuss.net/9/8817/2009/. 15
Rose, D., Gunthe, S. S., Mikhailov, E., Frank, G. P., Dusek, U., Andreae, M. O., and P ¨oschl, U.: Calibration and measurement uncertainties of a continuous-flow cloud condensation nuclei counter (DMT-CCNC): CCN activation of ammonium sulfate and sodium chloride aerosol particles in theory and experiment, Atmos. Chem. Phys., 8, 1153–1179, 2008,
http://www.atmos-chem-phys.net/8/1153/2008/. 20
Shinozuka, Y., Clarke, A. D., Howell, S. G., Kapustin, V. N., McNaughton, C. S., Zhou, J., and Anderson, B. E.: Aircraft profiles of aerosol microphysics and optical properties over North America: Aerosol optical depth and its association with PM2.5 and water uptake, J. Geophys. Res., 112, D12S20, doi:10.1029/2006JD007918, 2007.
Shulman, M. L., Jacobson, M. C., Carlson, R. J., Synovec, R. E., and Young, T. E.: Dissolution 25
behavior and surface tension effects of organic compounds in nucleating cloud droplets, Geophys. Res. Lett., 23(3), 277–280, 1996.
Singh, H. B., Brune, W. H., Crawford, J. H., Jacob, D. J., and Russell, P. B.: Overview of the summer 2004 Intercontinental Chemical Transport Experiment-North America (INTEX-A), J. Geophys. Res., 111, D24S01, doi:10.1029/2006JD007905, 2006.
30