Iranian Journal of Basic Medical Sciences
ijbms.mums.ac.ir
The Lcn2-engineered HEK-293 cells show senescence under
stressful condition
Bahareh Bahmani
1, Fatemeh Amiri
2, Amaneh Mohammadi Roushandeh
3, Marzie Bahadori
2,
Mozhgan Dehghan Harati
2, Mehryar Habibi Roudkenar
2*
1 Anatomical Sciences Research Center, Kashan University of Medical Sciences, Kashan, Iran
2 Blood Transfusion Research Center, High Institute for Research and Education in Transfusion Medicine, Tehran, Iran 3 Anatomical Sciences Department, Medicine Faculty, Hamadan University of Medical Sciences, Hamadan, Iran A R T I C L E I N F O A B S T R A C T
Article type:
Original article Objective(s): stresses. The precise role of Lcn2 has not been fully understood yet. However, it plays a key role in Lipocalin2 (Lcn2) gene is highly expressed in response to various types of cellular
controlling vital cellular processes such as proliferation, apoptosis and metabolism. Recently it was shown that Lcn2 decreases senescence and increases proliferation of mesenchymal stem cells (MSC) with finite life span under either normal or oxidative stress conditions. However, Lcn2 effects on immortal cell line with infinite proliferation are not defined completely. Materials and
Materials and Methods: HEK-293 cells were transfected with recombinant pcDNA3.1 containing Lcn2 fragment (pcDNA3.1-Lcn2). Expression of lipocalin2 in transfected cells was evaluated by RT-PCR, real time RT-PCR, and ELISA. Different cell groups were treated with H2O2 and WST-1
assay was performed to determine their proliferation rate. Senescence was studied by β -galactosidase and gimsa staining methods as well as evaluation of the expression of senescence-related genes by real time RT-PCR.
Results: Lcn2 increased cell proliferation under normal culture condition, while the proliferation slightly decreased under oxidative stress. This decrease was further found to be attributed to senescence.
Conclusion: Our findings indicated that under harmful conditions, Lcn2 gene is responsible for the regulation of cell survival through senescence.
Article history: Received: Sep 13, 2014 Accepted: Feb 5, 2015
Keywords:
HEK-293 Lipocalin 2 Oxidative stress Proliferation Senescence
►
Please cite this paper as:Bahmani B, Amiri F, Mohammadi Roushandeh A, Bahadori M, Dehghan Harati M, Habibi Roudkenar M.The Lcn2-Engineered HEK-293 cells show senescence under stressful condition. Iran J Basic Med Sci 2015; 18:459-464.
Introduction
Senescence is an obstacle to cell proliferation. It was first introduced by Hayflick and his colleagues about 50 years ago (1). Recent studies have shown that this process plays an important role in many aspects of biological events such as aging, tissue repair and tumor suppression (2). P16/pRb and p53/p21 are two main pathways mainly involved in senescence but ongoing studies should be performed to completely elucidate its mechanisms (3).
It has been forty years since senescence was first defined as a cellular proliferation barrier. Nowadays, it has become clear that senescence is more than a simple process, and involves many mechanisms (2, 4). One kind of senescence which emerges in mild stress conditions with no effect on telomere length is stress-induced premature senescence (SIPS). There are several factors which induce SIPS in vitro including
trivial wrecking agent, scarcity of nutrient or
contaminated environments with reactive oxygen
species. Among these factors, oxidative stress plays the most important role in inducing SIPS (5).
Lipocalin 2 (Lcn2) is one of the strategic molecules that are expressed under oxidative stress conditions. Lcn2 which is also called neutrophil gelatinase-associated lipocalin (NGAL) belongs to a small family but with important duties. Lcn2 is induced under various pathophysiological conditions such as cancer (6, 7), inflammation (8, 9), cardiovascular disease (10, 11), intoxication (12), infection (13), oxidative stress (14) and considerably following renal injury (9, 15). As a matter of fact, the expression of Lcn2 rises to about 1000-fold in human and rodents in response to renal tubular injury, and its fast appearance in urine and serum makes it a useful early biomarker of renal failure (16).
Nevertheless, the precise role of Lcn2 has
still remained unknown (17). Interestingly, stimulators of Lcn2 expression are similar to those implicated in cellular senescence.
*Corresponding author: Mehryar Habibi Roudkenar. Blood Transfusion Research Center, High Institute for Research and Education in Transfusion Medicine,
In our previous study, we investigated the effect of Lcn2 on the senescence of mesenchymal stem cells that have finite proliferation (18), but here we investigated the influence of Lcn2 on human embryonic kidney (HEK) cells which can undergo numerous proliferations. This study was performed to investigate the relationship between Lcn2 expression and senescence in the kidney-derived cell line. Since H2O2 is
a well-known factor to induce senescence, therefore we over-expressed Lcn2 in HEK-293 cells and then studied the incidence of senescence in this cell line under sub-lethal doses of H2O2.
Materials and Methods
Cell Culture
Human hepatoma (HepG2) and human embryonic kidney 293 (HEK-293) were obtained from National Cell Bank (NCBI) of Pasteur Institute of Iran. These cell lines were grown in roswell park m institute-1640 (RPMI-1640) medium (Gibco-BRL, Germany) with 10% fetal bovine serum (FBS) (Gibco-BRL, Germany).
Isolation and cloning of Lcn2 cDNA
HepG2 cells were cultured in 25 cm2 flasks stuffed
with RPMI medium with 10%FBS. Total mRNA was extracted from the cells using RNeasy spin column kit (Qiagen, Germany), and subjected to cDNA synthesis using cDNA synthesis kit (Bioneer, Korea). Specific
primer set, forward ′-ACG AAT TCA CCA TGG TGC
CCC TAG GTC TCC TGT GGC TG- ′ and reverse ′-TAG
CGG CCG CTC AGC CGT CGA TAC ACT GGT C- ′ , and platinum Taq DNA polymerase (Invitrogen. USA) were used to amplify total length of human Lcn2. The amplified Lcn2 cDNA was cloned into mammalian expression vector pcDNA3.1 as described previously (19).
Plasmid transfection
The HEK- 9 cells were transfected with μg of the pcDNA3.1 and pcDNA3.1-Lcn2 plasmids
using FugenHD (Invitrogen, USA) according to the
manufacturer’s protocol. Stable clones expressing
recombinant lcn2 were established in the presence of 500 µg/ml of G418 (Sigma, USA). Then, the expression of Lcn2 mRNA and protein was evaluated by RT-PCR and ELISA.
Reverse transcriptase polymerase chain reaction
To evaluate the expression of Lcn2 in transfected cells (HEK293-Lcn2), reverse transcriptase polymerase chain reaction (RT-PCR) was performed 72 hrs after transfection. Total mRNA was extracted from the cells as previously mentioned and reverse transcribed into cDNA using cDNA Synthesis kit according to the
manufacturer’s suggested protocol. The expression of Lcn2 was measured with a primer pair, forward:
’-TCACCTCCGTCCTGTTTAGG- ’ and reverse:
’-CGAAGTCAGCTCCTTGGTTC- ’ that could amplify a
fragment of the human Lcn2 mRNA with the length of 240 bp. The expression of β-actin, a housekeep- ping gene, was also measured as control. Sequence
of β-actin primers were as follows: Forward:
′-TTCTACAATGAGCTGCGTGTGG- ′ and Reverse:
′-GTGTTGAAGGTCTCAAACATGAT- ′. PCR was perfo-
rmed with thermal cycling conditions including the primary denaturation step at 94 °C for 4 min followed
by 35 cycles of denaturation at 94 °C for 30 sec,
annealing at 59 °C for 30 sec, extension at 72 °C for 20
sec, and final extension at 72 °C for 5 min. Ultimately,
electrophoresis on 2% agarose gel was applied to analyze PCR products.
Enzyme linked immune-sorbent assay
Enzyme-linked immune sorbent assay (ELISA) was performed to evaluate the expression of Lcn2 protein. Human Lipocalin-2/NGAL immunoassay kit (R&D systems,USA) was used to determine the level of Lcn2 protein secreted into medium. 72 hrs after transfection, the medium was harvested. The samples were diluted (1:20) with a diluent solution, RD1-52 reagent, according to the manufacturer’s protocol. Next, µl of RD1-52 was added to each well and 50 µl of diluted samples were added and the plates were incubated at 4 ◦C for 2 hr. After rinsing the wells with washing buffer, 200 µl HRP-conjugated anti-Lcn2 antibody was added to each well. Wells were covered and incubated at 4◦C for 2 hr, and they were again rinsed with washing buffer. Next, 200 µl of the substrate solution was added to each well and the well plate was incubated at room temperature for 30 min in the dark. Finally, 50 µl of stop solution was added to each well, and the OD values were only measured at 450 nm using microplate reader.
H2O2 treatment
To treat different cell groups with sub-lethal dose of H2O2, the HEK-293-V (transfected with empty
pcDNA3.1 plasmid) and HEK293-Lcn2 (transfected with pcDNA3.1-Lcn2) cells were cultured in RPMI 1640 containing 10% FBS at 37 ˚C and % CO2 in humidified
incubator along with control group. H2O2 with final
concentration of 80 µM was added to the culture medium for different time duration (12-18 hr) to identify the optimized exposure time. Then, the medium was changed to recover the cells.
Cell proliferation assay
Different HEK-293 groups including HEK-293-V,
HEK293-Lcn2, H2O2-treated HEK-293-V
(HEK-293-V/H2O2), and H2O2-treated HEK293-Lcn2
(HEK-293-Lcn2/H2O2) were seeded in 96-well plate at the density
of 3×10³ cells/well. H2O2 treatment was performed as
described above after determining the optimized exposure time (80 µM of H2O2 for 18 hr). Then, cells
were cultured in CO2 incubator at 37 °C. The medium
were subjected to cell proliferation assay using water soluble tetrazolium salts-1 (WST-1) kit (Roche,
Germany according to manufacturer’s protocol. Next, the absorbance was measured using ELx800 Absorbance Microplate Reader at 450 nm. In addition, 1×10⁴ of these mentioned cells were seeded in a 6-well
plate both with and without H2O2 treatment and
incubated at 37 °C with 5% CO2. Afterwards, the cells
were trypsinized and detached every 3 days and their viability was measured with 0.4% trypan blue (Sigma, USA).
Senescence-associated β-Galactosidase Staining
The senescent cells were detected with senescence
�-galactosidase staining kit (Cell Signaling, Beverly, MA,
USA according to manufacturer’s protocol. The growth
media was removed and the cells were once rinsed with PBS. Next, a fixative solution containing 2% formaldehyde and 0.2% glutaraldehyde was added to the cells. Then, again the cells were rinsed with PBS two times and incubated with a staining solution containing 5-bromo-4-chloro-3-indolyl-D-galactopyranoside, citric acid/sodium phosphate (pH 6.0), 1.5 M NaCl, 20 mM
MgCl2, potassium ferrocyanide and potassium
ferricyanide. After 11 to 14 hr, light microscopy was applied to identify the senescent cells which can be visualized as blue cells. Thirty fields were randomly selected to calculate the percentage of SA-β-gal cells.
Real-Time RT-PCR Analysis
The expression of some genes that are attributed to be involved in senescence (20) were studied using real time RT-PCR analysis. The total RNA of H2O2
-treated and non--treated HEK293-Lcn2 was extra- cted and the cDNA was generated as described above.
Real time RT-PCR was performed to amplify the desired fragments using SYBR green PCR master
mix (Takara, Japan) and specific primer sets including
p )NK a forward: ’-GACATCCCCGATTGAAAGAA ’
andreverse: ’TTTACGGTAGTGGGGGAAGG ’; P K)P
forward: ’-TACAGACCCCCGCGGCCC- ’ and reverse:
’-TCCGCTAACCCCGTCTGGCT- ’; p forward: 5’-GGCCCACTTCACCGTACTAA- ’ and reverse:
’-GTGGTTTCAAGGCCAGATGT - ’; as well as Lcn
primers (primer sequence was described above). These primers were designed and blasted using NCBI database. PCR was performed with Rotor-gene RG-3000 (Corbett, Germany) and the corresponding PCR conditions. In each reaction 2 µl of cDNA was used in a mixture containing 25 μl of SYBR green PCR master mix Takara, Japan and 10 pmol of each gene-specific primer. The
amplification program was as follows: 1 min of
preincubation at 95 °C followed by 40 cycles of 15 sec
at 94 °C, 30s at optimized annealing temperature of
each primer pair, and 30 sec at 72 °C and then a step of
10 sec at 82 °C followed by melting curve analysis.
Data analysis was assessed using the Rotor Gene
software. Ct values were calculated and relative expression of the target genes was determined after
normalization against β-actin expression as an
endogenous standard.
Gimsa staining
Gimsa stain was employed to assess the size of the enlarged senescent cells. Cells were seeded on slides and incubated overnight. Then the culture media was removed and the cells were rinsed with PBS. The process was followed by soaking the slides in absolute methanol for 10 min; then, the slides were rinsed with water and soaked in 10% gimsa stain for 15 min, and finally, the slides were rinsed again with water and the cells were detected in violet under light microscopy.
Statistical analysis
Statistical analysis was performed using analysis of variance (ANOVA) and Student's t-test. In all of the tests, the significance was considered as P<0.05.
Result
Over-expression of Lcn2 in HEK-293 cells
HEK-293 cells were transfected with pcDNA3.1-Lcn2 in order to over-express pcDNA3.1-Lcn2. 72 hr later, pcDNA3.1-Lcn2 expression in transfected cells was confirmed by RT-PCR (data not shown). Being assayed with real time RT-PCR (Figure 1), the expression level of Lcn2 in lcn2 cells was estimated higher than that of HEK-V cells (which were transfected with empty pcDNA3.1 vector). ELISA confirmed these results and
demonstrated ectopic over-expression of Lcn2 in
HEK-lcn2 cells (Table 1).
Lcn2 expression is induced in HEK-293 cell lines by Oxidative stress
After several examinations, treatment with 80 µM of H2O2 for 18 hr was determined as optimized protocol
toinduceoxidativestress. Then, Lcn2expression was
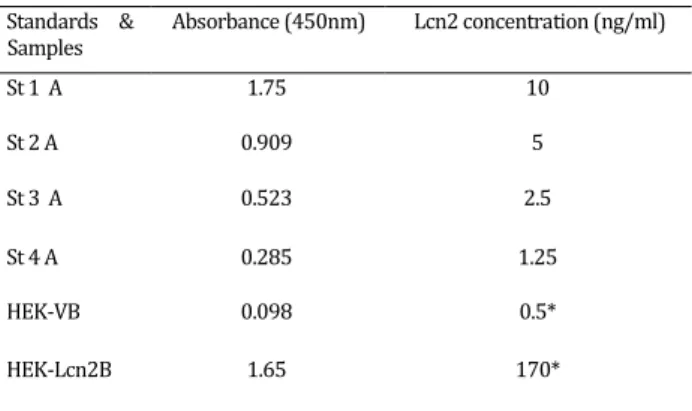
Table 1. ELISA for Lcn2 immunoassay. The Lcn2 concentration was calculated using standard curve in proportion to dilution ratio
Standards & Samples
Absorbance (450nm) Lcn2 concentration (ng/ml)
St 1 A 1.75 10
St 2 A 0.909 5
St 3 A 0.523 2.5
St 4 A 0.285 1.25
HEK-VB 0.098 0.5*
HEK-Lcn2B 1.65 170*
Figure 1. Assessment of Lcn2 expression at transcriptional level in HEK-293 by real-time RT-PCR. 72 hrs after transfection, the expression of Lcn2 in transfected cells was evaluated. The expression of Lcn2 mRNAs was significantly up-regulated in HEK293 transfected with Lcn2 compared with untransfected cells
Figure 2. Evaluation of Lcn2 expression in HEK-293 with real-time RT-PCR following H2O2 treatment. The ratio of Lcn to β-actin
expression was assessed both before and after treatment with H2O2.
The expression level of Lcn2 increased significantly following HEK-293 treatment with H2O2
evaluated both under normal and oxidative stress conditions using real time RT-PCR. Being exposed to sub-lethal doses of H2O2, HEK-293 significantly
increased the lcn2 expression, while in normal condition; the cell line was able to express far lower level of Lcn2. This fact was disclosed by RT-PCR (data not shown) and then certified by real time PCR analysis (Figure 2).
Lcn2 Over-expression differently affects the proliferation of the HEK-293 cells in both normal and oxidative stress conditions
WST-1 was performed to determine the
proliferation rate of different cell groups (H2O2-treated
and non-treated). Colony assay was also carried out and the number of colonies was enumerated. The findings
disclosed that when Lcn2 was over-expressed in the cells, the number of colonies increased under normal condition. In other words, HEK-293-Lcn2 colonies were more than those of HEK-293-V. However, when treated with H2O2, Lcn2 not only did not increase cell
proliferation in HEK-293 cells, but it also slightly decreased their proliferation rate (Figure3). After H2O2 treatment, the number of HEK-Lcn2 colonies inside the plate was less than that of HEK-V’s Figure .
Lcn2 affects the incidence of senescence in HEK 293 under oxidative stress condition
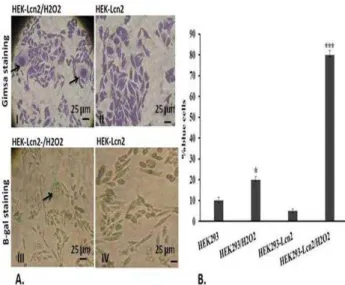
To investigate the Lcn2 over-expression effects on HEK-293 senescence both under normal and oxidative stress conditions, the cells were subjected to β-gal and gimsa staining. Gimsa staining results indicated the increasing number of enlarged HEK 293 cells , as a senescence sign, after H2O2 treatment (Figure4A.I)
compared with normal conditin Figure A.)) . Next, β -gal staining was exerted to indicate blue cells as
senescent cells. As shown in Figure A.))), positive β-gal staining was observed in H2O2-treated cells while there
were no blue senescent cells under normal condition with no H2O2 treatment (Figure4A.IV). Quantification of
β-gal staining results showed the number of senescent
cells in HEK-V and HEK-Lcn2 both under normal and oxidative conditions. In normal condition, the number of senescent HEK-V was more than that of HEK-Lcn2, but when the cells were treated with H2O2, the number
of senescent HEK-Lcn2 cells increased significantly (Figure 4B). As a result, Lcn2 increases the senescence of HEK-293 cells under oxidative stress condition.
Figure 3. The number of colonies of HEK-V and HEK-Lcn2 either with or without H2O2 treatment. The number of colonies was counted using
gimsa staining. Under normal condition (without any H2O2 treatment)
the number of HEK-Lcn2 colonies was more than HEK-V. However, after H2O2 treatment, the number of colonies in HEK-Lcn2 decreased
Figure 4. Detection of senescence before and after treatment with sub-lethal dose of H2O2using gimsa and β-gal staining. A. Gimsa
staining results indicated H2O2-induced cell enlargement through
senescence in HEK-Lcn2 cells (I) compared with non-treated ones (II).
Morover, β-gal staining confirmed the presence of blue cells after H2O2
treatment (III) while these blue cells were not seen (or seen rarely) in HEK-Lcn2 group (IV) (Scale bar: 25 µm B. Quantitative assay of β-Gal positive cells. The sub-lethal dose of H2O2 prompted senescent
phenotype in HEK-Lcn2 and senescence increased in HEK-Lcn2/H2O2
cells. (Data represents mean± SD; number of replicate=3, *P<0.01, ***P<0.001)
Figure 5. Real time RT-PCR analyses for p16, p27, p53 genes expressed in HEK-293/HEK-Lcn2 either with or without exposure to oxidative stress. According to these findings, HEK-293 expressed higher level of senescence-related genes compared to HEK-Lcn2 under normal condition. Besides, the expression of these genes were up-regulated in HEK-293-Lcn2/ H2O2 under oxidative stress condition
Over-expression of Lcn2 up-regulates the senescence-related genes in HEK 293 cell line
The expression of p16, p27 and p53 genes, as senescence-related genes, were evaluated with real time RT-PCR technique. Relative expression of the target genes was determined after normalization
against β-actin expression as a housekeeping gene. Following H2O2 treatment, Lcn2 up-regulated the
expression of p16, p27 and p53 (Figure 5). Overall, in consistent with previous results, after exposing the HEK-293-Lcn2 cells to H2O2, Lcn2 increased the rate of
senescence in these cells. Generally, in a normal condition, HEK-Lcn2 cells express the senescence genes minimally, while they highly express these genes during stressful conditions.
Discussion
Oxidative stress is involved in inducing stress-induced premature senescence (SIPS), but its mechanism is not clearly defined. We designed an experiment for a model of cells with infinite proliferation i.e. the immortal HEK-293 cell line to study the effects of both Lcn2 expression and oxidative stress on senescence which is considered as an obstacle to cell proliferation.
This cell line was selected in the current study as an
in vitro model to assess the over-expression of Lcn2 on the incidence of senescence. Since Lcn2 is dramatically induced following kidney injury, and the corresponding oxidative stress condition (15), we somewhat used kidney cells to understand the role of Lcn2 induction under oxidative stress. Therefore, we examined whether, in oxidative stress situations, Lcn2 can protect cells against stressors and decrease senescence. Unexpectedly, we observed that these engineered cells respond differently to either normal or oxidative stress conditions. Our results indicated that the different responses can be attributed to a cellular phenomenon called senescence. H2O2 considerably induced Lcn2
expression in HEK 293 cell line, while Lcn2 was slightly up-regulated when naïve hB-MSCs were exposed to sub-lethal doses of H2O2 (18). This could be due to the
presence of huge antioxidant depository in MSCs (21, 22). Which eliminates the necessity of Lcn2 induction and its protective effects.
damages. In other words, senescence might similarly act as tumor suppressor gene.
Little is known about the relationship of Lcn2 and senescence in normal cells and tissues. However, we know that after kidney injury, the expression of Lcn2 is induced immediately and dramatically. This dramatic up-regulation of Lcn2 is a compensatory reaction to re-establish the hemostasis. Interestingly, Mishra et al
showed that administration of recombinant Lcn2 ameliorate kidney injury following AKI in mice model (15). However, the precise role of Lcn2 with regard to senescence especially in vivo warrants further study.
Conclusion
In this study, we reported that when HEK-293 cells are exposed to the challenging condition of oxidative stress, Lcn2 or NGAL increases cellular senescence. In other words, our results suggest that Lcn2 regulates cell survival through senescence under harmful conditions. However further and complementary studies are required to clarify the precise role of Lcn2 in senescence.
Acknowledgment
We thanks Dr Mohammad Ali Jalili and Mahshid Mohammadipour for their technical helps (IBTO, Tehran, Iran)
References
1. Hayflick L, Moorhead PS. The serial cultivation of human diploid cell strains. Exp cell Res 1961; 25:585-621.
2. Rodier F, Campisi J. Four Faces of Cellular Senescence. J Cell Biol 2011; 192:547-556.
3. Ben-Porath I, Weinberg RA. The signals and pathways activating cellular senescence. Int J Biochem Cell Biol 2005; 37:961-976.
4. Erenpreisa J, Cragg MS. Three steps to the immortality of cancer cells: senescence, polyploidy and self-renewal. Cancer cell Int 2013; 13:13-92.
5. Kuilman T, Michaloglou C, Mooi WJ, Peeper DS. The essence of senescence. Genes Dev 2011; 24:2463-2479. 6. Santin AD, Zhan F, Bellone S, Palmieri M, Cane S, Bignotti E, et al. Gene expression profiles in primary ovarian serous papillary tumors and normal ovarian epithelium: identification of candidate molecular mmarkers for ovarian cancer diagnosis and therapy. Int J Cancer 2004; 112:14-25.
7. Missiaglia E, Blaveri E, Terris B, Wang YH, Costello E, Neoptolemos P, et al. Analysis of gene expression in cancer cell lines identifies candidate markers for pancreatic tumorigenesis and metastasis. Int J Cancer 2004; 112:100-112.
8. Liu Q, Nilsen-Hamilton M. Identification of a new acute phase protein. J Biol Chem 1995; 270:22565-22570.
9. Nielsen BS,Borregaard N,Bundgaard JR, Timshel S,
Sehested M, Kjeldsen L. Induction of NGAL synthesis in epithelial cells of human colorectal neoplasia and inflammatory bowel diseases. Gut 1996; 38:414-420. 10. Mishra J, Mori K, Ma Q, Kelly C, Barasch J, Devarajan P. Neutrophil gelatinase-associated lipocalin: a novel early urinary biomarker for cisplatin nephrotoxicity. Am J Nephrol 2004; 24:307-315.
11. Hemdahl AL, Gabrielsen A, Zhu C, Eriksson P, Hedin U, Kastrup J, et al. Expression of neutrophil gelatinase-associated lipocalin in atherosclerosis and myocardial infarction. Arterioscler Thromb Vasc Biol 2006; 26:136-142.
12. Tong Z, Wu X, Ovcharenko D, Zhu J, Chen CS, Kehrer JP. Neutrophil gelatinase-associated lipocalin as a survival factor. Biochem J 2005; 391:441-448.
13. Berger T, Togawa A, Duncan GS, Elia AJ, You-Ten A, Wakeham A, et al. Lipocalin 2-deficient mice exhibit increased sensitivity to Escherichia coli infection but not to ischemia-reperfusion injury. Proc Natl Acad Sci USA 2006; 103:1834-1839.
14. Rodvold JJ, Mahadevan NR, Zanetti M. Lipocalin2 in cancer: when good immunity goes bad. Cancers Lett 2012; 316:132-138.
15. Mishra J, Dent C, Tarabishi R, Mitsnefes MM, Ma Q, Kelly C, et al. Neutrophil gelatinase-associated lipocalin (NGAL) as a biomarker for acute renal injury after cardiac surgery. Lancet 2005; 365:1231-1238.
16. Viau A, El Karoui K, Laouari D, Burtin M, Nguyen C, Mori K, et al. Lipocalin 2 is essential for chronic kidney disease progression in mice and humans. J Clin Invest 2010; 120:4065-4076.
17. Zhao P, Stephens JM. STAT1, NF-jB and ERKs play a role in the induction of lipocalin-2 expression in adipocytes. Mol Metab 2013; 2:161-170.
18. Bahmani B, Roudkenar MH, Halabian R, Jahanian-Najafabadi A, Amiri F, Jalili MA. Lipocalin 2 decreases senescence of bone marrow-derived mesenchymal stem cells under sub-lethal doses of oxidative stress. Cell Stress Chaperones 2014; 19:685-693.
19. Roudkenar MH, Halabian R, Roushandeh AM, Nourani MR, Masroori N, Ebrahimi M, et al. Lipocalin 2 regulation by thermal stresses: Protective role of Lcn2/NGAL against cold and heat stresses. Exp Cell Res 2009; 315:3140-3151.
20. Lafferty-Whyte K, Bilsland A, Cairney CJ, Hanley L, Jamieson NB, Zaffaroni N, et al. Scoring of senescence signalling in multiple human tumour gene expression datasets, identification of a correlation between senescence score and drug toxicity in the NCI60 panel and a pro-inflammatory signature correlating with survival advantage in peritoneal mesothelioma. BMC Genomics 2010; 11:532.
21. Kasper G, Mao L, Geissler S, Draycheva A, Trippens J, Kühnisch J, et al. Insights into mesenchymal stem cell aging: involvement of antioxidant defense and actin cytoskeleton. Stem cells 2009; 27:1288-1297.
22. Kim JS, Kim EJ, Kim HJ, Yang JY, Hwang GS, Kim CW. Proteomic and metabolomic analysis of H2O2-induced