www.atmos-meas-tech.net/4/1979/2011/ doi:10.5194/amt-4-1979-2011
© Author(s) 2011. CC Attribution 3.0 License.
Measurement
Techniques
ARIS-Campaign: intercomparison of three ground based 22 GHz
radiometers for middle atmospheric water vapor at the Zugspitze in
winter 2009
C. Straub1, A. Murk1, N. K¨ampfer1, S. H. W. Golchert2, G. Hochschild2, K. Hallgren3, and P. Hartogh3
1Institute of Applied Physics, University of Berne, Switzerland
2Institute for Meteorology and Climate Research, Karlsruhe Institute of Technology, Germany 3Max-Planck-Institut f¨ur Sonnensystemforschung, Katlenburg-Lindau, Germany
Received: 16 May 2011 – Published in Atmos. Meas. Tech. Discuss.: 1 June 2011
Revised: 2 September 2011 – Accepted: 15 September 2011 – Published: 22 September 2011
Abstract. This paper presents the Alpine Radiometer In-tercomparison at the Schneefernerhaus (ARIS), which took place in winter 2009 at the high altitude station at the Zugspitze, Germany (47.42◦N, 10.98◦E, 2650 m). This campaign was the first direct intercomparison between three new ground based 22 GHz water vapor radiometers for mid-dle atmospheric profiling with the following instruments participating: MIRA 5 (Karlsruhe Institute of Technology), cWASPAM3 (Max Planck Institute for Solar System Re-search, Katlenburg-Lindau) and MIAWARA-C (Institute of Applied Physics, University of Bern). Even though the three radiometers all measure middle atmospheric water vapor us-ing the same rotational transition line and similar fundamen-tal set-ups, there are major differences between the front ends, the back ends, the calibration concepts and the profile retrieval. The spectrum comparison shows that all three ra-diometers measure spectra without severe baseline artifacts and that the measurements are in good general agreement. The measurement noise shows good agreement to the values theoretically expected from the radiometer noise formula. At the same time the comparison of the noise levels shows that there is room for instrumental and calibration improvement, emphasizing the importance of low elevation angles for the observation, a low receiver noise temperature and an efficient calibration scheme.
The comparisons of the retrieved profiles show that the agreement between the profiles of MIAWARA-C and cWAS-PAM3 with the ones of MLS is better than 0.3 ppmv (6 %) at all altitudes. MIRA 5 has a dry bias of approxi-mately 0.5 ppm (8 %) below 0.1 hPa with respect to all other
Correspondence to:C. Straub ([email protected])
instruments. The profiles of cWASPAM3 and MIAWARA-C could not be directly compared because the vertical region of overlap was too small. The comparison of the time se-ries at different altitude levels show a similar evolution of the H2O volume mixing ratio (VMR) for the ground based
in-struments as well as the space borne sensor MLS.
1 Introduction
Water vapor plays a key role in the Earth’s radiative budget as it is the most important natural greenhouse gas in the tro-posphere. In the stratosphere water vapor is important as it has, through cooling by infrared emission, an effect on strato-spheric temperature which itself influences surface climate as shown in Solomon et al. (2010) and references there in. Wa-ter vapor has chemical effects on ozone in the stratosphere (Dvortsov and Solomon, 2001) as well as in the mesosphere (Marsh et al., 2003).
due to the absorption of solar Lymanαis the relevant sink of water vapor in the middle atmosphere, leading to a negative vertical VMR gradient throughout the mesosphere. Effects of the Lymanαirradiance varying with the solar cycle can be observed in the upper mesosphere (Nedoluha et al., 2009; Hartogh et al., 2010; Remsberg, 2010). Besides the tropi-cal stratosphere strong seasonal variations are also found in the polar to mid latitudinal mesosphere with high water va-por vmr in summer and low vmr in winter (Seele and Har-togh, 1999). An accepted theory is that upwelling in summer transports humid air from altitudes around the stratopause towards the mesopause while downwelling in winter has the opposite effect, e.g. dry mesopause air is transported towards the stratopause (K¨orner and Sonnemann, 2001). In polar re-gion middle atmospheric water vapor profile measurements have been used to determine timescales of mesospheric and stratospheric vertical transport (Forkman et al., 2005; Lee et al., 2011) and to investigate meridional transport during sudden stratospheric warmings (Seele and Hartogh, 2000; Flury et al., 2008).
Water vapor in the upper stratosphere and mesosphere is mainly observed by passive remote sensing instruments, ei-ther space borne or ground based. Satellite instruments, such as MLS on EOS/Aura (Waters et al., 2006), MIPAS on EN-VISAT (Milz et al., 2005), SMR on ODIN (Murtagh et al., 2002) and FTS on ACE (Bernath et al., 2005) provide the vertical as well as the horizontal distribution of water va-por and other trace gases and are therefore imva-portant for the monitoring of the evolution of the composition of the Earth’s atmosphere on a global scale which is crucial for climate re-search. However, the lifetime of a satellite is typically limited to less than a decade and therefore the creation of meaningful long term observational time series from these data requires careful checking of the consistency between different instru-ments.
Ground based radiometers observing middle atmospheric H2O provide vertical profiles at a single location and are
characterized by long operational lifetimes and a temporal resolution in the order of hours to days. A network of ground based instruments allows detecting biases between satellite experiments, helps to find geographical dependency in these biases and plays a key role in the merging of satellite data sets. In addition the long term data sets are used to study trends, seasonal and longer term variations in stratospheric and mesospheric water vapor. Alongside this network of ground based instruments having a high temporal resolution is used for dynamical studies such as the investigation of hor-izontal and vertical transport. However this requires that the network itself is consistent and that the temporal resolution of the instruments is optimized. Examples for middle atmo-spheric research using ground based radiometers are given above.
There are few ground based spectro-radiometers at 22 GHz operating on a regular basis. In the frame of NDACC (Network for the Detection for Atmospheric Composition
Change) there are instruments in Onsala, Sweden (Fork-man et al., 2003), Bern, Switzerland (Deuber et al., 2004), Table Mountain, USA, Mauna Loa, USA and Lauder, New Zealand (Thacker et al., 1995; Nedoluha et al., 1995, 2007). In addition there are two instruments, one in Alo-mar/Andoya, Norway (Hallgren et al., 2010; Seele and Har-togh, 2000, 1999; Sonnemann et al., 2008) and one in Seoul, South Korea (de Wachter et al., 2010), in continuous op-eration and two instruments, one at Ny- ˚Alesund, Spitsber-gen (Quack, 2004) and one in M´erida, Venezuela (Golchert, 2010), whose measurements have suffered from interruptions in the past, but are intended for continuation. There have also been several new developments in recent years, e.g. the three instruments introduced in this article, a sister instrument to cWASPAM3 called MISI operated by IAP K¨uhlungsborn and the Mobile Microwave Radiometer operated by the Univer-sity of Toulouse (France) (Motte et al., 2008).
Until now there has been one direct intercomparison be-tween two similar 22 GHz radiometers when the instrument now in Mauna Loa was operated alongside the instrument at Table Mountain on a campaign basis (Nedoluha et al., 1999). The instruments in Lauder and Mauna Loa have been indi-rectly compared as they both participated in a comparison with MLS and HALOE (Nedoluha et al., 2007). In addi-tion the NDACC instruments in Bern, Lauder, Mauna Loa and Onsala and the instrument in Seoul have been validated against one another using MLS as a reference instrument (Haefele et al., 2009).
The Alpine Radiometer Intercomparison at the Schneefernerhaus (ARIS) during the beginning of 2009 was the first direct intercomparison of three new ground based microwave radiometers for middle atmospheric water vapor using different setups. It offered the unique opportunity to not only compare the profiles retrieved from the measurements of the radiometers but also the calibrated spectra and the noise levels of the measurements. The three radiometers participating in ARIS with their different calibration methods are introduced in the second and third section of this article. The fourth section focuses on the microwave spectra and a comparison of the noise levels of the measurements. The profile retrieval together with the characterization of uncertainties and a method to limit the altitude range of the retrieved profiles are described in the fifth section, with the actual intercomparison of profiles being presented in the sixth section. The seventh section gives an idea of the instrumental improvements achieved thanks to ARIS and an overview of the current status of the instruments.
2 Description of the instruments
H2O rotational transition line at 22.235 GHz utilizing
differ-ent set-ups. This section gives a short description of each of the radiometers and a compilation of the key specifications of the instruments is given in Table 1.
MIRA 5 has been designed with a focus on versatility. It allows the intercomparison of various modes of operation and forms a reference for smaller designs planned for the fu-ture. Three calibration loads, microwave absorbers at 32 K, 75 K and 310 K, allow a wide range of calibration schemes (total power, reference beam and balancing). The quasi-optical system comprises a corrugated horn antenna and four ellipsoidal mirrors. One of these is a revolvable mirror to switch the beam between the sky and the three calibration loads. One mirror is placed in the refrigerated 32 K cold load and uses a particular coating to filter the incoming infrared radiation and protect the microwave absorber from excessive heating. The observation angle into the sky is chosen with a revolvable plane mirror. During the ARIS campaign, an Acousto-Optical Spectrometer (manufactured by the Univer-sit¨at zu K¨oln) and a digital fast Fourier transform spectrom-eter (Acqiris AC240) have been used in parallel for signal analysis.
The concept of cWASPAM3 is based on the success-ful WASPAM instrument which was installed at ALOMAR 1995 (Hartogh and Jarchow, 1995). WASPAM provided wa-ter vapor measurements over an almost complete solar cy-cle (Hartogh et al., 2010). The design of cWASPAM3 com-bines high sensitivity with autonomy. The high sensitivity (low measurement noise) is achieved by the combination of a cooled front-end with a total power receiver measuring the vertical and horizontal polarization simultaneously. This so-called dual polarization receiver consists of two individual amplification chains, one for each polarization, connected by an ortho mode transducer (OMT). For the data acquisi-tion two chirp transform spectrometer (CTS) are used one for each receiver chain (Hartogh and Hartmann, 1990; Har-togh, 1998; Villanueva and HarHar-togh, 2004; Villanueva et al., 2006; Paganini and Hartogh, 2009). With this set-up the noise level is improved by a factor of √2 compared to a conventional total power receiver. The complete front-end, i.e. the first stage amplifiers, the OMT and the horn antenna, are cooled to a temperature of 20 K by a closed-loop helium compressor system. Additionally, both the hot and cold load are mounted within the dewar and cooled to approximately 120 K and 45 K respectively.
MIAWARA-C is a compact instrument specifically de-signed for the use in measurement campaigns which can act as a traveling standard for intercomparisons. A detailed de-scription of the instrument can be found in (Straub et al., 2010). The optical system of MIAWARA-C combines a choked gaussian horn antenna with a parabolic mirror which reduces the size of the instrument in comparison with other radiometers (Straub et al., 2007). For the data acquisition during ARIS a correlation receiver with a COLFET as in-ternal calibration load (Straub et al., 2008) was used. The
COLFET is a noise diode with a noise temperature of ap-proximately 140 K. For data acquisition a digital cross cor-relating spectrometer is used . The complete back end sec-tion, including the computer, is located in the same housing as the instrument. The front-end is temperature stabilized to minimize gain fluctuations. Calibration of the instrument is achieved through a balancing scheme with the sky used as the cold load and the tropospheric properties are determined by performing regular tipping curves, meaning MIAWARA-C needs neither liquid nitrogen nor helium for calibration nor information from other instruments. The instrument is op-erated outside a building during the ARIS campaign on the terrace of the Schneefernerhaus in contrast to the other two radiometers, which have been operated inside the laboratory.
All three instruments are controlled remotely.
3 Calibration methods
During the ARIS campaign both MIRA 5 and cWASPAM3 used a hot-cold load interleaved calibration scheme as de-scribed in Hallgren (2010). For this calibration method ev-ery second measurement is taken from a calibration load, hot or cold alternately, the others from the atmosphere. The sky brightness temperatureTb,skyis then calculated using the
fol-lowing relation:
Tb,sky=
Vsky−Vcold
Vhot−Vcold(Thot−Tcold)+Tcold (1) whereVxare the measurements of the respective targets and
Thot/Tcoldthe Rayleigh-Jeans equivalent brightness
tempera-tures of the calibration loads.
The hot load of MIRA 5 is stabilized above ambient tem-perature (310 K). The backside of the cold load is cooled to approximately 15 K physical temperature by a closed-loop helium compressor system. The signal from this cold load has itself been calibrated against the signal from a black body immersed in liquid nitrogen and the hot reference. Careful at-tention is paid to keep the signal from the liquid nitrogen load free of systematic errors. In particular, the dewar is tilted to avoid the antenna beam intersecting the air/liquid interface at right angles. The calibration time span has been limited to avoid the formation of water ice in the open nitrogen Dewar. A path-length modulator further reduces the contribution of standing waves in the optical path. Cold load calibrations of the refrigerated load are repeated every four weeks and result in a brightness temperature of 32 K with little variation. The remaining undulations in the calibrations of the cold load are very stable over time.
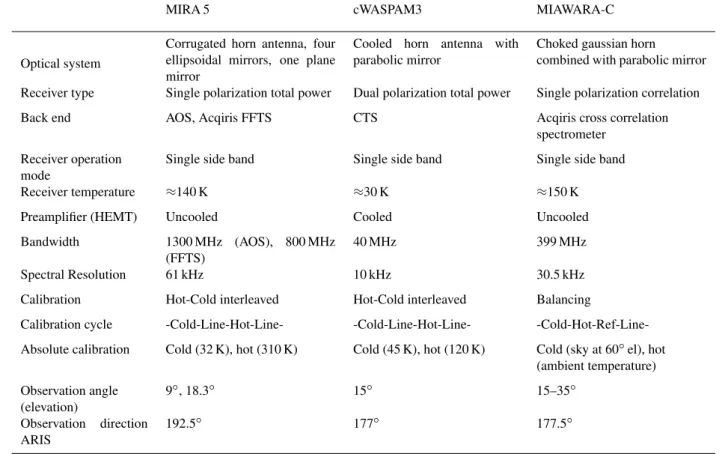
Table 1.Specifications of the three radiometers participating in ARIS.
MIRA 5 cWASPAM3 MIAWARA-C
Optical system
Corrugated horn antenna, four ellipsoidal mirrors, one plane mirror
Cooled horn antenna with parabolic mirror
Choked gaussian horn
combined with parabolic mirror
Receiver type Single polarization total power Dual polarization total power Single polarization correlation
Back end AOS, Acqiris FFTS CTS Acqiris cross correlation
spectrometer
Receiver operation mode
Single side band Single side band Single side band
Receiver temperature ≈140 K ≈30 K ≈150 K
Preamplifier (HEMT) Uncooled Cooled Uncooled
Bandwidth 1300 MHz (AOS), 800 MHz
(FFTS)
40 MHz 399 MHz
Spectral Resolution 61 kHz 10 kHz 30.5 kHz
Calibration Hot-Cold interleaved Hot-Cold interleaved Balancing
Calibration cycle -Cold-Line-Hot-Line- -Cold-Line-Hot-Line-
-Cold-Hot-Ref-Line-Absolute calibration Cold (32 K), hot (310 K) Cold (45 K), hot (120 K) Cold (sky at 60◦el), hot (ambient temperature)
Observation angle (elevation)
9◦, 18.3◦ 15◦ 15–35◦
Observation direction ARIS
192.5◦ 177◦ 177.5◦
order to calculate the offset temperature between the mea-sured physical temperature at the back of the load and the observed radiometric temperature.
The balancing calibration scheme of MIAWARA-C is de-scribed in detail in Straub et al. (2010). A reference signal having the same intensity as the line measurement, but which has little contribution from the water vapor line at 22 GHz, namely the sky in zenith direction with a piece of microwave absorber inserted into the beam, is measured. The elevation angle for the line measurement is then continuously adjusted to balance the reference measurement. The difference be-tween the line and reference measurement is used to calcu-late the balanced sky brightness temperature:
1Tb,sky=Tb,sky−Tb,ref=
Vsky−Vref
Vhot−Vcold(Thot−Tcold) (2) For the absolute calibration there are two targets; a mi-crowave absorber at ambient temperature that is used as the hot load, and the sky under an elevation angle of 65◦which represents the cold load. The brightness temperature of the cold calibration target is determined with regular tipping curve calibration as described in (Straub et al., 2010).
4 Intercomparison of the spectra
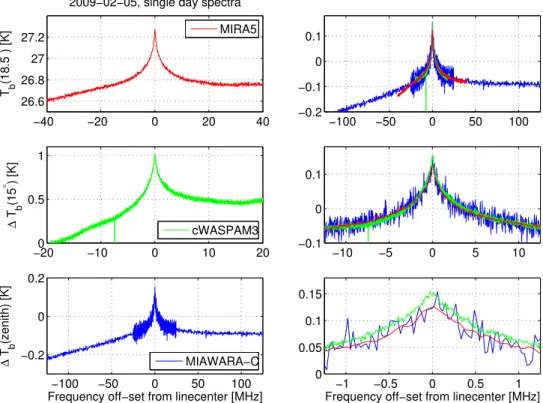
In order to retrieve a water vapor profile from the spectrum of a ground based 22 GHz radiometer, hours or even days of measurements need to be integrated to achieve a suffi-cient signal to noise ratio (SNR). The required measurement time depends on the instrument, tropospheric conditions and the desired altitude range of the retrieved profile. For the comparison of retrieved profiles, presented in Sect. 6, spec-tra acquired within 24 h are averaged before being processed with the inversion routine. This means the measurement noise, which strongly influences the quality and the altitude range of the retrieved profile, depends on the instrument and day. As the stratospheric signal is approximately constant the measurement noise is proportional to the inverse of the signal to noise ratio.
−40 −20 0 20 40 26.6
26.8 27 27.2
2009−02−05, single day spectra
T b
(18.5
° ) [K]
MIRA5
−200 −10 0 10 20
0.5 1
∆
T b
(15
° ) [K]
cWASPAM3
−100 −50 0 50 100
−0.2 0 0.2
∆
T b
(zenith) [K]
Frequency off−set from linecenter [MHz] MIAWARA−C
−100 −50 0 50 100
−0.2 −0.1 0 0.1
−10 −5 0 5 10
−0.1 0 0.1
−1 −0.5 0 0.5 1
0 0.05 0.1 0.15
Frequency off−set from linecenter [MHz]
Fig. 1.Left: spectra of the three radiometers as they are used for profile retrieval. The different line strength is due to the different calibration methods. The difference in the noise level of the spectrum of MIAWARA-C originates from a 10 channel binning applied to the line wings. Right: the same data set as on the left, but transformed to zenith direction and corrected for tropospheric attenuation. In addition a polynomial of second degree has been removed from the spectra of MIRA 5 and cWASPAM3 to account for the different instrumental baselines and calibration techniques. The spectra are shown for three different frequency ranges, line center±125 MHz, line center±12.5 MHz and line center±1.25 MHz.
strength originates from the fact that the balanced spectrum of MIAWARA-C is scaled to zenith direction, as described in Straub et al. (2010):
1Tb∗,z=ctrop,bal·1Tb,line = Tb,line−Tb,ref
Amalinee−Atroplineτz
−t rAmarefe−Atroprefτz
(3)
while the other two instruments are in observation direction, which is 18.3◦ elevation for MIRA 5 and 15◦elevation for
cWASPAM3. The factorctrop,bal also accounts for the
ref-erence measurement of MIAWARA-C being taken towards the sky in zenith direction and that therefore the line signal is present in both the line and the reference measurement.
For the comparison presented in the right panel of Fig. 1 the spectra of cWASPAM3 and MIRA 5 are transformed to the zenith direction and are corrected for tropospheric atten-uation in order to achieve the same signal strength for all the instruments using the following relation:
Tb∗,z=ctrop,h−c−il·Tb,line=
Tb,line
Amalinee−Atroplineτz
(4)
where
ctrop,bal Factor for tropospheric correction when
using balancing calibration with a refer-ence measurement towards the sky. ctrop,h−c−il Factor for tropospheric correction when
using hot-cold load interleaved calibra-tion.
Tb,line Sky brightness temperature at elevation
angle of line observation.
τz Tropospheric opacity in zenith direction. Atropline Tropospheric air mass at elevation angle
of line observation.
Amaline Middle atmospheric air mass at elevation angle of line observation.
Atropref Tropospheric air mass at elevation angle of reference measurement.
Amaref Middle atmospheric air mass at elevation angle of reference measurement.
tr Equivalent transmission of reference ab-sorber.
of observation. The factorctrop,balfor balancing calibration
is always larger thanctrop,h−c−ilfor hot-cold interleaved
cal-ibration.
The instrumental baseline of each instrument and the dif-ferent handling of the spectral contribution of the troposphere is taken into account by fitting a second order polynomial to the difference spectra between MIAWARA-C and MIRA 5 and between MIAWARA-C and cWASPAM3 and removing this from the corrected spectra of MIRA 5 and cWASPAM3. This method leads to comparable spectra for the three in-struments shown in the right panel of Fig. 1 for three dif-ferent frequency ranges, line center±125 MHz, line center
±12.5 MHz and line center±1.25 MHz. These plots show that the spectra of all three instruments are in good general agreement.
4.1 Measurement noise
The uncertainty of the measurement using microwave ra-diometry is given by the so-called radiometer noise formula:
σ=√a
BtTsys (5)
whereB is the width of a single radiometer channel,t the effective integration time of the line measurement,Tsysthe
system temperature of the radiometers andaa sensitivity fac-tor depending on receiver type and calibration technique as described in Tiuri (1964).
The value ofTsysdepends on the receiver type. For MIRA 5
and cWASPAM3 it is given by:
Tsys=(Trec+Tantenna) (6)
and for the correlation receiver of MIAWARA-C by:
Tsys−c=
r
(1
2TA+Trec)
2+(1
2TA)
2 (7)
withTA=Tantenna+Tcolfet. Tantennais the antenna
tempera-ture,Trecthe receiver noise temperature andTcolfetthe noise
temperature of the internal calibration load used in the corre-lation receiver of MIAWARA-C.
Knowing that for a total power calibrated spectrum the sensitivity factorais 1 (σTP=Tsys/
√
Bt), the sensitivity for the hot - cold interleaved and balancing calibrations can be calculated as:
ah−c−il/bal=
σh−c−il/bal
σTP (8)
The actualσ of each radiometer is determined using Gaus-sian error propagation
σF=
s ∂F
∂x1·σ1
2
+
∂F
∂x2·σ2
2
+ ···
20 40 60 80 100 120
1 1.5 2 2.5 3 3.5 Tsky a cWASPAM3 MIRA5, MIAWARA−C
Fig. 2.Sensitivity factoracalculated by Gaussian error propagation on the calibration equations (lines) and from measurements com-pared to the uncertainty of a total power measurementσTP, with an estimated value forTsys,sky.
on Eq. (1) for MIRA 5 and cWASPAM3 and on Eq. (2) for MIAWARA-C. Derivatives are built with respect toVxwhere
x=sky,line,hot,cold and proportionality between signals Vx and temperaturesTx is assumed. The uncertainty,σx, in
these variables is given by Eq. (5) witha=1. This results in:
σh−c−il
=√1
B
v u u t
Tsys,cold2 tcold
Tsky−Thot
Thot−Tcold
2
+T
2 sys,sky
tsky +
Tsys,hot2 thot
Tsky−Tcold
Thot−Tcold
2 (9) for MIRA 5 and cWASPAM3 and
σbal=
1 √ B v u u t
Tsys2
−c,sky
tsky + Tsys2
−c,ref
tref (10)
for MIAWARA-C.
Figure 2 shows a comparison between the expected values ofaand those as derived from measurements plotted against the sky brightness temperature in observation directionTsky.
The expected values, shown as lines, are calculated using Eq. (8) where it is necessary to take into account that the measurement noise of cWASPAM3 is improved by a factor of√2 by the dual polarization receiver while the measure-ment noise of MIAWARA-C is degraded by a factor of√2 by the correlation receiver.
The experimental values for a, shown as circles, are obtained by dividing the measurement noise of the one day integrated spectra, acquired between 2 April 2009 and 22 April 2009, byσTP(Eq. 5 witha=1), with an estimated value forTsys,sky. The factorsaobtained from measurements
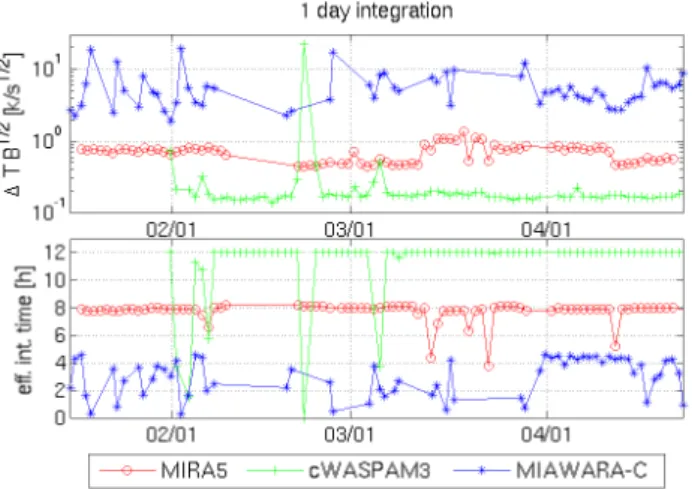
Fig. 3.Noise levels and effective integration times of the 24 h spec-tra of the three radiometers.
by 4 K for cWASPAM3 and by 15 K for MIRA5 explains the offset (not shown). These values seem realistic for an uncer-tainty in the receiver temperature as it is a parameter which is very difficult to determine exactly, e.g. for MIRA 5 the receiver temperature varies between 135 and 151 K for the three different spectrometers (including the RPG-FFT added after the ARIS campaign).
To achieve comparable noise levels for the three radiome-ters the noise is corrected to the zenith direction and for tro-pospheric attenuation in the same way as the measured sig-nal:
σ∗=ctrop·σ (11)
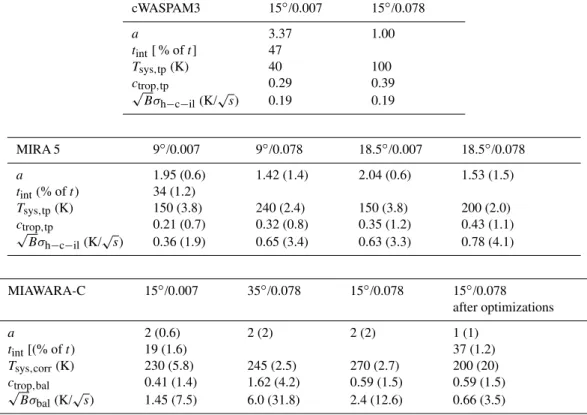
Table 2 gives an overview of the parameters determining the noise levels of the three radiometers. The numbers in the header row of each table indicate the elevation angle and tro-pospheric opacity τ used for the calculations. The values forτ used are the extremes during the Zugspitze campaign, namely 0.007 and 0.078. For cWASPAM3 the observation angle is constant while for MIRA 5 it is either 9 or 18.3◦,
cho-sen by the operator. Thus for MIRA 5 all the values are given for both angles. In the balancing scheme of MIAWARA-C the elevation angle is constantly adjusted depending on the tropospheric opacity. Therefore for MIAWARA-C the values are given for parameter combinations that represent best and worst conditions during the ARIS campaign, i.e. el=15◦/τ=0.007 and el=35◦/τ=0.078. Since a high
el-evation angle like 35◦ is non-ideal, the values for the
com-bination el=15◦/τ=0.078 are given as well to indicate the
possible gain in noise level by using low elevation angles. In the tables for MIRA 5 and MIAWARA-C the numbers in brackets indicate the factor compared to the values of cWASPAM3 for the same opacity. In the process of pro-file retrieval the channel width is accounted for when regard-ing the measurement uncertainty so the instrument compar-ison in the last line of the table considers the normalized
measurement noise for a certain channel width√Bσ. The comparison yields a 7.5 to 31.8 times higher noise level for MIAWARA-C compared to cWASPAM3 indicating room for improvement in the measurements of MIAWARA-C. The technical changes accomplished after the ARIS campaign are described in Sect. 7. The differences in the noise levels of MIRA 5 and cWASPAM3 are mainly due to the lower ceiver noise temperature of the latter due to the cooled re-ceiver.
The comparison of the system temperatures of the two in-struments emphasizes the advantages of a low receiver tem-perature especially under very dry observation conditions. 4.2 Measurement time series
The previous section presented system noise value for 1-day integrated spectra without measurement gaps, representing the ideal case. The lower panel of Fig. 3 shows the effective integration time of each instrument for each day, illustrating that during the ARIS campaign there are some gaps in the time series of all the instruments for various reasons.
The MIRA 5 AOS was not operational for a nine-day pe-riod from 10–18 February which blocked all measurements during that time as the profiles used here are calculated from spectra of the AOS.
In the case of cWASPAM3 the first 10 days of data from the campaign were affected by a calibration error and ren-dered unusable.
In the data set of MIAWARA-C there are large gaps due to poor weather conditions, namely snow affecting the out-door instrument. To protect the radiometer, the rain hood was closed whenever there was snowfall or snow covering the housing of the instrument. Therefore there are only few spectra from MIAWARA-C throughout February and March. The upper panel of the Fig. 3 shows the noise level of the 1-day integrated spectra for each day. This plot illustrates that the noise level of cWASPAM3 is the lowest of the three instruments, with the noise level of MIAWARA-C the largest and most variable, as expected from the numbers in Table 2.
5 Retrieval
To retrieve water vapor vertical profiles the optimal estima-tion method (OEM) is used for all instruments. The MIRA 5 and MIAWARA-C groups use the Qpack software package described in Eriksson et al. (2005) for the retrieval together with ARTS, a modular program simulating atmospheric ra-diative transfer described in Buehler et al. (2005), as the ward model. The cWASPAM3 group uses their own for-ward model and OEM code described in Jarchow and Har-togh (1995).
Table 2.Approximate values of the parameters in Eqs. (5) and (11) for the three instruments. The numbers in the header row of each table indicate the elevation angle and tropospheric opacity used for the calculations. In the tables for MIRA 5 and MIAWARA-C the number in brackets indicates the factor of the given quantity compared to cWASPAM3. tintis the effective integration time on line given in % of measurement timet. The last column of MIAWARA-C indicates the improvements by the end of 2010 after the optimizations described in Sect. 7.3.
cWASPAM3 15◦/0.007 15◦/0.078
a 3.37 1.00
tint[ % oft] 47
Tsys,tp(K) 40 100
ctrop,tp 0.29 0.39 √
Bσh−c−il(K/√s) 0.19 0.19
MIRA 5 9◦/0.007 9◦/0.078 18.5◦/0.007 18.5◦/0.078
a 1.95 (0.6) 1.42 (1.4) 2.04 (0.6) 1.53 (1.5)
tint(% oft) 34 (1.2)
Tsys,tp(K) 150 (3.8) 240 (2.4) 150 (3.8) 200 (2.0)
ctrop,tp 0.21 (0.7) 0.32 (0.8) 0.35 (1.2) 0.43 (1.1)
√
Bσh−c−il(K/√s) 0.36 (1.9) 0.65 (3.4) 0.63 (3.3) 0.78 (4.1)
MIAWARA-C 15◦/0.007 35◦/0.078 15◦/0.078 15◦/0.078
after optimizations
a 2 (0.6) 2 (2) 2 (2) 1 (1)
tint[(% oft) 19 (1.6) 37 (1.2)
Tsys,corr(K) 230 (5.8) 245 (2.5) 270 (2.7) 200 (20)
ctrop,bal 0.41 (1.4) 1.62 (4.2) 0.59 (1.5) 0.59 (1.5)
√
Bσbal(K/√s) 1.45 (7.5) 6.0 (31.8) 2.4 (12.6) 0.66 (3.5)
Table 3. Pressure limits for 5 February determined from the area of the averaging kernel and the difference between peak height and nominal height of the AVK. The bold numbers indicate the pressure range in which both requirements are fulfilled.
lower limit (hPa) upper limit (hPa) AoA/peak height AoA/peak height
MIRA 5 10/10 0.01/0.01
cWASPAM3 0.5/0.7 0.01/0.006
MIAWARA-C 3/6 0.03 /0.1
case as the atmosphere is optically thin at 22 GHz, is given by:
ˆ
x=xa+(KTxSy−1Kx+S−a1)−1KTxS−y1(y−Kxxa)) (12)
=xa+Dy(y−Kxxa) (13)
=xa+A(x−xa) (14)
where
y measured spectrum x true atmospheric profile xa apriori profile
ˆ
x retrieved profile
Sy error covariance matrix of y (measurement noise)
Sa error covariance matrix ofxa
Kx kernel or weighting function matrix, describes
sensitivity ofyvariations inx
Dy retrieval gain matrix, represents sensitivity of
ˆ xtoy
A averaging kernel matrix,DyKx, characterizes
the response ofxˆ to a perturbation inx
Hence the best estimatexˆ is represented by the apriori state, xa, plus a contribution from the difference between the
0 2 4 6 8 10
10−2
10−1
100
101
vmr [ppmv]
pressure [hPa]
apriori covariance 1 covariance 2
Fig. 4.Apriori profile and apriori covariance used for the Retrievals. Covariance 1 is used for MIRA 5 and MIAWARA-C and Covari-ance 2 is used for cWASPAM3.
the averaging kernel matrix can be regarded as smoothing functions: the averaging kernels (AVK). They are generally peaked functions, the peaks indicating which atmospheric altitudes contribute most to a given layer result. Their full width at half maximum (FWHM) is a measure of the vertical resolution of the observing system. This provides a simple relationship between the retrieved and the true atmospheric profile. The averaging kernel also has an area (AoA) which is close to unity at altitudes where the retrieval is sensitive. The AoA is the same as the measurement response.
5.1 Apriori and forward model parameters
During the ARIS campaign the same apriori profile was used for the retrievals of the three instruments, namely a scaled version of the US-Standard atmosphere. In addition the apri-ori covariance used is identical for MIRA 5 and MIAWARA-C and very similar for cWASPAM3, as shown in Fig. 4. The apriori covariance of cWASPAM3 only significantly deviates from the others at altitudes below 0.5 hPa, where the retrieval is not considered sensitive to the true profile, as will be dis-cussed in the next section.
The pressure-Temperature-altitude (pTz) information is taken from collocated EOS/MLS profiles (version 2.2). The criterion for MLS collocations with the measurement site is±2◦(220 km) in latitude and±5◦(390 km) in longitude,
which leads to one or more profiles almost daily. The profile closest in time is used as pTz information for the retrievals.
The spectroscopic parameters, namely the line and the broadening parameters, are taken from the JPL 1985 cata-log (Poynter and Pickett, 1985) and from Liebe (1989) and a Voigt line shape is used as spectral function.
Additionally the hyperfine splitting of the 22 GHz line as described in Moran et al. (1973) is taken into account. These
values are chosen because they are used in the retrieval of the WVMS instruments since 1992, see Nedoluha et al. (2007), where they reveal good validation results. The same values have also been used for the validation of microwave radiome-ters presented in Haefele et al. (2009).
5.2 Altitude range of the retrieval
The two conditions of the AVK peaking at the appropriate level and the AoA being close to unity can be used to define the altitude range of the retrieval.
In Fig. 5 a set of typical averaging kernels of the three radiometers for a specific day are shown. The averaging ker-nels indicate that the three radiometers have different altitude coverage. For MIAWARA-C the AoA is close to unity at al-titudes between 3 and 0.03 hPa, for MIRA 5 between 10 and 0.01 hPa and for cWASPAM3 the same is true for altitudes between 0.5 and 0.01 hPa.
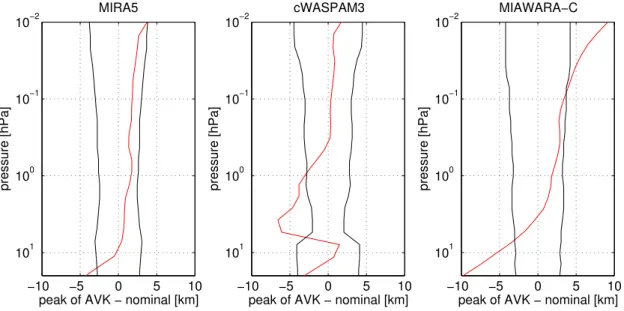
Comparison of the peak heights of the AVK to the pressure altitude they are calculated for, henceforth called the nomi-nal height, indicates that the AVK at the upper and the lower limit of the pressure range displayed do not peak at the nom-inal level, implying perturbations in the true profile are at-tributed to an incorrect altitude. To check for correct attribu-tion between the altitudes of the retrieved profile compared to the true profile a numerical criterion is established. This work defines that the difference between the nominal height of the AVK and its peak height must not exceed 25 % of the AVK’s width. This altitude difference is displayed in Fig. 6 together with its upper limit and the FWHM of the AVK giv-ing a measure for the spatial resolution of the radiometers is displayed in Fig. 7. cWASPAM3 meets the above defined criterion at altitudes between 0.7 and 0.006 hPa, for MIRA 5 it is fulfilled at altitudes between 10 and 0.01 hPa and for MIAWARA-C the range is 6 to 0.1 hPa.
To obtain the altitude range of the retrieval we demand that both above mentioned conditions, AoA close to unity and small difference between peak height and nominal height, must be fulfilled. A compilation of the determined altitude limits for 5 February is given in Table 3.
−0.1 0 0.1 0.2 0.3 0.4 0.5 10−2
10−1
100
101 ←1 ←2 ←3 ←4
←5 ←6 ←7 ←8 ←9
pressure [hPa]
AVK
0 0.2 0.4 0.6 0.8 1 1.2
10
10
10
10 AoA
MIRA5
−0.1 0 0.1 0.2 0.3 0.4 0.5 10−2
10−1
100
101
←3 ←4
←5 ←6 ←7 ←8 ←9
pressure [hPa]
AVK
0 0.2 0.4 0.6 0.8 1 1.2
10
10
10
10 AoA
cWASPAM3
−0.1 0 0.1 0.2 0.3 0.4 0.5 10−2
10−1
100
101
←1←2 ←3 ←4 ←5 ←6 ←7 ←8 ←9
pressure [hPa]
AVK
0 0.2 0.4 0.6 0.8 1 1.2
10
10
10
10 AoA
MIAWARA−C
Fig. 5. Averaging Kernels (blue and red, bottom scale) and their area (black, top scale) of the single day retrievals on the 2009-02-05. The numbers indicate the AVK belonging to the pressure level closest to 1 = 30 hPa, 2 = 10 hPa, 3 = 3 hPa, 4 = 1 hPa, 5 = 0.3 hPa, 6 = 0.1 hPa, 7 = 0.03 hPa, 8 = 0.01 hPa and 9 = 0.003 hPa
−10 −5 0 5 10
10−2
10−1
100
101
pressure [hPa]
peak of AVK − nominal [km] MIRA5
−10 −5 0 5 10
10−2
10−1
100
101
pressure [hPa]
peak of AVK − nominal [km] cWASPAM3
−10 −5 0 5 10
10−2
10−1
100
101
pressure [hPa]
peak of AVK − nominal [km] MIAWARA−C
Fig. 6.Difference between nominal height and peak height of the averaging kernel (red) and 25 % of the width of the AVK defined as upper limit for the difference (black).
5.3 Error characterization
The error analysis of profiles from remote sounding measure-ments is not completely straight forward as there are differ-ent aspects which need to be considered when characterizing a profile determined using optimal estimation. Two quanti-ties of relevance for the error analysis have been discussed in Sect. 5.2, namely the contribution of apriori information to the retrieved profile and possible deviations of the peak height of the AVK from its nominal height. These two quan-tities are used to limit the valid altitude range of the retrieved
profile and its error. In the error analysis itself they are there-fore neglected.
Another aspect that can be regarded as an error is the smoothing effect of the retrieval, as characterized by the AVK. The difficulty here is that to estimate the smoothing error correctly, the error statistics of the true state of the at-mosphere must be known. HereSa is simply a very rough
Table 4.Estimates of the errors in relevant forward model parameters. For MIAWARA-C the uncertainty inThotand in pointing, influencing
τzandTcoldare considered in the calibration error which is given in % of factor for the tropospheric correction.
Parameter Instrument Estimated uncertainty
Temperature profile 5 K
Calibration cWASPAM3 1 K on either calibration load, 0.5◦in pointing MIRA 5 1 K on either calibration load, 0.5◦in pointing MIAWARA-C 3 % of factor for the tropospheric correction
(3 K onThot, 0.2◦in pointing→2.5 % onτzand 0.5 K onTcold)
Line intensity S 6.81×10⁻²¹m2Hz
Air broadeningγair 1014 Hz/Pa
atmospheric profile rather than an estimate of the complete state and hence the estimation of a smoothing error is aban-doned. This approach is based on a suggestion in Rodgers (2000).
With the above mentioned constraints the retrieval error may be separated into two components, (1) the random error due to measurement noise and (2) systematic errors due to uncertain model parameters and can be written as (Rodgers, 2000):
Sxˆ=DySyDTy+DyKbSbDTyK
T
b (15)
whereSbis the covariance of various forward model
param-eters andKb is the sensitivity of the forward model to the
corresponding parameter. Estimates of the standard devia-tions for the relevant forward model parameters (temperature profile, calibration and spectroscopic parameters) used as di-agonal elements for the variance/covariance matricesSbare
given in Table 4. The corresponding kernel matricesKbare
determined using perturbation calculations.
Examples of the 1-σ errors resulting from these calcula-tions for each radiometer are shown in Fig. 8. The errors depend on measurement conditions and have been calculated for 5 February. The solid part of each line representing an er-ror marks the altitude range of the retrieval. The dotted part of each error profile is just shown for completeness and is not used for atmospheric analysis as it is heavily influenced by the apriori profile.
6 Intercomparison of profiles
The plots in Figs. 9 and 10 display comparisons between H2O profiles, version 2.2, of the Microwave Limb Sounder
on the EOS/Aura satellite (MLS) and the 24-h retrievals of the three ground based radiometers. The MLS H2O product
has an estimated 2-σ accuracy of below 0.5 ppm (8 %) at al-titudes below 0.1 hPa and below 0.4 ppm (11 %) at 0.01 hPa. Validation of MLS against other satellite and ground based instruments reveals no significant bias of MLS between 10 and 0.01 hPa, compare Lambert et al. (2007).
The criterion for a collocation of a MLS profile with the measurement site is the same as for the temperature data:
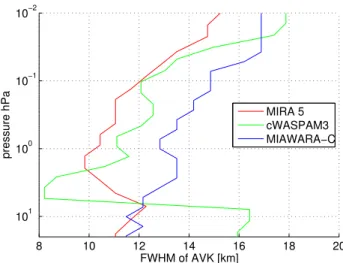
8 10 12 14 16 18 20
10−2
10−1
100
101
pressure hPa
FWHM of AVK [km]
MIRA 5 cWASPAM3 MIAWARA−C
Fig. 7. Width of the AVK of the three radiometers giving a rough measure of the spatial resolution.
±2◦(±220 km) in latitude and±5◦(±390 km) in longitude. A mean profile of all the measurements within that spatial range and the integration time of the radiometer is calculated and used for the comparison which results in 80/75/61 collo-cations for MIRA 5/cWASPAM3/MIAWARA-C.
Figure 9 displays a time series of middle atmospheric H2O
for 4 pressure ranges between 3 and 0.03 hPa. This reveals a good general agreement between MIRA 5, cWASPAM3, MIAWARA-C and MLS. The altitude range of the ground based profiles is limited as described in Sect. 5.2 and the profiles of all instruments are interpolated to the same pres-sure grid before taking the mean value. The changing parti-cle density is taken into account when calculating the VMR mean value in a certain pressure range in order to conserve the column density.
In the pressure ranges 0.3 to 0.1 hPa and 0.1 to 0.03 hPa MIRA 5, cWASPAM3 and MLS retrieve a similar evolution in the H2O-VMR even though the profile of MIRA 5 appears
0 0.2 0.4 0.6 0.8 10−2
10−1
100
101
MIRA 5
pressure [hPa]
0 0.2 0.4 0.6 0.8
10−2
10−1
100
101
1−sigma error [ppmv] cWASPAM3
meas. noise temperature calibration spectroscopy total systematic
0 0.2 0.4 0.6 0.8
10−2
10−1
100
101
MIAWARA−C
Fig. 8.Estimated 1-sigma errors in the retrieved profiles calculated for 5 February. The measurement noise error is regarded as random while all the other errors given are considered as systematic.
01/16 01/30 02/13 02/27 03/13 03/27 04/10
6 7 8
vmr [ppmv]
pressure 0.300−1.000 hPa
01/16 01/30 02/13 02/27 03/13 03/27 04/10
6 6.5 7 7.5
vmr [ppmv]
pressure 1.000−3.000 hPa
MIRA5 WASPAM MIA−C MLS
Fig. 9. Time series of middle atmospheric H2O for 4 pressure ranges between 3 and 0.03 hPa as observed by MIRA 5, cWAS-PAM3, MIAWARA-C and MLS. A mean value of the H2O-VMR within the pressure ranges indicated is used to account for the dif-ferent altitude resolution of MLS compared to the ground based instruments.
of MLS and cWASPAM3 is not well captured by MIRA 5. The few data points of MIAWARA-C available at high alti-tude are too noisy to make a definite statement. In the pres-sure ranges 3 to 1 hPa and 1 to 0.3 hPa the H2O-VMR stays
relatively constant over the whole comparison period. This is reflected in all the measurements available at these alti-tudes. The data of MIAWARA-C is noisier in winter than in spring which is an effect of to the measurement gaps due to bad weather conditions leading to a measurement noise strongly varying from day to day. The varying noise level leads to differences in the influence of the apriori profile on the retrieved profile. MIRA 5 has a significant dry-bias com-pared to MIAWARA-C and MLS which is also reflected in the profile comparisons shown in Fig. 10.
The mean value and standard deviation of the absolute dif-ference between the profiles of the three ground based ra-diometers and MLS is shown in Fig. 10. For the comparison with MLS the satellite profile is convolved with the AVK of the radiometer it is compared to. This convolution has two major effects on the satellite data: it degrades the altitude resolution at all altitudes and it decreases the sensitivity at altitudes where the AoA of the radiometer is smaller than unity.
The leftmost panel reveals that MIRA 5 has a dry bias of approximately 0.5 ppm (8 %) below 0.1 hPa with respect to the three other instruments. EOS/MLS is validated and no significant bias is known at the altitudes of interest. There-for we assume that the dry bias of MIRA 5 is real. The non linear retrieval of MIRA 5 seems to be less sensitive to the at-mospheric state (higher contribution from the apriori profile) than indicated by the AVK. As the apriori vmr is significantly lower than the profiles over the Zugspitze this can lead to a dry bias.
Fig. 10.Absolute difference between the profiles of the three ground based radiometers and MLS, mean value and standard deviation. The first line in the title of each plot indicates the radiometer that is taken to be the standard (rad1) the other instruments, named in line 2 to 4 (rad2), are compared to. The number of profiles compared is indicated in brackets in the title of each plot.
−100 −50 0 50 100
−0.25 −0.2 −0.15 −0.1 −0.05 0 0.05 0.1 0.15 0.2
∆
Tb
Frequency off−set from linecenter [MHz] integration time = 24h, opacity approx. 0.03
2009−02−05 2010−12−26
Fig. 11. 1-day integrated spectrum of MIAWARA-C during the ARIS campaign (observation angle = 26◦) and after the instrumen-tal improvements in the end of 2010 (observation angle = 11◦). The measurement noise has been improved by a factor of approximately 8 and is hardly visible in the red curve. The difference in the noise level within one spectrum is due to a binning applied to the wings for data reduction. A polynomial of second degree has been re-moved from the 2010 spectrum to account for the baselines or the different instrumental set-ups.
resolution of the instruments. Therefore the profiles of those two radiometers are not compared here. The agree-ment between MLS and cWASPAM3 is better than 0.3 ppm (6 %) and within the standard deviation at all altitudes. The rightmost panel shows that the same is true for MLS and MIAWARA-C.
7 Improvements and projects after ARIS
ARIS was the first measurement campaign in a somewhat re-mote location for the three radiometers and some instrumen-tal challenges were encountered, as described in this article. However, the direct intercomparison of the three radiome-ters indicated some suboptimal configurations which could be improved during or after the campaign.
7.1 MIRA 5
Depending on tropospheric background signal, the FFTS spectra exhibit pronounced distortions from the AOS that have unanimously been attributed to the Acqiris device (Straub et al., 2010). An RPG FFTS, described in Klein et al. (2008), has been added to the system in late April 2009 for comparison. After the ARIS campaign MIRA 5 stayed at Schneeferenerhaus until 13 July 2009 and was then taken back to Karlsruhe where it resumed operation on 15 Septem-ber 2009 in a slightly different set-up.
7.2 cWASPAM3
One of the design goals of the instrument was stability and low maintenance. The results presented here show that this was achieved. After the ARIS campaign cWASPAM3 re-mained in the Schneefernerhaus observatory and has contin-ued to provide good measurements.
7.3 MIAWARA-C
calibration targets where measured in every balancing cycle (every 30 s) these measurements have been only performed during the tipping curve calibration every 15 min since sum-mer 2009. This optimization increases the effective integra-tion time on the sky by nearly 100 %. Careful attenintegra-tion is now paid to measure the sky at elevation angles between 10◦ and 18◦in order to achieve the lowest possible measurement noise. In addition the correlation receiver was replaced by a dual-polarization receiver similar to the one of cWASPAM3 by the end of 2010 which improves the noise level by a factor of 2.
With all these changes it was possible to decrease the mea-surement noise of MIAWARA-C significantly, as shown in Table 2 and in Fig. 11. Given an opacity of 0.078 and an ob-servation angle of 15◦the noise level is improved by a factor
of 3.6 thanks to the changes in the receiver and calibration. If considered that during the ARIS campaign MIAWARA-C observed at an elevation angle of 35◦forτ=0.78 the noise level is even improved by a factor of 9. For the profiles this means that MIAWARA-C does now cover an altitude range of approximately 5 to 0.02 hPa for an integration time of 1.5 h given an opacity of 0.78.
In fall 2009 MIAWARA-C participated in the MOHAVE 2009 campaign at JPL’s Table Mountain Facility, USA, and in early 2010 it was operated from Finnish Meteorological Institute Arctic Research Centre in Sodankyl¨a, Finland in the frame of the LAPBIAT campaign.
8 Conclusions
The ARIS campaign was the first comparison of three ground based 22 GHz microwave radiometers with different setups performed at the same location. It offered the unique oppor-tunity to compare spectra and profiles of three new instru-ments measured from a high altitude site. Despite the fact that the three radiometers do not only use different front-and back ends, but also differ in the calibration concepts and slightly vary in profile retrieval, the overall agreement is good.
The spectra measured by all three radiometers show no severe baseline artifacts and are in good agreement. The measurement noises are compared to the values theoretically expected from the radiometer noise formula showing good agreement. At the same time the comparison of the noise levels emphasizes the importance of low elevation angles for the observation, a low receiver temperature and an effi-cient calibration scheme. Thanks to ARIS it was possible to reveal room for instrumental improvement especially in MIAWARA-C.
The comparisons of the retrieved profiles show that the agreement between the profiles of MIAWARA-C and cWAS-PAM3 with those of MLS is better than 0.3 ppm (6 %) at all altitudes. MIRA 5 has a dry bias of about 0.5 ppm (8 %) below 0.1 hPa with respect to all other instruments. The
profiles of cWASPAM3 and MIAWARA-C could not be di-rectly compared because the region of overlap was regarded as too small.
Acknowledgements. The Bern contribution has been supported by
the Swiss National Science Foundation grant 200020-124387. The Karlsruhe contribution has been partially founded by the Deutsche Forschungsgemeinschaft for the Priority Programm 1176 “Climate And Weather of the Sun-Earth System (CAWSES)”.
Edited by: D. Feist
References
Bernath, P. F., McElroy, C. T., Abrams, M. C., Boone, C. D., Bernath, P. F., Camy-Peyret, C., Carleer, M., Clerbaux, C., Co-heur, P.-F., Colin, R., Bernath, P. F., DeMazi`ere, M., Drummond, J. R., Dufour, D., Evans, W. F. J., Fast, H., Fussen, D., Gilbert, K., Jennings, D. E., Llewellyn, E. J., Lowe, R. P., Mahieu, E., McConnell, J. C., McHugh, M., McLeod, S. D., Michaud, R., Midwinter, C., R.Nassar, Nichitiu, F., Nowlan, C., Rinsland, C. P., Rochon, Y. J., Rowlands, N., Semeniuk, K., Simon, P., Skelton, R., Sloan, J. J., Soucy, M.-A., Strong, K., Tremblay, P., Turnbull, D., Walker, K. A., Walkty, I., Wardle, D. A., Wehrle, V., Zander, R., and Zou, J.: Atmospheric Chemistry Experiment (ACE): Mission overview, Geophys. Res. Lett., 32, L15S01, doi:10.1029/2005GL022386, 2005.
Buehler, S. A., Eriksson, P., Kuhn, T., von Engeln, A., and Verdes, C.: ARTS, the atmospheric radiative transfer simulator, J. Quant. Spectrosc. Ra., 91, 65–93, 2005.
de Wachter, E., Haefele, A., K¨ampfer, N., Ka, S., Lee, J. E., and Oh, J. J.: The Seoul Vapour Radiometer for the Middle Atmo-sphere; Calibration, Retrieval and Validation, Trans. Geosci. Re-mote Sens., 49, 1052–1062, doi:10.1109/TGRS.2010.2072932, 2010.
Deuber, B., K¨ampfer, N., and Feist, D. G.: A New 22-GHz Ra-diometer for Middle Atmospheric Water Vapor Profile Measure-ments, IEEE T. Geosci. Remote Sens., 42, 974–984, 2004. Dvortsov, V. L. and Solomon, S.: Response of the
strato-spheric temperatures and ozone to past and future increases in stratospheric humidity, J. Geophys. Res., 106, 7505–7514, doi:10.1029/2000JD900637, 2001.
Eriksson, P., Jim´enez, C., and Buehler, S. A.: Qpack, a general tool for instrument simulation and retrieval work, J. Quant. Spectrosc. Ra., 91, 47–64, 2005.
Flury, T., Hocke, K., Haefele, A., K¨ampfer, N., and Lehmann, R.: Ozone depletion, water vapor increase, and PSC generation at midlatitudes by the 2008 major stratospheric warming, J. Geo-phys. Res., 114, D18302, doi:10.1029/2009JD011940, 2008. Forkman, P., Eriksson, P., and Winnberg, A.: The 22 GHz
radio-aeronomy receiver at Onsala Space Observatory, J. Quant. Spec-trosc. Ra., 77, 23–42, 2003.
Forkman, P., Eriksson, P., Murtagh, D., and Espy, P.: Observing the vertical branch of the mesospheric circulation at latitude 60◦N using ground-based measurements of CO and H2O, J. Geophys. Res., 110, D05107, doi:10.1029/2004JD004916, 2005.
history of air entering the stratosphere in the tropics, J. Geophys. Res., 110, D08107, doi:10.1029/2004JD005516, 2005.
Golchert, S.: Stratospheric Water Vapour in the Tropics, Ph.D. the-sis, Universit¨at Bremen, 2010.
Haefele, A., De Wachter, E., Hocke, K., K¨ampfer, N., Nedoluha, G. E., Gomez, R. M., Eriksson, P., Forkman, P., Lambert, A., and Schwartz, M. J.: Validation of ground based microwave radiome-ters at 22 GHz for stratospheric and mesospheric water vapor, J. Geophys. Res., 114, D23305, doi:10.1029/2009JD011997, 2009. Hallgren, K.: Mesospheric water vapor; Variability at different timescales observed by ground-based microwave spectroscopy, Ph.D. thesis, Universit¨at Rostock, 2010.
Hallgren, K., Hartogh, P., and Jarchow, C.: A New, High-performance, Heterodyne Spectrometer for Ground-based Re-mote Sensing of Mesospheric Water Vapour, Adv. Geosci., 19, 569–578, 2010,
http://www.adv-geosci.net/19/569/2010/.
Hartogh, P.: High resolution chirp transform spectrometer for mid-dle atmospheric microwave sounding, in: Satellite Remote Sens-ing of Clouds and the Atmosphere II, Society of Photographic Instrumentation Engineers, vol. 3220, 115–124, 1998.
Hartogh, P. and Hartmann, G. K.: A high-resolution chirp transform spectrometer for microwave measurements, Meas. Sci. Tech., 1, 592–595, 1990.
Hartogh, P. and Jarchow, C.: Groundbased detection of middle at-mospheric water vapor, in: Global Process Monitoring and Re-mote Sensing of Ocean and Sea, SPIE, Society of Photographic Instrumentation Engineers, 188–195, 1995.
Hartogh, P., Sonnemann, G. R., Grygalashvyly, M., Song, L., Berger, U., and L¨ubken, F. J.: Water vapor measurements at ALOMAR over a solar cycle compared with model cal-culations by LIMA, J. Geophys. Res. Atmos., 115, D00I17, doi:10.1029/2009JD012364, 2010.
Jarchow, C.: Bestimmung atmosph¨arischer Wasserdampf- und Ozonprofile mittels bodengebundener Millimeterwellen-Fernerkundung, Ph.D. thesis, Universit¨at Bremen, 1998. Jarchow, C. and Hartogh, P.: Retrieval of data from ground-based
microwave sensing of the middle atmosphere: comparison of two inversion techniques, in: Global Process Monitoring and Remote Sensing of the Ocean and Sea Ice, Society of Photographic In-strumentation Engineers, vol. 2586, 196–205, 1995.
Klein, B., Kr¨amer, I., Hochg¨urtel, S., G¨usten, R., Bell, A., Meyer, K., and Chetik, C.: The Next Generation of Fast Fourier Trans-form Spectrometer, in: 19th International Symposium on Space Terahertz Technology, 2008.
K¨orner, U. and Sonnemann, G. R.: Global three-dimensional modeling of the water vapor concentration of the mesosphere-mesopause region and implications with respect to the noctilu-cent cloud region, J. Geophys. Res., 106, 9639–9651, 2001. Lambert, A., Read, W. G., Livesey, N. J., Santee, M. L., Manney,
G. L., Froidevaux, L., Wu, D. L., Schwartz, M. J., Pumphrey, H. C., Jimenez, C., Nedoluha, G. E., Cofield, R. E., Cuddy, D. T., Daffer, W. H., Drouin, B. J., Fuller, R. A., Jarnot, R. F., Knosp, B. W., Pickett, H. M., Perun, V. S., Snyder, W. V., Stek, P. C., Thurstans, R. P., Wagner, P. A., Waters, J. W., Jucks, K. W., Toon, G. C., Stachnik, R. A., Bernath, P. F., Boone, C. D., Walker, K. A., Urban, J., Murtagh, D., Elkins, J. W., and Atlas, E.: Vali-dation of the Aura Microwave Limb Sounder middle atmosphere water vapor and nitrous oxide measurements, J. Geophys. Res.,
112, D24S36, doi:10.1029/2007JD008724, 2007.
Lee, J. N., Wu, D. L., Manney, G. L., Schwartz, M. J., Lambert, A., Livesey, N. J., Minschwander, K. R., Pumphrey, H. C., and Read, W. G.: Aura Microwave Limb Sounder observations of the polar middle atmosphere: Dynamics and transport of CO and H2O, J. Geophys. Res., 116, D05110, doi:10.1029/2010JD014608, 2011. Liebe, H. J.: MPM – An atmospheric millimeter-wave propagation
model, Int. J. Infrared Milli., 10, 631–650, 1989.
Marsh, D., Smith, A., and Noble, E.: Mesospheric ozone re-sponse to changes in water vapor, J. Geophys. Res., 108, 4109, doi:10.1029/2002JD002705, 2003.
Milz, M., von Clarmann, T., Fischer, H., Glatthor, N., Grabowski, U., H¨opfner, M., Kellmann, S., Kiefer, M., Linden, A., Tsidu, G. M., Steck, T., Stiller, G. P., Funke, B., L´opez-Puertas, M., and Koukouli, M. E.: Water vapor distributions measured with the Michelson Interferometer for Passive Atmospheric Sounding on board Envisat (MIPAS/Envisat), J. Geophys. Res., 110, D24307, doi:10.1029/2005JD005973, 2005.
Moran, J. M., Papadopoulos, G. D., Burke, B. F., Lo, K. Y., Schwartz, P. R., Thacker, D. L., Johnston, K. J., Knowles, S. H., Reisz, A. C., and Shapiro, I. I.: Very Long Baseline Interferomet-ric Observations of the H2O Sources in W49 N, W3(OH), Orion A and VY canis Majoris, Astrophys. J., 185, 535–567, 1973. Mote, P. W., Rosenlof, K. H., Mclntyre, M. E., Carr, E. S.,
Gille, J. C., Holton, J. R., Kinnersley, J. S., Pumphrey, H. C., Russell, J. M., and Waters, J. W.: An atmospheric tape recorder: The imprint of tropical tropopause temperatures on stratospheric water vapor, J. Geophys. Res., 101, 3989–4006, doi:10.1029/95JD03422, 1996.
Motte, E., Ricaud, P., Gabard, B., Niclas, M., and Gangneron, F.: A 22-GHz Mobile Microwave Radiometer (MobRa) for the Study of Middle Atmospheric Water Vapor, IEEE T. Geosci. Remote Sens., 46, 3104–3114, 2008.
Murtagh, D., Frisk, U., Merino, F., Ridal, M., Jonsson, A., Stegman, J., Witt, G., Eriksson, P., Jim´enez, C., Megie, G., de la No¨e, J., Ricaud, P., Baron, P., Pardo, J. R., Hauchcorne, A., Llewellyn, E. J., Degenstein, D. A., Gattinger, R. L., Lloyd, N. D., Evans, W. F., McDade, I. C., Haley, C. S., Sioris, C., von Savigny, C., Solheim, B. H., McConnell, J. C., Strong, K., Richardson, E. H., Leppelmeier, G. W., Kyr¨ol¨a, E., Auvinen, H., and Oikarinen, L.: An overview of the Odin atmospheric mission, Can. J. Phys., 80, 309–319, 2002.
Nedoluha, G. E., Bevilacqua, R. M., Gomez, R. M., Thacker, D. L., Waltman, W. B., and Pauls, T. A.: Ground-based measurements of water vapor in the middle atmosphere, J. Geophys. Res., 100, 2927–2937, 1995.
Nedoluha, G. E., Bevilacqua, R. M., Gomez, R. M., Hicks, B. C., and III, J. M. R.: Measurements of middle atmo-spheric water vapor from low and midlatitude in the Northern Hemisphere, 1995–1998, J. Geophys. Res., 104, 19257–19266, doi:10.1029/1999JD900419, 1999.
Nedoluha, G. E., Gomez, R. M., Hicks, B. C., Bevilacqua, R. M., Russell, J., Connor, B. J., and Lambert, A.: A comparison of middle atmospheric water vapor as measured by WVMS, EOS-MLS, and HALOE, J. Geophys. Res., 112, D24S39, doi:10.1029/2007JD008757, 2007.
114, D23303, doi:10.1029/2009JD012504, 2009.
Paganini, L. and Hartogh, P.: Analysis of nonlinear effects in microwave spectrometers, J. Geophys. Res., 114, D13305, doi:10.1029/2008JD011141, 2009.
Poynter, R. L. and Pickett, M.: Submillimeter, millimeter, and microwave spectral line catalog, Appl. Optics, 24, 2235–2240, 1985.
Quack, M.: Aufbau eines Wasserdampfradiometers und Messung von stratosph¨arischen Wasserdampfprofilen in den Tropen und in der Arktis, Ph.D. thesis, Universit¨at Bremen, 2004.
Remsberg, E.: Observed seasonal to decadal scale responses in mesospheric water vapor, J. Geophys. Res., 115, D06306, doi:10.1029/2009JD012904, 2010.
Rodgers, C. D.: Retrieval of Atmospheric Temperature and Composition from Remote Measurements of Ther-mal Radiation, Rev. Geophys. Space Phys., 14, 609–624, doi:10.1029/RG014i004p00609, 1976.
Rodgers, C. D.: Inverse Methodes for Atmospheric Soundings, World Scientific Publishing Co. Pte. Ltd, Singapore, 2000. Seele, C. and Hartogh, P.: Annual variation and summer
meso-sphere conditions as observed by ground-based microwave spec-troscopy, Geophys. Res. Lett., 26, 1517–1520, 1999.
Seele, C. and Hartogh, P.: A case study on middle at-mospheric water vapor transport during the February 1998 stratospheric warming, Geophys. Res. Lett., 27, 3309–3312, doi:10.1029/2000GL011616, 2000.
Solomon, S., Rosenlof, K. H., Portmann, R. W., Daniel, J. S., Davis, S. M., Sanford, T. J., and Plattner, G.-K.: Con-tributions of Stratospheric Water Vapor to Decadal Changes in the Rate of Global Warming, Science, 327, 1219–1223, doi:10.1126/science.1182488, 2010.
Sonnemann, G. R., Hartogh, P., Grygalashvyly, M., Song, L., and Berger, U.: The quasi 5-day signal in the mesospheric water va-por concentration at high latitudes in 2003 – A comparison be-tween observations at ALOMAR and calculations, J. Geophys. Res., 113, D04101, doi:10.1029/2007JD008875, 2008.
Straub, C., Murk, A., Teniente, J., and K¨ampfer, N.: Optical design for a compact 22 GHz radiometer for middle atmospheric water vapor, in: EUCAP 2007 Conference proceedings, 2007. Straub, C., Murk, A., K¨ampfer, N., Zardet, D., and Stuber, B.:
De-velopement of a 22 GHz Correlating Radiometer for the Obser-vation of Stratospheric Water Vapor, in: Microrad 2008 Confer-ence proceedings, 2008.
Straub, C., Murk, A., and K¨ampfer, N.: MIAWARA-C, a new ground based water vapor radiometer for measurement cam-paigns, Atmos. Meas. Tech., 3, 1271–1285, doi:10.5194/amt-3-1271-2010, 2010.
Thacker, D. L., Bevilacqua, R. M., Waltman, W. B., Pauls, T. A., Gomez, R. M., Nedoluha, G. E., and Schwartz, R. R.: Ground-based sensing of water vapor in the stratosphere and mesosphere, IEEE T. Instrument. Meas., 44, 355–359, 1995.
Tiuri, M. E.: RadioAstronomyReceivers, IEEE T. Antenna. Propa-gation, 12, 930–938, 1964.
Villanueva, G. L. and Hartogh, P.: The high resolution chirp trans-form spectrometer for the SOFIA-GREAT instrument, Exp. As-tron., 18, 77–91, 2004.
Villanueva, G. L., Hartogh, P., and Reindl, L.: A Digital Dispersive Matching Network for SAW Devices in Chirp Transform Spec-trometers, IEEE T. Microwave Theor. Tech., 54, 1415–1424, 2006.