BGD
11, 3701–3730, 2014Effect of enhanced
pCO2 levels G. A. MacGilchrist et al.
Title Page Abstract Introduction Conclusions References Tables Figures
◭ ◮
◭ ◮
Back Close Full Screen / Esc
Printer-friendly Version Interactive Discussion
Discussion
P
a
per
|
D
iscussion
P
a
per
|
Discussion
P
a
per
|
Discuss
ion
P
a
per
|
Biogeosciences Discuss., 11, 3701–3730, 2014 www.biogeosciences-discuss.net/11/3701/2014/ doi:10.5194/bgd-11-3701-2014
© Author(s) 2014. CC Attribution 3.0 License.
Open Access
Biogeosciences
Discussions
This discussion paper is/has been under review for the journal Biogeosciences (BG). Please refer to the corresponding final paper in BG if available.
E
ff
ect of enhanced
p
CO
2
levels on the
production of DOC and TEP in short-term
bioassay experiments
G. A. MacGilchrist1,*, T. Shi1, T. Tyrrell1, S. Richier1, C. M. Moore1, C. Dumousseaud1, and E. P. Achterberg1,2
1
Ocean and Earth Science, National Oceanography Centre, Southampton, University of Southampton, Southampton, UK
2
GEOMAR, Helmholtz Centre for Ocean Research, Kiel, Germany
*
now at: Department of Earth Sciences, University of Oxford, Oxford, UK
Received: 26 January 2014 – Accepted: 3 February 2014 – Published: 6 March 2014
Correspondence to: E. P. Achterberg ([email protected])
BGD
11, 3701–3730, 2014Effect of enhanced
pCO2 levels G. A. MacGilchrist et al.
Title Page Abstract Introduction Conclusions References Tables Figures
◭ ◮
◭ ◮
Back Close Full Screen / Esc
Printer-friendly Version Interactive Discussion
Discussion
P
a
per
|
D
iscussion
P
a
per
|
Discussion
P
a
per
|
Discuss
ion
P
a
per
Abstract
It has been proposed that increasing levels ofpCO2 in the surface ocean will lead to
more partitioning of the organic carbon fixed by marine primary production into the dissolved rather than the particulate fraction. This process may result in enhanced ac-cumulation of dissolved organic carbon (DOC) in the surface ocean and/or concurrent
5
accumulation of transparent exopolymer particles (TEP), with important implications for the functioning of the marine carbon cycle. We investigated this in shipboard bioassay experiments that considered the effect of four differentpCO2scenarios (ambient, 550,
750 and 1000 µatm) on unamended natural phytoplankton communities from a range of locations in the northwest European shelf seas. The environmental settings, in terms
10
of nutrient availability, phytoplankton community structure and growth conditions, var-ied considerably between locations. We did not observe any strong or consistent effect ofpCO2on DOC production. There was a significant but highly variable effect ofpCO2 on the production of TEP. In three of the five experiments, variation of TEP production betweenpCO2treatments was caused by the effect ofpCO2on phytoplankton growth 15
rather than a direct effect on TEP production. In one of the five experiments, there was evidence of enhanced TEP production at highpCO2 (twice as much production over
the 96 h incubation period in the 750 µatm treatment compared with the ambient treat-ment) independent of indirect effects, as hypothesised by previous studies. Our results suggest that the environmental setting of experiments (community structure, nutrient
20
availability and occurrence of phytoplankton growth) is a key factor determining the TEP response topCO2perturbations.
1 Introduction
Uptake of anthropogenic carbon dioxide (CO2) is lowering the pH of the surface ocean
(Doney et al., 2009). The effect that this will have on various components of the marine
25
BGD
11, 3701–3730, 2014Effect of enhanced
pCO2 levels G. A. MacGilchrist et al.
Title Page Abstract Introduction Conclusions References Tables Figures
◭ ◮
◭ ◮
Back Close Full Screen / Esc
Printer-friendly Version Interactive Discussion
Discussion
P
a
per
|
D
iscussion
P
a
per
|
Discussion
P
a
per
|
Discuss
ion
P
a
per
|
2010; Wernberg et al., 2012). Of particular interest is the effect of ocean acidification on components of the marine carbon cycle, since there is the potential for both positive and negative feedbacks to rising atmospheric pCO2 (Riebesell et al., 2007; Gehlen
et al., 2011; Passow and Carlson, 2012). In this study, we focus on two elements of the marine carbon cycle: dissolved organic carbon (DOC) and transparent exopolymer
5
particles (TEP).
Dissolved organic carbon forms the largest oceanic reservoir of reduced carbon (Hansell et al., 2009). Typical DOC concentrations are 60 to 80 µM in surface wa-ters of the open ocean and <50 µM in the deep ocean (Hansell et al., 2009), while concentrations in coastal waters are enhanced by higher levels of primary production
10
and inputs from rivers (Dafner and Wangersky, 2002). The biologically labile fraction of DOC is a substrate to heterotrophic microbial communities, who remineralise it to CO2, and thereby make DOC an important component of the microbial carbon loop
and marine carbon cycle (Hansell, 2013). The recalcitrant DOC fraction that evades remineralisation is transported to the deep ocean through advection, making an
impor-15
tant contribution to the biological carbon pump (Ducklow et al., 2001).
Transparent exopolymer particles are gel-like particles that form through coagula-tion of the polysaccharide fraccoagula-tion of dissolved organic matter (Passow, 2002). These particles have a “stickiness” that facilitates aggregation of other particles such as phy-toplankton cells, forming large marine aggregates capable of sinking (Engel et al.,
20
2004b). Furthermore, the elemental composition of TEP is not constrained by stoichio-metric ratios and can be rich in carbon (Passow, 2002), meaning that these sinking aggregates can also have a high carbon content. Consequently, through both their high carbon content and their role as a facilitator of export, TEP make an important contribution to the biological carbon pump.
25
Dissolved organic carbon and TEP are inherently linked and form key components of the marine carbon cycle and the biological carbon pump. Consequently, understanding their operation in a future high CO2world is central to predicting changes to the wider
BGD
11, 3701–3730, 2014Effect of enhanced
pCO2 levels G. A. MacGilchrist et al.
Title Page Abstract Introduction Conclusions References Tables Figures
◭ ◮
◭ ◮
Back Close Full Screen / Esc
Printer-friendly Version Interactive Discussion
Discussion
P
a
per
|
D
iscussion
P
a
per
|
Discussion
P
a
per
|
Discuss
ion
P
a
per
Previous studies considering the effects of enhanced pCO2 on DOC and/or TEP have adopted a range of different approaches. We can broadly categorise them based on whether or not they stimulated growth by nutrient addition and whether they used a single phytoplankton species or a natural assemblage. With respect to DOC, a meso-cosm study by Kim et al. (2011) observed∼20 % more DOC production at highpCO2 5
(900 µatm) compared to ambient levels in a natural phytoplankton community when growth was stimulated by nutrient addition. Yoshimura et al. (2010) and Yoshimura et al. (2013) found the opposite effect in bioassay experiments in the Sea of Okhotsk and sub-Arctic Pacific respectively, in which no nutrients were added. Yoshimura et al. (2010) observed significantly lower DOC accumulation in communities exposed to
10
pCO2levels of>480 µatm, while Yoshimura et al. (2013) measured consistently higher concentrations of DOC in the lowestpCO2treatment (300 µatm) over the first 10 days
of their experiment. Engel et al. (2004a) stimulated growth (by nutrient addition) of the coccolithophore,Emiliana huxleyi, in mesocosms at three different levels ofpCO2(190, 410 and 710 µatm) and found no significant difference in DOC accumulation withpCO2 15
treatment. More recently, during a mesocosm experiment in the Arctic Ocean in which communities were exposed topCO2levels between 170 and 1100 µatm, Engel et al. (2013) found that DOC production (measured by 14C uptake) was greater at higher pCO2 both before and after nutrient addition, while the accumulation of DOC was
en-hanced only before nutrients were added. In a similar experimental set-up in the Baltic
20
Sea, Engel et al. (2014) found no effect of increased CO2on DOC accumulation.
Experiments on TEP have produced some more consistent results. Incubation ex-periments by Engel (2002) observed enhanced TEP production at higher pCO2 in a natural phytoplankton assemblage in nitrate-limited waters. Similarly, the mesocosm study of Engel et al. (2004a) and growth stimulating batch culture experiments of
Pe-25
drotti et al. (2012) found that, after normalisation for variable levels of growth, more TEP was produced byE. huxleyi and other coccolithophore species (Calcidiscus
lepto-porus,Syracosphaera pulchra) when they were exposed topCO2levels of>700 µatm.
BGD
11, 3701–3730, 2014Effect of enhanced
pCO2 levels G. A. MacGilchrist et al.
Title Page Abstract Introduction Conclusions References Tables Figures
◭ ◮
◭ ◮
Back Close Full Screen / Esc
Printer-friendly Version Interactive Discussion
Discussion
P
a
per
|
D
iscussion
P
a
per
|
Discussion
P
a
per
|
Discuss
ion
P
a
per
|
carbon uptake at high pCO2, which they infer to have resulted in enhanced TEP for-mation. Borchard and Engel (2012) directly measured extracellular release of organic carbon (using14C) as well as abundance of combined carbohydrates (precursors to TEP formation) in phosphorus-controlled chemostats withE. huxleyi, in which steady state growth was maintained by constant nutrient addition. They found that, under
con-5
ditions of nutrient limitation, TEP production was significantly greater at greenhouse conditions (pCO2of 900 µatm, temperature of 18◦C) compared to ambient conditions (300 µatm, 14◦C) due to greater extracellular release of TEP precursors. The afore-mentioned study of Engel et al. (2014) also considered the effect of CO2 on TEP in
nutrient-enriched mesocosm experiments in the Baltic Sea. During the peak of the
10
bloom, TEP concentration was significantly greater at highpCO2, and this appeared to facilitate higher levels of organic matter sedimentation.
Despite the different approaches of these studies, the generally accepted hypothesis is that, under highpCO2conditions, more of the organic carbon fixed by photosynthe-sis is channeled into the dissolved fraction and released from the cells. This leads to
15
a greater standing stock of TEP as the released matter coagulates into particulates, while the effect on the standing stock of DOC is less certain. While giving insights into likely mechanisms, these conclusions were mostly drawn from idealised (nutri-ent addition, single phytoplankton species) and/or isolated (single natural assemblage) experiments. Consequently, as the authors highlighted, their results may not be
repre-20
sentative of the natural world response or applicable on a wide scale.
In the present work, we tested the conclusions of these previous studies in una-mended (no nutrient addition) natural ecosystems from a range of locations in the European shelf seas and in a range of environmental settings. As such, to the extent that is possible in manipulation experiments, the results reflect a real-world community
25
response to enhancedpCO2 conditions and offer insight into the spatial variability of this response. The aim of this study is to investigate whether the production of DOC and/or TEP is enhanced at highpCO2, and whether the environmental settings of the
BGD
11, 3701–3730, 2014Effect of enhanced
pCO2 levels G. A. MacGilchrist et al.
Title Page Abstract Introduction Conclusions References Tables Figures
◭ ◮
◭ ◮
Back Close Full Screen / Esc
Printer-friendly Version Interactive Discussion
Discussion
P
a
per
|
D
iscussion
P
a
per
|
Discussion
P
a
per
|
Discuss
ion
P
a
per
2 Methods
2.1 Bioassay set up
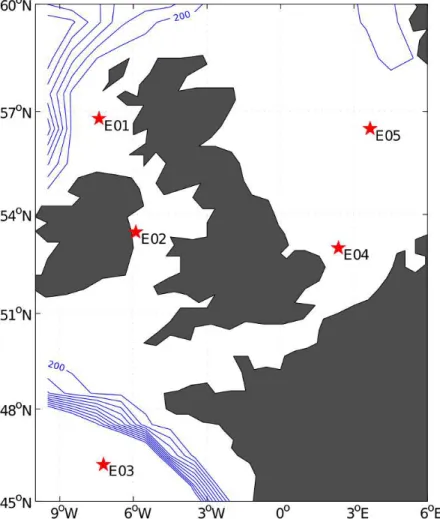
Five shipboard bioassay experiments were performed during a cruise in northwest European shelf seas in June and July, 2011. Locations are presented in Fig. 1. An overview of the methodology is presented here and more details of the sampling and
5
incubation procedures are provided in Richier et al. (2014).
Surface seawater (∼5 m depth) was collected before dawn from one CTD cast
(24×20 L Ocean Test Equipment (OTE) bottles) and dispensed from randomly
as-signed OTE bottles through silicon tubing into 72×4.5 L acid-washed polycarbonate
bottles (Nalgene). The bioassay experiments were carried out in a purpose-built
incu-10
bator, which maintained in situ temperatures from the time of sampling and provided controlled light levels through daylight simulation LED panels (100 µE m−2s−1) on an
18/6 h light/dark cycle. Each bioassay ran for four days, with measurements taken at the start and after 48 and 96 h. The bottles from which samples were collected for the various measurements were sacrificed and hence not further incubated.
15
For each of the five experiments, carbonate chemistry in the seawater was artifi-cially manipulated to achieve four different targetpCO2levels (Ambient, 550, 750 and
1000 µatm) through the equimolar addition of NaHCO−
3 and HCl (Gattuso et al., 2010).
The volumes of NaHCO−3 and HCl required to achieve the target pCO2 levels were
determined from the initial total alkalinity (AT) and dissolved inorganic carbon (CT)
20
measurements in the sample seawater, using CO2SYS in Matlab and the equilibrium constants of the carbonate system from Mehrbach et al. (1973), refitted by Dickson and Millero (1987). Sampling and analyses forATandCTwere made following the sampling procedures described by Dickson et al. (2007); full details are provided in Richier et al. (2014). The effectiveness of the manipulation was immediately verified by subsequent
25
measurements. Actual initialpCO2values achieved by the manipulation were close to,
BGD
11, 3701–3730, 2014Effect of enhanced
pCO2 levels G. A. MacGilchrist et al.
Title Page Abstract Introduction Conclusions References Tables Figures
◭ ◮
◭ ◮
Back Close Full Screen / Esc
Printer-friendly Version Interactive Discussion
Discussion
P
a
per
|
D
iscussion
P
a
per
|
Discussion
P
a
per
|
Discuss
ion
P
a
per
|
2.2 Nutrient and chlorophyll analysis
Analysis for micro-molar concentrations of nitrate+nitrite (hereafter nitrate) and phos-phate were undertaken during the cruise using a segmented flow auto-analyser (Skalar San+) following methods described by Kirkwood (1996).
Both total and size-fractionated chlorophyll a (Chl a) concentrations were
deter-5
mined. Seawater was filtered through 25 mm diameter glass fibre filters (0.7 µm nomi-nal pore size; Whatman GF/F) and 25 mm diameter polycarbonate filters (10 µm pore size; Nuclepore, Whatman) for total Chl a and the >10 µm size fraction (hereafter “>10 µm Chl a”) respectively. The <10 µm size fraction (hereafter “<10 µm Chl a”) was determined from the difference between total and >10 µm Chla concentrations.
10
All filters were extracted in 90 % acetone for 24 h, and Chlawas quantified by fluorom-etry (Turner Designs Trilogy fluorometer) following Welschmeyer (1994). Chlorophylla concentrations were calibrated against dilutions of a solution of pure Chl a (Sigma, UK) in 90 % acetone, with instrument drift further corrected by daily measurement of a solid fluorescence standard. No size fractionation was determined for the bioassay
15
experiment E1.
2.3 Dissolved organic carbon and TEP measurements
For both DOC and TEP, triplicate measurements were made for eachpCO2treatment
at each time point. For DOC, seawater was filtered using pre-combusted (450◦C, 4 h) glass fibre filters (0.7 µm nominal pore size; MF300, Fisher Scientific) to remove
par-20
ticulate carbon and most organisms. Samples were directly filtered into pre-combusted 25 mL glass ampoules and immediately acidified to pH<2 using 40 µL 50 % HCl. The ampoules were sealed and stored at 4◦C. Onshore, the samples were analysed using
a high temperature catalytic combustion technique (Shimadzu TOC-TDN; Spyres et al., 2000). The samples were sparged with high purity oxygen gas to removeCTand
com-25
BGD
11, 3701–3730, 2014Effect of enhanced
pCO2 levels G. A. MacGilchrist et al.
Title Page Abstract Introduction Conclusions References Tables Figures
◭ ◮
◭ ◮
Back Close Full Screen / Esc
Printer-friendly Version Interactive Discussion
Discussion
P
a
per
|
D
iscussion
P
a
per
|
Discussion
P
a
per
|
Discuss
ion
P
a
per
preserved in glass ampoules and provided by D. Hansell (University of Miami), served as a certified reference material. Our daily analysis of the reference material yielded a mean concentration of 42.7±1.2 µM (n=64), which was in good agreement with the
certified value of 41–44 µM. Our analytical precision, based on the coefficient of vari-ation (standard devivari-ation/mean) of consecutive injections (typically 3–5 injections) of
5
a single sample, was typically<1 %.
Samples for TEP were collected by filtration of seawater through 25 mm diameter polycarbonate filters (0.45 µm pore-size, Sterlitech) at constant vacuum (200 mbar). The particles retained on the filters were stained with 500 µL of 0.02 % aqueous so-lution of Alcian Blue in 0.06 % acetic acid (pH=2.5). The dye was pre-filtered using
10
a polycarbonate filter (0.2 µm pore-size; Sterlitech) before use. Stained filters were rinsed once with deionised water (Milli-Q, Millipore) and then transferred into 15 mL polypropylene centrifuge tubes (Fisher Scientific) and stored at−20◦C. Onshore, the
amount of Alcian Blue adsorbed onto the filters was determined following a soak in 6 mL of 80 % sulphuric acid for 2 h and determination of the absorbance of the
re-15
sulting solution at 787 nm (absorption maximum) using a spectrophotometer (U-1800, Hitachi). The amount of Alcian Blue in the solution was directly related to the weight of the polysaccharide that was retained on the filter (Passow and Alldredge, 1995).
Elevated DOC concentrations were measured in just one of the three replicate bot-tles for each of the following experiments after 48 h: 750 µatm treatment of E1 and the
20
550 and 750 µatm treatment of E4. The measured value was considerably higher than in the other two replicates, causing a spike in the time evolution and an exception-ally large standard deviation at these time points (>35 µM, compared to<5 µM for all other experiments). The Grubbs test (Grubbs, 1969) was used to identify these ele-vated values as outliers at the 95 % confidence level. Given the susceptibility of DOC
25
BGD
11, 3701–3730, 2014Effect of enhanced
pCO2 levels G. A. MacGilchrist et al.
Title Page Abstract Introduction Conclusions References Tables Figures
◭ ◮
◭ ◮
Back Close Full Screen / Esc
Printer-friendly Version Interactive Discussion
Discussion
P
a
per
|
D
iscussion
P
a
per
|
Discussion
P
a
per
|
Discuss
ion
P
a
per
|
2.4 Statistical analysis
For each variable, experiment and time point, a one-way ANOVA test was carried out to determine if mean concentrations were significantly different between treatments. Subsequently, the Tukey–Kramer test statistic was used to determine the significance of the difference between each treatment. In the results, quotedp values correspond
5
to Tukey–Kramer test.
3 Results
3.1 Environmental settings and communities physiological response
Before considering the response of TEP and DOC in the bioassay experiments, we describe the environmental conditions of each experiment, with respect to nutrient
10
availability, phytoplankton size structure and phytoplankton growth. Those features that were found to be important for the interpretation of the DOC and TEP responses are highlighted here. For further results of the bioassay experiments, see Richier et al. (2014).
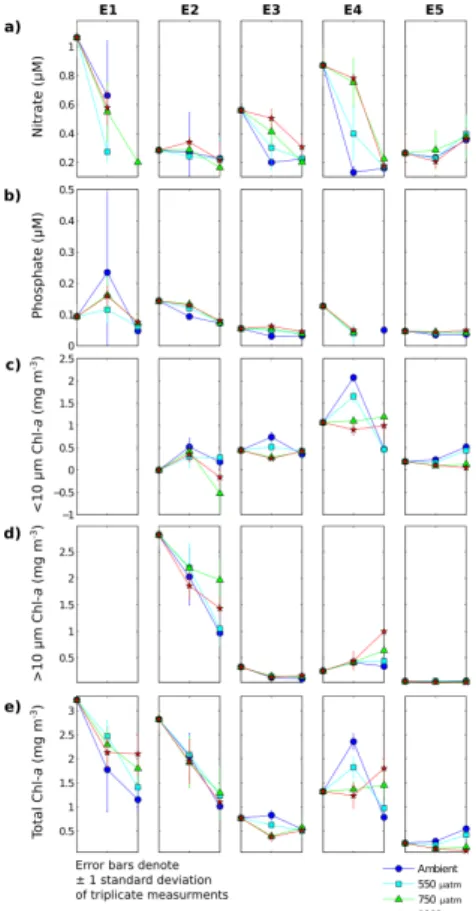
Figure 2 shows the time evolution of the nutrient (nitrate and phosphate) and Chla
15
concentrations (total and size-fractionated). The highest initial concentrations of nitrate (>1 µM) and total Chla(>3 mg m−3; no size-fractionation available) were observed in E1 (56◦47.7′N 7◦24.3′W, stratified water column) and these decreased rapidly
through-out the time course in all treatments. There was no obvious pattern of treatment depen-dence in the decline of these variables, except in the final concentration of Chla, which
20
was significantly higher in the 750 and 1000 µatm treatments than in the Ambient and 550 µatm treatments (p <0.01).
In E2 (52◦28.2′N 5◦54.1′W, well-mixed water column), initially high levels of Chl a (∼2.8 mg m−3; all>10 µm Chl a) and low nitrate concentration (∼0.3 µM) were
sug-gestive of a recent phytoplankton bloom that was reaching termination, possibly due
BGD
11, 3701–3730, 2014Effect of enhanced
pCO2 levels G. A. MacGilchrist et al.
Title Page Abstract Introduction Conclusions References Tables Figures
◭ ◮
◭ ◮
Back Close Full Screen / Esc
Printer-friendly Version Interactive Discussion
Discussion
P
a
per
|
D
iscussion
P
a
per
|
Discussion
P
a
per
|
Discuss
ion
P
a
per
to nitrate limitation. Chlorophyll a levels decreased through the time course, implying grazing and/or lysis of the phytoplankton that were present. In the 750 and 1000 µatm treatments at 96 h, there were higher concentrations of >10 µm Chl a than of total Chla, suggesting a filtration or measurement error. Except in the measurements cor-responding to this possible error, there was no significant pattern of treatment
depen-5
dence in the decline of Chla. Nitrate and phosphate concentrations decreased overall, suggesting some continued utilisation despite no net growth.
Experiment E3 (46◦12.1′N 7◦13.3′W, stratified water column) had an initially en-hanced concentration of nitrate (>0.5 µM) but was depleted in phosphate (∼0.05 µM).
Over the first 48 h, significantly more nutrient utilisation was observed at lowerpCO2
10
(p <0.01). Concurrently, an increase in <10 µm Chla– implying net growth of small-celled phytoplankton – was observed in the Ambient and 550 µatm treatments while a decrease occurred in the 750 or 1000 µatm treatments. This suggests that phyto-plankton growth and nutrient uptake were initially suppressed in communities exposed to higher levels ofpCO2. Between 48 and 96 h, with nutrient concentrations now lower 15
in the Ambient and 550 µatm treatments, further growth was suppressed and Chl a levels decreased. In contrast, there were sufficient remaining nutrients in the 750 and 1000 µatm treatments to support net growth of small-celled phytoplankton through to the end of the incubation.
The pattern in the environmental conditions of E4 (52◦59.7′N 2◦29.8′E, well-mixed 20
water column) was similar to that of E3, but the response was magnified due to the higher initial nutrient concentrations (nitrate ∼0.8 µM, phosphate ∼0.12 µM). As in
E3, growth was suppressed at higherpCO2 levels in the first 48 h leading to signifi-cantly less nitrate utilisation and net small-celled phytoplankton growth in the 750 and 1000 µatm treatments (p <0.01). Subsequently, between 48 and 96 h, the depleted
ni-25
BGD
11, 3701–3730, 2014Effect of enhanced
pCO2 levels G. A. MacGilchrist et al.
Title Page Abstract Introduction Conclusions References Tables Figures
◭ ◮
◭ ◮
Back Close Full Screen / Esc
Printer-friendly Version Interactive Discussion
Discussion
P
a
per
|
D
iscussion
P
a
per
|
Discussion
P
a
per
|
Discuss
ion
P
a
per
|
higher pCO2 treatments over this time step was predominantly of large-celled phyto-plankton. Consequently, despite comparable utilisation of nutrients, significantly higher Chlaconcentrations were measured at higherpCO2levels after 96 h (p <0.01).
In E5 (56◦30.3′N 3◦39.5′E, stratified water column), Chl a levels were initially low (∼0.2 mg m−3, all <10 µm Chl a), as were nitrate and phosphate concentrations 5
(∼0.25 and∼0.05 µM respectively). In the first 48 h, there was a similar response in
Chlato that of E3 and E4, with significantly less net growth at higherpCO2(p <0.05). A treatment-dependent response was not observed in the nutrient concentrations. Be-tween 48 and 96 h, levels of<10 µm Chlacontinued to diverge, with further net growth in the Ambient and 550 treatments and a sustained decrease of Chla in the 750 and
10
1000 treatments.
3.2 Response of DOC topCO2perturbation
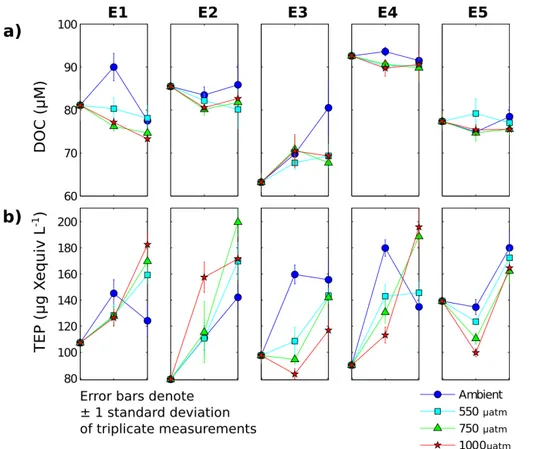
Figure 3a shows the time evolution of DOC concentrations in the bioassay experiments. The extent to which differences in concentrations between treatments were statistically significant is presented in Table 1. Initial DOC concentrations ranged between∼60 µM 15
in E3 and∼90 µM in E4. Throughout the experiments, DOC concentrations varied by ±10 µM but only rarely showed statistically significant differences between treatments.
Notably, on each occasion that significant differences between treatments were ob-served, it was due to a higher concentration of DOC in the Ambient treatment in com-parison to that at higher pCO2. This suggests that DOC production (or lack of DOC 20
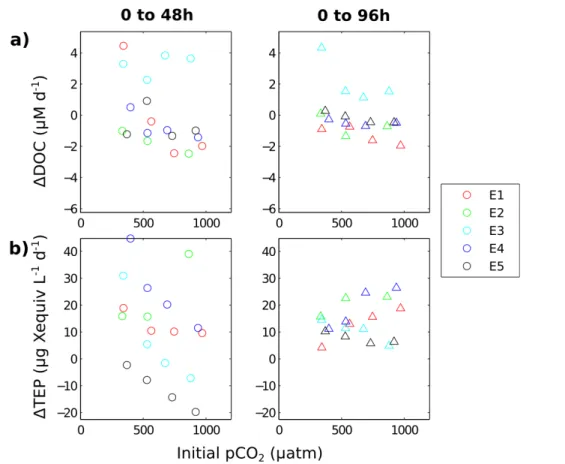
breakdown) was favoured most frequently in the AmbientpCO2treatment. This is re-inforced by Fig. 4a, which shows the rate of DOC production/breakdown across each time step (0 to 48 h and 0 to 96 h) against the initialpCO2value (actual values rather
than target pCO2 levels). Although the response was highly variable, a lower pCO2 level appeared to favour DOC production (or inhibit DOC breakdown) after 48 h in E1,
25
BGD
11, 3701–3730, 2014Effect of enhanced
pCO2 levels G. A. MacGilchrist et al.
Title Page Abstract Introduction Conclusions References Tables Figures
◭ ◮
◭ ◮
Back Close Full Screen / Esc
Printer-friendly Version Interactive Discussion
Discussion
P
a
per
|
D
iscussion
P
a
per
|
Discussion
P
a
per
|
Discuss
ion
P
a
per
3.3 Response of TEP topCO2perturbation
Figure 3b shows the time evolution of TEP concentrations in the bioassay experiments. The extent to which differences in concentrations between treatments were statistically significant is presented in Table 1. For all experiments, initial concentrations of TEP were between 80 and 140 µg Xequiv L−1(µg Xanthan equivalent L−1), and increased
af-5
ter the first time step in all experiments except E5 and the high pCO2 treatments of E3. In contrast to DOC, a statistically significant difference between treatments was observed in all experiments (Table 1).
In E1, TEP concentrations increased throughout the incubation period in all except the Ambient treatment, in which concentrations decreased between 48 and 96 h to
10
reach a final concentration that was significantly lower than those of the higherpCO2
treatments (p <0.01). Experiment E2 displayed some of the largest changes in TEP concentrations over the 96 h period, increasing from the lowest initial concentration (80 µg X equiv L−1) to some of the highest (200 µg Xequiv L−1in the 750 treatment). Af-ter 96 h, final concentrations were significantly greaAf-ter in the higherpCO2 treatments, 15
with twice as much TEP produced over the incubation period in the 750 µatm treatment compared to the Ambient treatment. Stabilisation of the TEP concentration after 48 h in the 1000 µatm treatment meant that it was not statistically distinct from the 550 µatm treatment. Similarities in the treatment-dependent response of experiments E3 and E4, as observed in the environmental conditions, were also present in TEP
concentra-20
tions. After 48 h, production of TEP was higher in the lowerpCO2 treatments. At this
time point in both experiments, concentrations in the Ambient treatment were signifi-cantly greater than those in all other treatments (p <0.01), while concentrations in the 550 µatm treatments were significantly greater than those in the 1000 µatm treatment (p <0.05). Subsequently, between 48 and 96 h, concentrations in the Ambient and
25
BGD
11, 3701–3730, 2014Effect of enhanced
pCO2 levels G. A. MacGilchrist et al.
Title Page Abstract Introduction Conclusions References Tables Figures
◭ ◮
◭ ◮
Back Close Full Screen / Esc
Printer-friendly Version Interactive Discussion
Discussion
P
a
per
|
D
iscussion
P
a
per
|
Discussion
P
a
per
|
Discuss
ion
P
a
per
|
TEP showed a different treatment dependence in the two experiments: in E3, less TEP was produced overall in the 1000 µatm treatment than in the others (p <0.05), while in E4, more TEP was produced in the 750 and 1000 µatm treatments than in the Am-bient and 550 treatments (p <0.01). In E5, there was initially a treatment-dependent decrease in TEP, leading to significantly higher concentrations at lowerpCO2after 48 h 5
(p <0.05), consistent with experiments E3 and E4. Between 48 and 96 h, concentra-tions in all treatments increased at a fairly uniform rate.
Figure 4b shows the rate of TEP production/destruction (increase/decrease per day) across each time step (0 to 48 h and 0 to 96 h) against the initialpCO2conditions of that
experiment. It illustrates how the relationship varies between experiments and between
10
time steps. Between 0 and 48 h, in E3, E4 and E5, greater TEP net production (or in the case of E5, less TEP net destruction) was observed in communities subjected to lower initialpCO2. This was also the case in E1, but only between the lowestpCO2
treatment and the rest. The opposite relationship was observed in E2, in which more TEP net production occurred at the highestpCO2level. Over 96 h, correlations between 15
TEP production and initialpCO2were considerably less pronounced. Experiments E1,
E2 and E4, exhibited a positive relationship, with more net TEP production at higher initialpCO2. Experiments E3 and E5 maintained the same relationship as over the first
48 h, net production being lower at higherpCO2.
4 Discussion 20
4.1 No suggestion of strong effect ofpCO2on DOC
In the bioassay experiments, enhanced pCO2 levels did not have a pronounced
ef-fect on the production of DOC, with statistically significant differences in DOC accu-mulation between treatments being present at only 3 out of 10 time points across all experiments (Table 1). Engel et al. (2004a) and Engel et al. (2014) both found a
simi-25
BGD
11, 3701–3730, 2014Effect of enhanced
pCO2 levels G. A. MacGilchrist et al.
Title Page Abstract Introduction Conclusions References Tables Figures
◭ ◮
◭ ◮
Back Close Full Screen / Esc
Printer-friendly Version Interactive Discussion
Discussion
P
a
per
|
D
iscussion
P
a
per
|
Discussion
P
a
per
|
Discuss
ion
P
a
per
respectively and hypothesised that loss of DOC, either through bacterial degradation or coagulation to TEP, occured on time scales shorter than their measurement fre-quency meaning that treatment-dependent changes in DOC concentration could be damped out between measurements. This may also be the case in our experiments, with bulk concentration measurements at 48 and 96 h being insufficient to identify
pos-5
sible treatment-dependence of DOC production occurring on shorter time scales. Al-ternatively, the effect on DOC could just be small in comparison to the background concentration and thus difficult to detect.
On each occasion where there was a statistically significant difference between treat-ments, this was due to a higher DOC concentration in the Ambient treatment (Table 1).
10
Furthermore, Fig. 4a implies a small but negative correlation betweenpCO2and DOC in some experiments. This relationship is not consistent with recent mesocosm results in the Arctic (Engel et al., 2013). However, it agrees with the results of Yoshimura et al. (2010) and Yoshimura et al. (2013) in marginal seas around the sub-Arctic Pacific who noted that DOC accumulation was inhibited under high pCO2 conditions. Yoshimura 15
et al. (2010) suggested that this may be due to treatment-dependent changes in phy-toplankton community structure, with less diatoms at highpCO2leading to a reduced DOC production. This link was not apparent in our experiments as we rather observed the opposite shift towards larger cells (e.g. diatoms) in the phytoplankton communities of interest (Richier et al., 2014).
20
4.2 Significant but variable effect ofpCO2on TEP
The bioassay experiments showed that while TEP production was significantly affected bypCO2perturbations, the response was not consistent across experiments. The sign,
consistency and magnitude of the relationship varied depending on the region in which the experiment was carried out and the time step across which the parameters were
25
evolu-BGD
11, 3701–3730, 2014Effect of enhanced
pCO2 levels G. A. MacGilchrist et al.
Title Page Abstract Introduction Conclusions References Tables Figures
◭ ◮
◭ ◮
Back Close Full Screen / Esc
Printer-friendly Version Interactive Discussion
Discussion
P
a
per
|
D
iscussion
P
a
per
|
Discussion
P
a
per
|
Discuss
ion
P
a
per
|
tion during the experiments, strongly affected the relationship between TEP production andpCO2. Such variable relationships show that results from single experimental
lo-cations or culture experiments cannot easily be scaled to a general rule that applies equally across a diverse range of natural ecosystems.
In terms of methodology, our study is most similar to that of Engel (2002) in which
5
carbonate chemistry was manipulated in a natural phytoplankton assemblage with no nutrient addition. The study was carried out using seawater from two locations in the Baltic Sea and found that after 24 h, more TEP was produced in the higher pCO2
experiments. If we had considered only certain experiments at certain time points (e.g. E2 at 48 h, E4 at 96 h), our study could have drawn the same conclusions. However,
10
the heterogeneity of the responses we observed clearly indicated that relationships betweenpCO2and TEP production were more variable than observed by Engel (2002).
On the basis of previous studies, we hypothesised that TEP production would be en-hanced at highpCO2. We observed such a positive relationship on four occasions, but noted a negative relationship an equal number of times (Table 1). In the first instance,
15
this suggests that the conclusions drawn from previous studies do not tell the whole story when the effects are measured in natural, unamended ecosystems. To gain bet-ter understanding of the effect of pCO2 on TEP production, we must consider other
processes influencing TEP concentrations in the different environmental settings of our experiments.
20
4.3 Net growth exhibits strong control on TEP variability
Batch cultures, mesocosm experiments and in situ measurements previously all found that TEP concentrations are closely correlated to chlorophyll during phytoplankton growth (Passow, 2002). In line with this, studies investigating the effect ofpCO2on TEP production have noted that the response is closely linked to variable levels of primary
25
BGD
11, 3701–3730, 2014Effect of enhanced
pCO2 levels G. A. MacGilchrist et al.
Title Page Abstract Introduction Conclusions References Tables Figures
◭ ◮
◭ ◮
Back Close Full Screen / Esc
Printer-friendly Version Interactive Discussion
Discussion
P
a
per
|
D
iscussion
P
a
per
|
Discussion
P
a
per
|
Discuss
ion
P
a
per
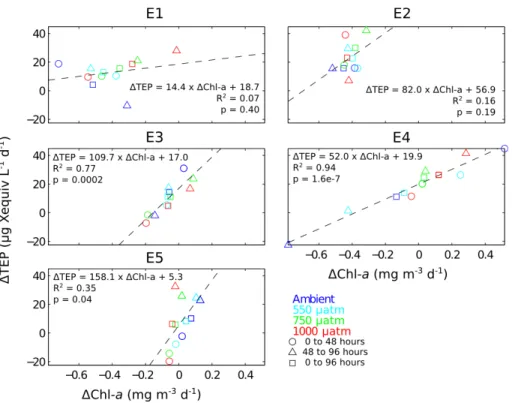
variables. A strong positive correlation was observed for experiments E3 and E4 with R2values of 0.77 and 0.94 respectively and the correlation was statistically significant in both cases (p <0.001). This suggests that as Chla increased, TEP concentrations also increased in a largely consistent manner irrespective ofpCO2treatment. The rela-tionship was maintained even when Chla concentrations decreased. The linear trend
5
did not intersect at the origin in either experiment but rather TEP production was usually positive when Chlaproduction was zero or negative. This suggests that TEP contin-ued to increase after Chlaproduction ceased. This is consistent with the suggestion by Passow (2002), that TEP continues to increase during the breakdown of a phyto-plankton bloom. There was also a statistically robust positive correlation in experiment
10
E5 (R2=0.35,p <0.05), although it was less strong than in either E3 or E4. While the relationship was also positive in E1 and E2, the correlation was not robust.
As a result of this close relationship between net growth and TEP production, we suggest that, in experiments E3, E4 and E5, the treatment dependence of TEP was due to the effect of pCO2 on net phytoplankton growth, rather than a direct effect on 15
TEP production. As noted in Sect. 3.1, growth was suppressed at higher pCO2
dur-ing the first 48 h of E3, E4 and E5. Concurrently, less TEP was produced (or in the case of E5, more TEP was destroyed) at higher pCO2 over this time period.
Subse-quently, between 48 and 96 h, nutrient availability became the dominant control on net growth in E3 and E4. Net growth was not sustained in the lowerpCO2treatments and
20
TEP concentrations decreased or stabilised accordingly, while net growth, having been previously delayed, was promoted in the higherpCO2 treatments with concurrent
de-layed production of TEP. Over the same time period in E5, net growth continued to be suppressed at high pCO2, but a clear relation to TEP production was no longer
apparent (Fig. 5). Despite this exception, we propose that it is the indirect effects of
25
pCO2through growth that causes the observed treatment-dependent response of TEP in experiments E3, E4 and E5.
BGD
11, 3701–3730, 2014Effect of enhanced
pCO2 levels G. A. MacGilchrist et al.
Title Page Abstract Introduction Conclusions References Tables Figures
◭ ◮
◭ ◮
Back Close Full Screen / Esc
Printer-friendly Version Interactive Discussion
Discussion
P
a
per
|
D
iscussion
P
a
per
|
Discussion
P
a
per
|
Discuss
ion
P
a
per
|
experiments. In an experiment examining the effect of pCO2 on TEP and DOC pro-duction byEmiliana huxleyi, Engel et al. (2004a) noted a close relationship between TEP concentration and cell abundance. They were able to normalise TEP production to account for this relationship and found a significant effect of pCO2on TEP production per cell. In the complex environment of our bioassay experiments, a similar
normal-5
isation is not trivial. We might consider howpCO2 affected the relationship between
TEP and Chl a production (e.g. perhaps more TEP was produced per unit Chl a at higher pCO2), but with only three time steps for each treatment in each experiment,
there are not sufficient data to determine whether such an effect was present. Higher temporal resolution or a longer time series could provide further insight in future
stud-10
ies. Consequently, experiments E3, E4 and E5 do not support the hypothesis that TEP production was enhanced by a direct effect of highpCO2, but rather suggest that it was
primarily the effect ofpCO2on phytoplankton growth that mediated the TEP response.
Furthermore, this mediation frequently led to the opposite effect to that hypothesised, with significantly less TEP production at higherpCO2(Table 1).
15
4.4 Environmental conditions impact thepCO2effect on TEP
The different environmental conditions of our experiments influenced the response of TEP production topCO2 perturbations. We use this to consider the effect that these conditions, namely community structure, initial nutrient concentration and the timing of measurements relative to phytoplankton growth, had on our results.
20
Experiments E3, E4 and E5 initially exhibited a consistent trend in net growth and TEP production, distinct from that of E1 and E2, despite the incubation waters being sampled from different locations and with different initial nutrient concentrations. The phytoplankton communities of these experiments were predominantly from the small size fraction, suggesting that the initial inhibited growth at highpCO2that we observed, 25
BGD
11, 3701–3730, 2014Effect of enhanced
pCO2 levels G. A. MacGilchrist et al.
Title Page Abstract Introduction Conclusions References Tables Figures
◭ ◮
◭ ◮
Back Close Full Screen / Esc
Printer-friendly Version Interactive Discussion
Discussion
P
a
per
|
D
iscussion
P
a
per
|
Discussion
P
a
per
|
Discuss
ion
P
a
per
less net growth of phytoplankton in the pico and nano size fractions at higherpCO2. This is in contrast to previous investigations, which have found that pico- and nano-phytoplankton thrive at high pCO2 (Paulino et al., 2008; Schulz et al., 2013), though
not in all species (Meakin and Wyman, 2011). Other studies have observed this pos-itive response (more growth at highpCO2) in picophytoplankton only (Newbold et al., 5
2012), while some have found the opposite response (less growth at high pCO2) in
nanophytoplankton (Engel et al., 2008). Evidently, the response to ocean acidification in these size fractions is highly variable, and dependant on species composition and environmental conditions.
While the trend in initial growth relative topCO2was consistent between experiments
10
E3, E4 and E5, the magnitude of the effect on TEP and the manner in which these experiments subsequently evolved was not. Different initial nutrient concentrations in the different experiments led to contrasting net growth over the first 48 h, from very small in nutrient depleted E5 to pronounced in nutrient replete E4. In contrast, changes in TEP over the initial 48 h of all of these experiments were of a similar magnitude,
15
ranging between∼0 and∼50 µg X equiv L−1 in each. This was most readily observed
in the relationship between TEP and Chlaproduction (Fig. 5) where the different slope gradients between experiments imply higher TEP production per unit increase in Chla in E5 than in E4, with E3 being intermediate. Thus, while the relationship between pCO2and initial growth was of the same sign between these experiments, the resultant
20
effect on the accumulation or degradation of TEP was a function of the initial availability of nutrients, with higher TEP production relative to net growth when nutrients were depleted.
The environmental conditions of E2 suggest that it was initialised in the aftermath of a phytoplankton bloom. While Chl a decreased throughout the experiment, TEP
25
BGD
11, 3701–3730, 2014Effect of enhanced
pCO2 levels G. A. MacGilchrist et al.
Title Page Abstract Introduction Conclusions References Tables Figures
◭ ◮
◭ ◮
Back Close Full Screen / Esc
Printer-friendly Version Interactive Discussion
Discussion
P
a
per
|
D
iscussion
P
a
per
|
Discussion
P
a
per
|
Discuss
ion
P
a
per
|
phytoplankton blooms; Passow, 2002) or (ii) continued generation and exudation of or-ganic carbon that, due to nutrient limitation, was not channeled into biomass (a process known as carbon overconsumption) and subsequently coagulated to TEP (e.g. Engel et al., 2002; Schartau et al., 2007). The fact that TEP concentration was significantly greater at higher pCO2 after both 48 and 96 h implies that one or both of these pro-5
cesses was enhanced at highpCO2 during the time course of the experiment (unless
the effect of high pCO2 was to inhibit TEP breakdown). Since the decrease in Chl a (i.e. the breakdown of phytoplankton biomass) was largely treatment independent and the abiotic coagulation of TEP is not affected by pCO2 (Passow, 2012), it is unlikely
that process (i) was influenced bypCO2in this experiment. On the other hand, there is
10
considerable evidence suggesting that process (ii), i.e. extracellular release due to car-bon overconsumption, is enhanced at highpCO2(Engel et al., 2004a; Riebesell et al.,
2007; Borchard and Engel, 2012). We calculated carbon overconsumption from the difference between the concurrent decreases in dissolved inorganic carbon and nitrate (applying a C : N ratio of 117 : 16; Anderson and Sarmiento, 1994). At both time points
15
more carbon was consumed than expected from the uptake of nitrate. Although an ob-vious treatment dependence was not determined, the occurrence of carbon overcon-sumption throughout this experiment suggests that process (ii) may be contributing to the treatment-dependent increase in TEP concentrations. This would suggest a direct enhancement of TEP production at highpCO2 in this experiment. The environmental
20
setting of E2 may be interpreted as mimicking post-bloom/nutrient depleted conditions in nutrient fertilised experiments (e.g. Engel et al., 2004a; Borchard and Engel, 2012; Engel et al., 2014). As in the present work, these experiments commonly showed an effect ofpCO2 following nutrient limitation. The fact that the results of E2 (in terms of
the suggestion of a direct enhancement of TEP production at highpCO2) are unique 25
BGD
11, 3701–3730, 2014Effect of enhanced
pCO2 levels G. A. MacGilchrist et al.
Title Page Abstract Introduction Conclusions References Tables Figures
◭ ◮
◭ ◮
Back Close Full Screen / Esc
Printer-friendly Version Interactive Discussion
Discussion
P
a
per
|
D
iscussion
P
a
per
|
Discussion
P
a
per
|
Discuss
ion
P
a
per
5 Conclusions
Through bioassay experiments in five different locations in northwest European shelf seas, we have considered the effect of highpCO2conditions on the production of DOC
and TEP in unamended natural ecosystems. We found no significant effect of pCO2 on the accumulation of DOC, although there was a slight suggestion of a negative
5
relationship. There was a significant but highly variable effect ofpCO2on the
accumu-lation of TEP. In three of the five experiments, this effect could be largely explained by the impact ofpCO2 on phytoplankton growth, which was positively correlated to TEP
production and which was initially inhibited at highpCO2. In only one of the five
experi-ments was there an enhancement of TEP production at highpCO2, seemingly without
10
indirect effects, possibly supporting the conclusions of previous studies.
Some of our experiments showed a similar pattern in initial responses, but the gen-erally heterogeneous relationship between TEP andpCO2 treatment implies that the variable environmental conditions of the experiments were a strong determinant of re-sponses. We found that phytoplankton community structure, initial nutrient
concentra-15
tion and the timing of measurements relative to phytoplankton growth, affect both TEP production and its treatment dependence. Consequently, the current study highlights how idealised and/or isolated experiments are likely to be insufficient for understanding the wider scale influence of ocean acidification on the production of DOC and TEP. Future experiments must consider natural communities across a range of different
ini-20
tial environmental conditions in order to better understand the wider biogeochemical response to ongoing accumulation of anthropogenic carbon in the oceans.
Acknowledgements. This work is a contribution to the UK Ocean Acidification Research Pro-gramme (UKOA) which was jointly funded by the Department for Environment, Food and Rural Affairs (DEFRA), the Natural Environment Research Council (NERC) and the Department of
25
BGD
11, 3701–3730, 2014Effect of enhanced
pCO2 levels G. A. MacGilchrist et al.
Title Page Abstract Introduction Conclusions References Tables Figures
◭ ◮
◭ ◮
Back Close Full Screen / Esc
Printer-friendly Version Interactive Discussion
Discussion
P
a
per
|
D
iscussion
P
a
per
|
Discussion
P
a
per
|
Discuss
ion
P
a
per
|
References
Anderson, L. A. and Sarmiento, J. L.: Redfield ratios of remineralization determined by nutrient data-analysis, Global Biogeochem. Cy., 8, 65–80, doi:10.1029/93GB03318, 1994. 3719 Bellerby, R. G. J., Schulz, K. G., Riebesell, U., Neill, C., Nondal, G., Heegaard, E.,
Johan-nessen, T., and Brown, K. R.: Marine ecosystem community carbon and nutrient uptake
5
stoichiometry under varying ocean acidification during the PeECE III experiment, Biogeo-sciences, 5, 1517–1527, doi:10.5194/bg-5-1517-2008, 2008. 3704
Borchard, C. and Engel, A.: Organic matter exudation byEmiliania huxleyi under simulated future ocean conditions, Biogeosciences, 9, 3405–3423, doi:10.5194/bg-9-3405-2012, 2012. 3705, 3719
10
Dafner, E. V. and Wangersky, P. J.: A brief overview of modern directions in marine DOC studies: Part II Recent progress in marine DOC studies, J. Environ. Monitor., 4, 55–69, doi:10.1039/B107279J, 2002. 3703
Dickson, A. and Millero, F.: A comparison of the equilibrium constants for the dissociation of carbonic acid in seawater media, Deep-Sea Res. Pt. I, 34, 1733–1743,
doi:10.1016/0198-15
0149(87)90021-5, 1987. 3706
Dickson, A. G., Sabine, C. L., and Christian, J. R.: Guide to best practices for ocean CO2 measurements, Tech. Rep. IOCCP report No. 8, PICES Special Publication 3, 2007. 3706 Doney, S. C., Fabry, V. J., Feely, R. A., and Kleypas, J. A.: Ocean acidification: the other CO2
problem, Annual Rev. Mar. Sci., 1, 169–192, doi:10.1146/annurev.marine.010908.163834,
20
2009. 3702
Ducklow, H. W., Steinberg, D. K., and Buesseler, K. O.: Upper ocean carbon export and the biological pump, Oceanography, 14, 50–58, 2001. 3703
Engel, A.: Direct relationship between CO2 uptake and transparent exopolymer particles pro-duction in natural phytoplankton, J. Plankton Res., 24, 49–53, doi:10.1093/plankt/24.1.49,
25
2002. 3704, 3715
Engel, A., Goldthwait, S., Passow, U., and Alldredge, A.: Temporal decoupling of carbon and nitrogen dynamics in a mesocosm diatom bloom, Limnol. Oceanogr., 47, 753–761, 2002. 3719
Engel, A., Delille, B., Jacquet, S., Riebesell, U., Rochelle-Newall, E., Terbruggen, A., and
Zon-30
BGD
11, 3701–3730, 2014Effect of enhanced
pCO2 levels G. A. MacGilchrist et al.
Title Page Abstract Introduction Conclusions References Tables Figures
◭ ◮
◭ ◮
Back Close Full Screen / Esc
Printer-friendly Version Interactive Discussion
Discussion
P
a
per
|
D
iscussion
P
a
per
|
Discussion
P
a
per
|
Discuss
ion
P
a
per
Emiliania huxleyi exposed to different CO2concentrations: a mesocosm experiment, Aquat. Microb. Ecol., 34, 93–104, doi:10.3354/ame034093, 2004a. 3704, 3713, 3715, 3717, 3719 Engel, A., Thoms, S., Riebesell, U., Rochelle-Newall, E., and Zondervan, I.: Polysaccharide
aggregation as a potential sink of marine dissolved organic carbon, Nature, 428, 929–932, doi:10.1038/nature02453, 2004b. 3703
5
Engel, A., Schulz, K. G., Riebesell, U., Bellerby, R., Delille, B., and Schartau, M.: Effects of CO2 on particle size distribution and phytoplankton abundance during a mesocosm bloom exper-iment (PeECE II), Biogeosciences, 5, 509–521, doi:10.5194/bg-5-509-2008, 2008. 3718 Engel, A., Borchard, C., Piontek, J., Schulz, K. G., Riebesell, U., and Bellerby, R.: CO2
in-creases14C primary production in an Arctic plankton community, Biogeosciences, 10, 1291–
10
1308, doi:10.5194/bg-10-1291-2013, 2013. 3704, 3714
Engel, A., Piontek, J., Grossart, H.-P., Riebesell, U., Schulz, K. G., and Sperling, M.: Impact of CO2enrichment on organic matter dynamics during nutrient induced coastal phytoplankton blooms, J. Plankton Res., doi:10.1093/plankt/fbt125, 2014. 3704, 3705, 3713, 3719
Fabry, V. J., Seibel, B. A., Feely, R. A., and Orr, J. C.: Impacts of ocean
acidifica-15
tion on marine fauna and ecosystem processes, ICES J. Mar. Sci., 65, 414–432, doi:10.1093/icesjms/fsn048, 2008. 3702
Gattuso, J. P., Lee, K., Schulz, K., and Gao, K.: Approaches and tools to manipulate the car-bonate chemistry, in: Guide to Best Practices for Ocean Acidification Research and Data Reporting, edited by: Riebesell, U., Fabry, V. J., Hansson, L., and Gattuso, J. P., Publications
20
office of the European Union, Luxembourg, 41–52, 2010. 3706
Gehlen, M., Gruber, N., Gangstø, R., Bopp, L., and Oschlies, A.: Biogeochemical conse-quences of ocean acidification and feedback to the Earth system, in: Ocean Acidification, edited by: Gattuso, J.-P. and Hansson, L., Oxford University Press, Oxford, 230–248, 2011. 3703
25
Grubbs, F.: Procedures for detecting outlying observations in samples, Technometrics, 11, 1– 21, 1969. 3708
Hansell, D. A.: Recalcitrant dissolved organic carbon fractions, Annual Rev. Mar. Sci., 5, 421– 45, 2013. 3703
Hansell, D. A., Carlson, C. A., Repeta, D. J., and Schlitzer, R.: Dissolved organic matter in the
30
ocean a controversy stimulates new insights, Oceanography, 22, 202–211, 2009. 3703 Hofmann, G. E., Barry, J. P., Edmunds, P. J., Gates, R. D., Hutchins, D. A., Klinger, T., and
ecosys-BGD
11, 3701–3730, 2014Effect of enhanced
pCO2 levels G. A. MacGilchrist et al.
Title Page Abstract Introduction Conclusions References Tables Figures
◭ ◮
◭ ◮
Back Close Full Screen / Esc
Printer-friendly Version Interactive Discussion
Discussion
P
a
per
|
D
iscussion
P
a
per
|
Discussion
P
a
per
|
Discuss
ion
P
a
per
|
tems: an organism-to-ecosystem perspective, Annu. Rev. Ecol. Evol. S., 41, 127–147, doi:10.1146/annurev.ecolsys.110308.120227, 2010. 3702
Kim, J. M., Lee, K., Shin, K., Yang, E. J., Engel, A., Karl, D. M., and Kim, H. C.: Shifts in biogenic carbon flow from particulate to dissolved forms under high carbon dioxide and warm ocean
5
conditions, Geophys. Res. Lett., 38, L08612, doi:10.1029/2011GL047346, 2011. 3704 Kirkwood, D.: Nutrients: practical notes on their determination in sea water, International
Coun-cil for the Exploration of the Sea, Copenhagen, 1996. 3707
Meakin, N. G. and Wyman, M.: Rapid shifts in picoeukaryote community structure in response to ocean acidification, ISME J., 5, 1397–405, doi:10.1038/ismej.2011.18, 2011. 3718
10
Mehrbach, C., Culberson, C. H., Hawley, J. E., and Pytkowicz, R. M.: Measurement of the ap-parent dissociation constants of carbonic acid in seawater at atmospheric pressure, Limnol. Oceanogr., 18, 897–907, doi:10.2307/2834583, 1973. 3706
Newbold, L. K., Oliver, A. E., Booth, T., Tiwari, B., DeSantis, T., Maguire, M., Andersen, G., van der Gast, C. J., and Whiteley, A. S.: The response of marine picoplankton to ocean
acid-15
ification, Environ. Microbiol., 14, 2293–2307, doi:10.1111/j.1462-2920.2012.02762.x, 2012. 3718
Passow, U.: Transparent exopolymer particles (TEP) in aquatic environments, Prog. Oceanogr., 55, 287–333, doi:10.1016/S0079-6611(02)00138-6, 2002. 3703, 3715, 3716, 3719
Passow, U.: The abiotic formation of TEP under different ocean acidification scenarios, Mar.
20
Chem., 128, 72–80, doi:10.1016/j.marchem.2011.10.004, 2012. 3719
Passow, U. and Alldredge, A. L.: A dye-binding assay for the spectrophotometric measurement of transparent exopolymer particles (TEP), Limnol. Oceanogr., 40, 1326–1335, 1995. 3708 Passow, U. and Carlson, C. A.: The biological pump in a high CO2world, Mar. Ecol.-Prog. Ser.,
470, 249–271, 2012. 3703
25
Paulino, A. I., Egge, J. K., and Larsen, A.: Effects of increased atmospheric CO2 on small and intermediate sized osmotrophs during a nutrient induced phytoplankton bloom, Biogeo-sciences, 5, 739–748, doi:10.5194/bg-5-739-2008, 2008. 3718
Pedrotti, M. L., Fiorini, S., Kerros, M.-E., Middelburg, J. J., and Gattuso, J.-P.: Variable pro-duction of transparent exopolymeric particles by haploid and diploid life stages of
coc-30
colithophores grown under different CO2 concentrations, J. Plankton Res., 34, 388–398, doi:10.1093/plankt/fbs012, 2012. 3704, 3715
ship-BGD
11, 3701–3730, 2014Effect of enhanced
pCO2 levels G. A. MacGilchrist et al.
Title Page Abstract Introduction Conclusions References Tables Figures
◭ ◮
◭ ◮
Back Close Full Screen / Esc
Printer-friendly Version Interactive Discussion
Discussion
P
a
per
|
D
iscussion
P
a
per
|
Discussion
P
a
per
|
Discuss
ion
P
a
per
board carbonate manipulation experiments around the Northwest European continental shelf, Biogeosciences Discuss., 11, 3489–3534, 2014,
http://www.biogeosciences-discuss.net/11/3489/2014/. 3706, 3709, 3714
Riebesell, U., Schulz, K. G., Bellerby, R. G. J., Botros, M., Fritsche, P., Meyerhoefer, M., Neill, C.,
5
Nondal, G., Oschlies, A., Wohlers, J., and Zoellner, E.: Enhanced biological carbon consump-tion in a high CO2 ocean, Nature, 450, 545–548, doi:10.1038/nature06267, 2007. 3703, 3704, 3719
Schartau, M., Engel, A., Schröter, J., Thoms, S., Völker, C., and Wolf-Gladrow, D.: Modelling carbon overconsumption and the formation of extracellular particulate organic carbon,
Bio-10
geosciences, 4, 433–454, doi:10.5194/bg-4-433-2007, 2007. 3719
Schulz, K. G., Bellerby, R. G. J., Brussaard, C. P. D., Büdenbender, J., Czerny, J., Engel, A., Fis-cher, M., Koch-Klavsen, S., Krug, S. A., Lischka, S., Ludwig, A., Meyerhöfer, M., Nondal, G., Silyakova, A., Stuhr, A., and Riebesell, U.: Temporal biomass dynamics of an Arctic plankton bloom in response to increasing levels of atmospheric carbon dioxide, Biogeosciences, 10,
15
161–180, doi:10.5194/bg-10-161-2013, 2013. 3718
Spyres, G., Nimmo, M., Worsfold, P. J., Achterberg, E. P., and Miller, A. E. J.: Determination of dissolved organic carbon in seawater using high temperature catalytic oxidation techniques, TRAC-Trend. Anal. Chem., 19, 498–506, doi:10.1016/S0165-9936(00)00022-4, 2000. 3707, 3708
20
Welschmeyer, N. A.: Fluorometric analysis of chlorophyllain the presence of chlorophyllband pheopigments, Limnol. Oceanogr., 39, 1985–1992, doi:10.2307/2838404, 1994. 3707 Wernberg, T., Smale, D. A., and Thomsen, M. S.: A decade of climate change experiments on
marine organisms: procedures, patterns and problems, Glob. Change Biol., 18, 1491–1498, doi:10.1111/j.1365-2486.2012.02656.x, 2012. 3703
25
Yoshimura, T., Nishioka, J., Suzuki, K., Hattori, H., Kiyosawa, H., and Watanabe, Y. W.: Impacts of elevated CO2on organic carbon dynamics in nutrient depleted Okhotsk Sea surface
wa-650
ters, J. Exp. Mar. Biol., 395, 191–198, doi:10.1016/j.jembe.2010.09.001, 2010. 3704, 3714 Yoshimura, T., Suzuki, K., Kiyosawa, H., Ono, T., Hattori, H., Kuma, K., and Nishioka, J.: Impacts
of elevated CO2on particulate and dissolved organic matter production: microcosm experi-ments using iron-deficient plankton communities in open subarctic waters, J. Oceanogr., 69, 601–618, doi:10.1007/s10872-013-0196-2, 2013. 3704, 3714
BGD
11, 3701–3730, 2014Effect of enhanced
pCO2 levels G. A. MacGilchrist et al.
Title Page Abstract Introduction Conclusions References Tables Figures
◭ ◮
◭ ◮
Back Close Full Screen / Esc
Printer-friendly Version Interactive Discussion
Discussion
P
a
per
|
D
iscussion
P
a
per
|
Discussion
P
a
per
|
Discuss
ion
P
a
per
|
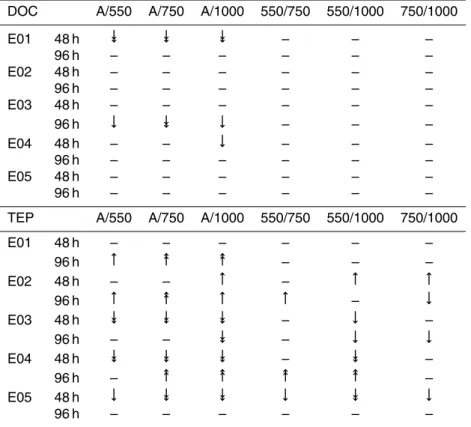
Table 1. Summary of statistically significant differences between treatments for DOC (top) and TEP (bottom). Upward pointing arrows signify a positive correlation betweenpCO2 and DOC/TEP production (more DOC/TEP in the higherpCO2 treatment) and downward pointing arrows signify a negative correlation (more DOC/TEP in the lower pCO2 treatment). Single-headed and two-Single-headed arrows signify statistical significance at the 95 % and 99 % confidence level respectively (using the Tukey–Kramer test statistic). – signifies that treatments were not significantly different at the 95 % confidence level.
DOC A/550 A/750 A/1000 550/750 550/1000 750/1000
E01 48 h և և և – – –
96 h – – – – – –
E02 48 h – – – – – –
96 h – – – – – –
E03 48 h – – – – – –
96 h ← և ← – – –
E04 48 h – – ← – – –
96 h – – – – – –
E05 48 h – – – – – –
96 h – – – – – –
TEP A/550 A/750 A/1000 550/750 550/1000 750/1000
E01 48 h – – – – – –
96 h → ։ ։ – – –
E02 48 h – – → – → →
96 h → ։ → → – ←
E03 48 h և և և – ← –
96 h – – և – ← ←
E04 48 h և և և – և –
96 h – ։ ։ ։ ։ –
E05 48 h ← և և ← և ←
BGD
11, 3701–3730, 2014Effect of enhanced
pCO2 levels G. A. MacGilchrist et al.
Title Page Abstract Introduction Conclusions References Tables Figures
◭ ◮
◭ ◮
Back Close Full Screen / Esc
Printer-friendly Version Interactive Discussion
Discussion
P
a
per
|
D
iscussion
P
a
per
|
Discussion
P
a
per
|
Discuss
ion
P
a
per
|
Fig. 2. Evolution of environmental variables in five bioassay experiments across three time points (x-axes: 0, 48 and 96 h) for allpCO2treatments:(a)nitrate (µM),(b)phosphate (µM),(c)
small size fraction (<10 µm) chlorophylla(mg m−3),(d)large size fraction (>10 µm) chlorophyll
a(mg m−3
) and(e)total concentration of chlorophylla(mg m−3
BGD
11, 3701–3730, 2014Effect of enhanced
pCO2 levels G. A. MacGilchrist et al.
Title Page Abstract Introduction Conclusions References Tables Figures
◭ ◮
◭ ◮
Back Close Full Screen / Esc
Printer-friendly Version Interactive Discussion
Discussion
P
a
per
|
D
iscussion
P
a
per
|
Discussion
P
a
per
|
Discuss
ion
P
a
per
|
Fig. 4.Relationship between the initialpCO2 of each experiment (actual values) and the pro-duction per day of(a)dissolved organic carbon (∆DOC; µM d−1