www.biogeosciences.net/10/483/2013/ doi:10.5194/bg-10-483-2013
© Author(s) 2013. CC Attribution 3.0 License.
Biogeosciences
Emissions of BVOC from lodgepole pine in response to mountain
pine beetle attack in high and low mortality forest stands
T. R. Duhl1, D. Gochis2, A. Guenther1, S. Ferrenberg3, and E. Pendall4
1Atmospheric Chemistry Division, National Center for Atmospheric Research, Boulder, CO 80307, USA 2Research Applications Laboratory, National Center for Atmospheric Research, Boulder, CO 80307, USA 3Department of Ecology & Evolutionary Biology, University of Colorado, Boulder, CO 80309, USA 4Program in Ecology, University of Wyoming, Laramie, WY 82071, USA
Correspondence to:T. R. Duhl ([email protected])
Received: 12 May 2012 – Published in Biogeosciences Discuss.: 24 July 2012
Revised: 12 December 2012 – Accepted: 19 December 2012 – Published: 25 January 2013
Abstract.In this screening study, biogenic volatile organic compound (BVOC) emissions from intact branches of lodge-pole pine (Pinus contorta) trees were measured from trees at two forested sites that have been impacted differently by the mountain pine beetle (MPB), with one having higher mortality and the other with lower mortality. Differences in the amounts and chemical diversity of BVOC between the two sites and from apparently healthy trees versus trees in different stages of MPB attack are presented, as well as (for one site) observed seasonal variability in emissions. A brief comparison is made of geological and climatic char-acteristics as well as prior disturbances (both natural and man-made) at each site. Trees sampled at the site experi-encing high MPB-related tree mortality had lower chemodi-versity in terms of monoterpene (MT) emission profiles, while profiles were more diverse at the lower-mortality site. Also at the higher-mortality site, MPB-infested trees in var-ious stages of decline had lower emissions of sesquiter-penes (SQTs) compared to healthy trees, while at the site with lower mortality, MPB-survivors had significantly higher SQT emissions during part of the growing season when com-pared to both uninfested and newly infested trees. SQT pro-files differed between the two sites and, like monoterpene and oxygenated VOC profiles, varied through the season. For the low-mortality site in which repeated measurements were made over the course of the early summer–late fall, higher chemical diversity was observed in early- compared to late-season measurements for all compound classes inves-tigated (MT, oxygenated VOC, and SQT), with the amount of change appearing to correlate to the MPB status of the
trees studied. Emissions of 2-methyl-3-buten-2-ol (MBO) had a distinct seasonal signal but were not much different between healthy or infested trees, except in trees with dead needles, from which emissions of this compound were negli-gible, and in late-season MPB survivors, in which they were higher than in newly infested or uninfested trees. Emissions of SQT were significantly higher in the MPB survivors dur-ing both mid- and late-season sampldur-ing at the low-mortality site. The changes in emissions could have implications for regional air quality and climate through changes in ozone and aerosol distributions, although this study was designed as a preliminary screening effort and not enough individuals were sampled for all of the observed differences to be statisti-cally demonstrated. Despite this, the compelling differences in emissions observed between the sites and individual trees with differing MPB-infestation statuses and the potential im-pacts these have on regional atmospheric chemistry argue for further research in this topic.
1 Introduction
in many parts of the afflicted areas have made trees less fit to ward off MPB attack (Allen et al., 2010; Breshears et al., 2005). Warmer temperatures experienced in recent decades over much of the region have resulted in fewer beetle kill events, which usually occur during early and late freezes, as it is during these times when the insects are in their most vul-nerable developmental stages (Raffa et al., 2008; Robbins, 2010). Milder temperatures have also created longer grow-ing seasons, which may have allowed more than one genera-tion of MPB to propagate each year (Mitton and Ferrenberg, 2012). Mature forests are also known to be more vulnerable to MPB, while varying forest management strategies (clear-cutting, thinning, fire suppression, etc.) may also heighten vulnerabilities (e.g., Pendall et al., 2010; USDA Forest Ser-vice, 2011).
There are numerous potential ramifications associated with the large-scale die-off of forests in western North America, including forests becoming a source, rather than a sink for carbon (Kurz et al., 2008), loss of species habitat, changes in local land–atmosphere exchanges (Wiedinmyer et al., 2012), increased fire susceptibility from dead and dy-ing timber stands, changes in snowpack and water quality, threats to critical water supplies, etc. (Clow et al., 2011; Pugh and Small, 2012). Edburg et al. (2012) have hypothesized a chronological sequence of impacts as a cascade of ecological changes of which biogenic emissions may be an important outcome.
Terrestrial vegetation, particularly forests, is a major source of reactive biogenic volatile organic compounds (BVOCs) to the atmosphere. These emissions influence at-mospheric oxidant chemistry and contribute to secondary aerosol formation, thus playing a role in both climate and air quality. Insect herbivory triggers changes in both the quanti-ties and compositions of BVOC emissions from many types of vegetation. MPBs identify and select suitable host trees via olfactory cues from trees, including some particular BVOC emissions (Seybold et al., 2006). Although MPB attacks sev-eral pine species, lodgepole pine (Pinus contorta) is its main target (Powell and Raffa, 2011). Endophytic pine bark bee-tles such as MPB are thought to fly mainly within the stem height of potential host trees (Safranyik et al., 2010; Sey-bold et al., 2006), and thus many ecologically driven stud-ies have focused on emissions of volatiles (mainly monoter-penes) associated with boles in tree trunks (e.g., Billings et al., 1976; Gara et al., 1993; Pettersson, 2001). A less under-stood consequence of infestation is its effects on branch-level chemical emissions from afflicted trees, which emit various compound classes in addition to monoterpenes (such as 2-methyl-3-buten-2-ol, oxygenated compounds and sesquiter-penes), and could have substantial implications for regional atmospheric chemistry.
The objectives of the current study were two-fold. First, branch-level BVOC emissions were screened in two lodge-pole pine forest locations that have been impacted differ-ently by the MPB: one with high lodgepole mortality (up
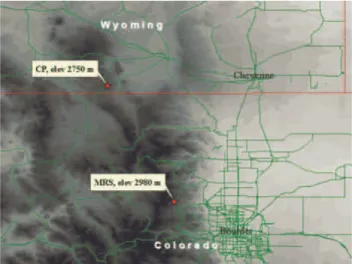
Fig. 1.Location of the Chimney Park and Mountain Research Sta-tion sampling sites
to 70 %, which is typical over much of the western Rocky Mountains) and another in which die-off from MPB has been much lower (<5 %). The second objective was to character-ize the seasonal variability among healthy, uninfested trees, and from trees in varying stages of MPB attack at one of the sites. The BVOC emission measurements described in this paper were performed at two lodgepole pine-dominated for-est sites: Chimney Park (CP), Wyoming and the University of Colorado Mountain Research Station (MRS). The study was performed as a preliminary screening effort to determine whether site-specific and/or infestation status-related differ-ences in branch-level BVOC emissions were compelling enough to affect fluxes of these compounds to the atmosphere and thus warrant further inquiry and measurements at the sites.
2 Methods
Table 1.Descriptions of trees sampled at CP and MRS, site characteristics, summary of site disturbance and management histories, and hydrological/climatic characteristics of CP and MRS sampling sites. precip.=precipitation; avg.=average;T=temperature, P.T.C.=pitch tube count.
Site Tree classes sampled, Site characteristics, management and disturbance histories, Site hydrological and climatic tree codes for each avg. P.T.C. for infested trees (m−2) and soil families characteristics
tree sampled in class
CP Un-infested apparently CP tree stands vary in density and basal area (Table 2), Avg. annual precip.: 435 mm healthy, LG1, LG2, LG3 reflecting differences in natural regeneration since the last (≥2/3 falls as snow). In the 5- and CP Infested 1–3 yr prior to major disturbances that occurred in the area (early 20th 10-yr periods prior to the
sampling, green needles, century), including logging, stand-replacing fire, and (more sampling year (2010), CP BG1, BG2, BG3 recently) management activities (thinning and harvest). Since received an avg. of 106 % and CP Infested 1–3 yr prior to ∼2007, CP has seen rather intense infestation by the MPB, 110 % of normal precip., with sampling and in decline resulting in as much as 70 % tree mortality in some of the punctuated deficits in annual (red needles), BR1, BR2 stands. Avg. P.T.C.: 87 (BG) 60, (BR). Soils are mainly Typic precip. (e.g., 81 % of avg. in 2002).
Cryocrepts–Typic Cryoboralfs (Knight, 1991). Avg. annual temp: 1◦C. MRS Un-infested trees used as The trees growing in and around MRS have not been Avg. annual precip.: 730 mm
controls, CT1, CT2 extensively managed since widespread cutting that continued (≥2/3 falls as snow). In the 5- and MRS Apparently un-infested throughout the 1800s until∼1910. Large-scale wildfires are 10-yr periods prior to the
trees sampled before MPB rare in lodgepole forests near the MRS over the past 300–400 yr sampling year (2011), MRS baiting, BB1, BB2 (Sibold et al., 2006). Episodic MPB outbreaks have been received an average of 99 % of MRS BB trees (from above) recorded for nearby forests in the 1930s and 1970s (Sibold et normal precipitation (during
sampled after MPB baiting al., 2007), with the most recent infestations at the MRS both periods), with punctuated and subsequent infestation, beginning in 2007. Lodgepole mortality among naturally deficits in annual precipitation AB1, AB2 infested trees is<5 %, but much higher (>40 %) in limber pines. (e.g., 78 % of avg. in 2002). MRS Trees infested 1–3 yr P.T.C.: 51.8 (baited), 97.2 (naturally infested). Soils are mainly Avg. annual temp: 1.6◦C.
prior to sampling with no typic cryocrepts with typic cryoboralfs also present (Veblen sign of decline, OB1, OB2 and Donnegan, 2005; Birkeland et al., 2003).
with the help of coauthors with expert site-specific knowl-edge of the local MPB dynamics and history. MPB infesta-tion was determined by looking for visual indicainfesta-tions of in-festation, including bore-holes, boring dust on bark crevices or at the base of trees, missing patches of bark, red needles, and/or any other visually apparent signs of infestation or dis-tress. Mature trees with a minimum diameter at breast height (DBH) of 15 cm were selected for sampling. The sampling design was as follows: each day, three branch enclosures (de-scribed later) were sampled, one from each of the sample classes, with three individuals from each group selected for sampling.
2.1 Chimney Park site description and sampling design
Chimney Park (∼41◦04′N, 106◦07′W, elev. ∼2750 m a.s.l.), located in southern Wyoming, USA (Fig. 1) in the Medicine Bow National Forest, is a forested landscape dom-inated by lodgepole pine (Pinus contorta) and has a long his-tory of experimental research dating back to the 1970s. At the time of the sampling visit, there were six stands within CP actively being used for experimental purposes. Trees grow-ing in or near four of these stands were selected for samplgrow-ing for this study (Table 2).
Measurements at CP were made from 15–17 Septem-ber 2010. The enclosures for each day were generally in-stalled on three trees growing as near as possible to each
other (Table 2), although it was not always feasible to find a tree from each sampling category growing in the same stand. Due to pump failure on day three, no BR enclosure was in-stalled.
2.2 Mountain Research Station site description and sampling design
Table 2.Stand characteristics for trees sampled at CP (September 2010) and MRS (June–September 2011) and meteorological conditions during sampling. PAR is expressed in units of µmol s−1m−2; ambient temperatures (amb.T) are expressed as◦C.
Tree code(s) Characteristics of stand containing Avg. distance (m) between Sampling dates and meteorological
sampled trees trees sampled at site conditions during sampling
(CP) LG1 Regenerating stand containing almost exclusively 35 m from BG1, 140 m LG trees (i.e., little or no MPB infestation). Stand from BR1,∼150 m from tree age range: 25–30 yr. Avg. stand DBH: 4 cm LG2, BG2, and BR2; 335 m
(DBH of LG1∼10 cm); avg. stem density: 8670 ha−1. from LG3, 445 m from BG3. 15 Sep (CP) BG1 Located in stand surrounding LG1 stand,>70 % of 155 m from BR1,∼185 m
trees infested by MPB (starting in 2008–2009). from LG2, BG2, and BR2, 370 m PAR: 140–1650, corresponding with Age range: 40–80 yr, DBH of BG1:∼15 cm, avg. from LG3, 475 m changing full sun/partial cloud stem density unknown but likely 1000–2000 ha−1 from BG3. conditions, amb.T: 15–26 (CP) BR1 Age unknown (but probably 40–60 yr), Avg. DBH: ∼185 m from LG2, BG2,
20 cm (DBH of BR1:∼15 cm); avg. stem density: and BR2; 475 m from BG3. 1160 ha−1.
(CP) LG2, BG2, BR2 Managed (thinned) stand. Infested by MPB in avg. distance between LG2, 16 Sep ∼2009., avg. DBH: 14 cm; avg. stem density: BG2, and BR2: 23 m PAR: 46–770, partly cloudy
2250 ha−1 to mostly sunny, amb.T: 17–26
(CP) BG3 Most heavily infested stand sampled (site of ∼300 m from LG2, BG2,
earliest outbreak at CP starting in∼2007). and BR2 17 Sep
Mostly sparsely distributed BR trees. Age≥80 yr,
avg. DBH: 25 cm, avg. stem density: 730 ha−1. PAR: 90–1070, partly cloudy to (CP) LG3 Age unknown (but probably 50–70 yr), DBH 120 m from BG3 mostly sunny, amb.T: 19–26
of LG3:∼18 cm; stem density unknown.
(MRS) all trees Avg. DBH=23 cm, avg. stem density=1500 ha−1. all MRS trees were growing 30 Jun–1 Jul: PAR, 40–2110; Age distribution is roughly normal with a narrow within 40 m of each other amb.T, 14–25, mostly cloudy
age span of∼130 yr (Knowles and Grant, 1983). to mostly sunny.
Infection by dwarf mistletoe 7–8 Aug: PAR, 70–2250; amb.T,
(Arceuthobium americanum) is common among 20–26, full sun to mostly sunny. MRS lodgepole pines, but does not appear to 17–18 Sep: PAR, 135–1600, amb.T, significantly affect tree mortality following MPB 9–15◦C, mostly cloudy to
attack (Ferrenberg, unpublished data). mostly sunny.
small-scale experimental manipulation study that uses com-mercially available pheromones to attract MPB to specified host trees (Mitton and Ferrenberg, 2012). It is these experi-mentally baited trees (along with several unbaited trees) that were sampled at MRS.
The sampling approach taken at MRS was different than that at CP. We had the unique opportunity to sample trees before and after they were infested with MPB, thanks to the tree-baiting experiment fully described by Mitton and Fer-renberg (2012). The objective of the MPB baiting experiment was to ensure MPB attacks for documenting MPB flight sea-sons and generation times between limber and lodgepole pine hosts. Pine trees used in the experiment were selected be-cause they were mature canopy or sub-canopy trees (>20 cm DBH) and had no evidence of prior MPB attacks. The tim-ing of baittim-ing with MPB aggregation pheromone coincided with the 2011 peak flight of MPB at the MRS (Ferrenberg and Mitton, unpublished data).
We planned three 2-day sampling visits to the MRS site from summer to early fall of 2011: 30 June–1 July, 7–8 Au-gust and 17–18 September. The first sampling visit was cho-sen to be at a time before MPBs were observed to be flying in the area but after temperatures had warmed up enough to allow the trees to become active in terms of BVOC
emis-sions (generally, this occurs in late May–early June; how-ever, the summer of 2011 was rather cold and rainy, so the pre-baiting measurements were conducted 30 June–1 July). The second visit (7–8 August) was timed to occur just after baiting and close to the week of peak beetle flight in the area, and the third (and final) visit to the site was performed on 17–18 September. This time period was chosen to be close to the same time of year that sampling at CP was performed (for comparison purposes).
2.3 Sampling methods
Branch enclosures at both sites consisted of custom-made Tedlar bags, each of which contained a 1/8′′PTFE/stainless
(KNF, type UNMP830KNDC, Neuberger Inc., Trenton, NJ, USA) powered by a rechargeable 12 V, 9 Ah sealed battery (WKA12-9F2, Werker, China). The purge air supply pump and battery were placed inside a plastic bin to protect against water intrusion in the case of inclement weather. The pump storage bin was located on the ground at the base of the tree being sampled, except in the case of one CP tree, on which the selected sampling branch (the lowest accessible branch on the tree) was high enough above ground (∼3.7 m) that the pump enclosure was placed on a ladder. This was done to minimize the length of the enclosure purge air supply line, as it was determined that the length of this line inversely af-fected the air flow delivery rate of the pump.
The inlet to the pump was fitted with an activated charcoal-filled glass tube (ORBO-32, Supelco, Bellefonte, PA, USA) to scrub the inlet air of ambient VOC and oxidants. One in-let sample was collected at some point in between sample collection at each enclosure, to ensure that ambient VOCs were not influencing the sampled enclosure air. For each quantified and speciated BVOC found in enclosure samples, the reported emission rate of the compound was reduced by the inlet concentration (if detected) from the enclosure in-let sample. For most enclosures and compounds, inin-let con-centrations were much lower than 1 % of concon-centrations ob-served exiting the enclosures. The enclosures were installed on the branches∼16–18 h prior to the start of sampling, in order to allow any installation-induced emission bursts to subside and to give the enclosure time to equilibrate prior to sampling. As samples were generally collected starting near 12:00 local time, enclosures were installed during the late afternoon/evening of the previous day. Prior to sampling each day, the charcoal inlet scrubber was removed and re-placed, and the battery powering the enclosure purge pump was changed.
Temperature inside of the enclosure was measured using either a thermocouple (type K, OMEGA Engineering, Inc., Stamford, CT, USA) or a HOBO temperature sensor (TM6-HE, Onset, Cape Cod, MA, USA). The temperature sensors were fed into the enclosure bag along the base of the branch and shielded from direct solar radiation. Photosynthetically active radiation (PAR) outside of (but next to) the branch enclosure was measured using Quantum sensors (using ei-ther LI-190, LI-COR Environmental, Lincoln, NE, USA or Apogee SQ-110, Apogee Instruments, Logan, UT, USA). The PAR sensors were mounted onto a leveled tripod at the same height as the branch being measured. Temperature and light data were logged using HOBO data loggers (model No. U12-014, H08-004-02, or H08-006-04, Onset, Cape Cod, MA, USA). The HOBO data loggers were evaluated indoors prior to deployment and were compared with real-time ther-mocouple temperature readings; temperature responses were within 0.5◦C between each of the sensors/loggers.
Branch enclosure outlet and inlet air samples were col-lected onto stainless steel cartridges filled with adsorbent. The two-stage cartridges were either custom-filled in-house
with a mixture of ∼150 mg of Tenax TA (60/80 mesh, Buchem BV, Apeldoorn, the Netherlands) and ∼170 mg Carbotrap (20/40 mesh, Sigma-Aldrich Co. LLC, St. Louis, MO, USA) or purchased pre-filled with ∼350 mg of Tenax GR (35/60 mesh) and Carbograph 5TD (40/60 mesh; Markes International, Llantrisant, RCT, UK). Samples were collected using custom-made, mass-flow–controlled pumps designed and built in-house. Sampling rates varied from 150– 200 mL min−1, and samples were collected for 30 min.
After sampling was completed, the sampled branches were harvested, dried in a ∼60◦C oven for 48 h, and weighed (both for needle and non-needle biomass). At MRS, re-peated measurements were made on dedicated branches from the selected trees during each visit, rather than on differ-ent branches. Since emission rates are generally expressed as a function of dry biomass weight, several pictures of each branch were taken at the beginning of sampling in late May to confirm whether any branches had lost needles or twigs over the course of the campaign. None of the branches experienced detectable loss of needles or twigs during the campaign, but, by the third sampling period, many of the branches had dead or dying needles, and when enclosures were installed during this last visit, care was taken to pre-serve these needles on the branches (or at least keep them in-side of the enclosure bags). During the second and third sam-pling periods, the number of yellowing and/or completely red needles was recorded for each branch. Final emission rate calculations were made after harvesting and drying the branches (after the final round of sampling) and calculat-ing the expected live biomass dry weight for each of the sample periods.
It is well-known that pine trees shed needles each year and re-grow new needles; this behavior can affect the cal-culated emission rates for the trees sampled at MRS dur-ing June–July and durdur-ing August, since the needles sampled from trees during these measurement periods were not har-vested and weighed until after the collection of the Septem-ber samples. Needle longevity among lodgepole pines grow-ing at elevations comparable to that of the MRS site was shown to vary between approximately 10–13 yr (correspond-ing to an average annual loss rate of ∼8–10 % per year), while new foliar growth among lodgepole pine (expressed as annual incremental change in foliated shoot length) was found to be∼6–7 % (Schoettle, 1990). The MRS study took place over a period of∼11 weeks, while the estimates of new foliar growth provided by Schoettle (1990) are based on annual changes (although most new foliar growth would be expected to occur at high-altitude sites such as MRS between
branch enclosure-based sampling are directed to Ortega and Helmig (2008).
2.4 Analytical methods
Air sampling cartridges were thermally desorbed using an Ultra autosampler (Series 2, model ULTRA TD, Markes In-ternational, Llantrisant, RCT, UK), and analytes were then cryo-focused onto a Unity thermal desorber (Markes Inter-national, Llantrisant, RCT, UK) operated in splitless mode. The samples were subsequently injected into a gas chromato-graph (GC; model 7890A, Agilent Technologies, Inc., Santa Clara, CA, USA). Flow path temperatures within the Ultra-Unity were maintained at 175◦C. The GC was equipped with a flame ionization detector (FID) and a mass-selective detector (MSD; 5975C inert MSD, Agilent Technologies, Inc., Santa Clara, CA, USA), and had an HP-5MS column (30 m×0.25 mm, 0.25 µm, Agilent Technologies, Inc., Santa Clara, CA, USA), using nitrogen as a carrier gas.
The MSD was run simultaneously in both SIM and SCAN modes, allowing detection of both routinely observed compounds as well as those less frequently found. Com-pounds detected in samples taken during the 2010 Chim-ney Park campaign were quantified using the FID along with an external gas-phase standard containing 71 ppbV iso-prene and 48 ppbV camphene. In cases where analytes could not be quantified using the FID signal, the relative SIM-or SCAN-mode MSD response of the target ion fSIM-or the compound was quantified relative to the response for the same (or similar) ion quantified in the external standard. The GC oven heating program used in the analysis of the Chimney Park samples was as follows: start temperature, 35◦C; hold time, 1 min; Ramp 1, 6◦C min−1→80◦C (no hold time); Ramp 2, 3◦C min−1→155◦C (no hold time); Ramp 3, 10◦C min−1→190◦C (no hold time); Ramp 4, 25◦C min−1→260◦C; final hold time 5.2 min (total run time, 45 min).
For samples analyzed during the 2011 MRS Ridge cam-paign, quantifications were performed using the FID and a gas-phase external standard containing 165 ppbV isoprene and 71 ppbV camphene. Additionally, for samples collected in 2011, an internal standard consisting of ∼1 ppm e-decahydronaphthalene was added to each sample analyzed. The GC oven temperature ramping program used for the analysis of the MRS samples was as follows: start tempera-ture,−30◦C; hold time, 1 min; Ramp 1, 20◦C min−1→0◦C
(no hold time); Ramp 2, 6◦C min−1→80◦C (no hold time), Ramp 3, 3◦C min−1→190◦C (no hold time), Ramp 4, 30◦C min−1→260◦C; final hold time 5.9 min (total run time, 60.7 min).
Blank samples were also analyzed for each day of the sampling campaign; both opened and unopened blanks were analyzed to determine potential contributions to detected analytes from background concentrations or sample han-dling and storage activities. For any compounds detected in
the samples that were also found in blanks, the maximum amount of analyte detected in the blank was subtracted from the enclosure samples for that day. For most compounds in-vestigated, an analytical precision of ±3 % was estimated based on repeated analyses of gas-phase standards, while ac-curacies of quantitative emission results reported using SIM ion quantitation are estimated at±15 %. There is an uncer-tainty of∼30 % associated with reported OVOC ERs (emis-sion rates) and speciation profiles.
2.5 Emission rate calculation and statistical methods
ERs and ratio analyses (i.e., the contribution to each com-pound class by individual comcom-pounds) are presented for three or four groups of compounds/compound classes (depending on the site): 2-methyl-3-buten-2-ol (MBO), monoterpenes (MTs), sesquiterpenes (SQTs), and oxygenated volatile or-ganic compounds (OVOCs, results available for MRS site only). For all compounds, we report ranges of observed ERs and, if appropriate, results from linear regressions. For MT and SQT, basal emission rates (BERs, i.e., emissions normal-ized to standard conditions of 30◦C) and corresponding stan-dard deviations are reported, though it should be noted that there was substantial variability in enclosure temperatures and emissions observed during the study, and the expected exponential relationships between MT and/or SQT emis-sions and temperature were frequently not observed. BERs were calculated using Eq. (5) from Guenther et al. (1993): BER=ERT/(exp[β(T-Ts)]), where ERT =ER observed at
temperatureT, Ts=30◦C, andβ=0.1 for MT (Guenther et
al., 1993) and 0.15 for SQT (Duhl et al., 2008). For MBO and OVOC, average ERs and associated standard deviations are reported instead of BERs. All ERs and BERs reported in the text are in units of µg C g−dw1h−1.
Two-sample t-tests were used to verify whether observed differences in total MT BER and SQT BER were significant between individual trees and/or sampling classes (depend-ing on the site and number of samples/individuals screened). Prior to running the t-tests, F-tests were performed on each variable tested. When the results of the F-tests indicated that variance was not significantly different (forα=0.01), vari-ances were pooled for the t-test calculations. Statistical tests were not performed for MBO or other OVOC emissions due to the lack of well-constrained techniques to normalize these emissions to account for light and temperature effects.
K-means cluster analysis of September MT profiles was applied to the live trees at both CP (ie., LG and BG trees,
B¨ack et al. (2012). The sum of squared error (SSE) for every possible selected cluster solution was tested against the SSE using 250 randomized versions of the original input data. The SSE of strong cluster solutions would be expected to decrease more quickly than the randomized SSE solutions as the number of clusters increases. Principal component anal-yses (PCAs) were also performed for the selected cluster so-lutions and the clusters plotted based on the PCA results for the first two principal components. Strong clusters would be expected to have good structure and little or no overlap in the PCA plot space.
3 Results
3.1 Chimney Park, WY, results
During the course of the three-day sampling campaign, a to-tal of 29 enclosure samples and 7 inlet samples were col-lected. However, it was discovered that 9 of the cartridges used during the CP sampling campaign had damaged ad-sorbent materials and the results from these cartridges were therefore excluded from analysis. Despite this loss of data, several qualitative differences in absolute emission rates emerged between the various studied groups for two of the compound classes observed (MBO and SQT).
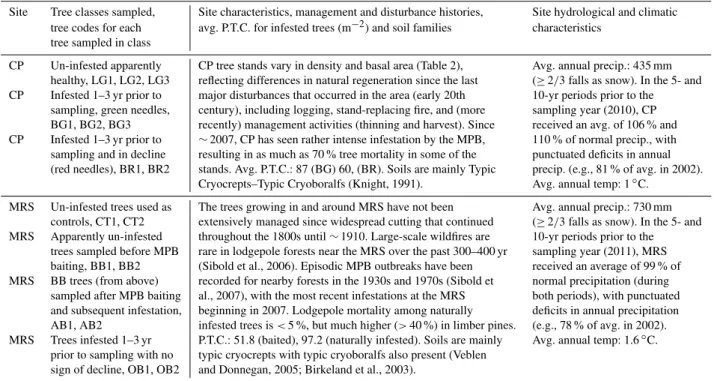
The BR trees emitted negligible amounts of MBO (Ta-ble 3), which is predicta(Ta-ble given the fact that these nee-dles appeared to be dead and MBO is known to be synthe-sized de novo, largely as a function of photosynthesis (e.g., Gray et al., 2003). There were no obvious class-related dif-ferences in MBO or MT emissions among the BG and LG trees (Table 6). BR1, BG3, and LG3 had the highest average MT BERs (4.15, 2.13, 1.36, respectively), while the other five trees had average BERs ranging from 0.35–0.54. The high emissions observed in BR1 could reflect the fact that, as the needles (and/or twig biomass) on this branch were dead, emissions could have been caused by simple evapo-ration of stored MT from pools in the tissues of this branch, or release of MT caused by needle/twig rupture during enclo-sure installation. The BG and BR trees had lower SQT ERs and BERs than the LG trees, even those LG branches that were subjected to comparable (or even lower) branch enclo-sure temperatures to their BG or BR counterparts (Fig. 2, Ta-ble 3). The LG trees emitted a significantly higher fraction of SQT than the BG trees (Table 6) and had significantly higher SQT BERs than the BG trees, although this relationship was weaker.
Although the total amounts of MT emitted from the var-ious branches studied at CP varied quite a lot from indi-vidual to indiindi-vidual, the ratios of these compounds emitted by individual branches were remarkably similar among the LG and BG individuals sampled (Table 4), with β-pinene always comprising the largest component of emissions, fol-lowed byα-pinene and/orβ-phellandrene (and in one case,
Fig. 2.SQT emissions observed at Chimney Park, WY, during mid-September, 2010.
3-carene). The BR trees differed somewhat in the composi-tion of their MTs, with 3-carene being dominant followed byβ-pinene and/orβ-phellandrene. Within-tree variation in MT composition was very low across the samples, except for the third sample collected from enclosure LG1 (which had experienced substantial heat stress, with enclosure tempera-tures averaging∼14.6◦C above ambient temperatures over
the course of the second and third sample collection peri-ods). Only the first two samples from LG1 were included in the average shown for this tree in Table 3, since the MT ra-tios were very similar between these two samples. The third sample collected from LG1 (after∼3.5 h of nearly continu-ous heat stress on the branch) exhibited a∼10 % reduction in the contribution from 3-carene (compared with the first sam-ple collected), the appearance of∼5 % z-β-ocimene (which was not found in any other sample collected during the cam-paign and may be produced in response to stress), and small changes in the other MTs detected. Although the MT ratios for LG1 changed over the course of sampling (presumably in response to heat stress), the SQT ratios remained more or less unchanged despite the heat stress.
Table 3. ER and temperature (T) ranges observed during the CP and MRS sampling visits; results are grouped according to com-pound/compound class and (when appropriate) sample class. Avg. basal ERs (BER) and corresponding standard deviations (σ) are presented for MT and SQT; avg. ER and standard deviations are reported for MBO and OVOC.
Site Sampling dates Tree(s) or Cmpd. or ER range Trange Avg. BER (σ) if MT or SQT, tree class(es) cmpd. class (µgC g−dw1h−1) (◦C) of avg. ER (σ) if MBO
enclosures or OVOC (µgC g−dw1hr−1) CP 15–17 Sep 2010 LG, BG MBO 0–5.38 18.3–35.8 1.16 (1.43) CP 15–17 Sep 2010 BR MBO 0–0.001 16.4–20.0 0.0007 (0.0005) CP 15–17 Sep 2010 all MT 0.08–1.97 16.4–35.8 1.16 (1.47) CP 15–17 Sep 2010 LG SQT 0.037–0.235 20.4–35.8 0.165 (0.071) CP 15–17 Sep 2010 BG SQT 0.001–0.060 18.3–25.0 0.045 (0.061) CP 15–17 Sep 2010 BR SQT 0.001–0.015 16.4–20.0 0.038 (0.038) MRS 30 Jun–1 Jul 2011 Alla MBO 0.37–13.25 14.2–33.0 4.71 (3.36) MRS 7–8 Aug 2011 Allb MBO 1.29–19.09 22.9–39.7 8.43 (5.61)d MRS 17–18 Sep 2011 AB1b, OB1 MBO 0.43–0.96 10.5–13.4 0.69 (0.25) MRS 17–18 Sep 2011 OB2, CT2 MBO 0.37–2.25 15.9–24.0 0.90 (0.69) MRS 17–18 Sep 2011 AB1, AB2, CT1 MBO 0.03–0.11 12.0–15.7 0.07 (0.03) MRS 30 Jun–1 Jul 2011 All except CT1 MT 0.05–4.57 14.2–33.0 1.30 (1.26) MRS 30 June–1 Jul 2011 CT1 MT 2.97–11.43 18.9–24.4 15.67 (5.88)c MRS 7–8 Aug 2011 OB, CT MT 0.17–1.69 22.9–36.6 0.83 (0.32)d MRS 7–8 Aug 2011 AB MT 0.12–1.42 26.0–39.7 0.40 (0.14)d MRS 17–18 Sep 2011 All, MT 0.01–0.67 12.0–24.0 0.36 (0.32)
except OB1 and AB1b
MRS 17–18 Sep 2011 OB1 MT 0.79–0.92 10.5–12.6 5.41 (0.15) MRS 17–18 Sep 2011 AB1b MT 0.10–0.23 11.4–13.4 0.94 (0.40) MRS 30 Jun–1 Jul 2011 All, SQT 0.004–0.090 14.2–33.0 0.073 (0.044)
except OB2 and CT1
MRS 30 Jun–1 Jul 2011 OB2 and CT1 SQT 0.157–0.340 18.9–26.2 0.707 (0.172) MRS 7–8 Aug 2011 OB SQT 0.322–0.992 25.2–33.8 0.932 (0.312) MRS 7–8 Aug 2011 AB and CT SQT 0.157–0.760 22.9–39.7 0.260 (0.183)d MRS 17–18 Sep 2011 OB SQT 0.028–0.151 10.5–24.0 0.434 (0.098) MRS 17–18 Sep 2011 AB and CT SQT 0–0.013 11.4–18.0 0.019 (0.023) MRS 30 Jun–1 Jul 2011 all OVOC 0.008–0.458 14.2–33.0 0.165 (0.139) MRS 7–8 Aug 2011 all except AB2 OVOC 0.023–0.439 22.9–39.7 0.161 (0.102) MRS 7–8 Aug 2011 AB2 OVOC 0.590–3.139 26.0–38.5 1.908 (1.277) MRS 15–17 Sep 2010 CT1, AB OVOC 0–0.0004 11.4–15.7 0.0001 (0.0001) MRS 15–17 Sep 2010 CT2, OB2 OVOC 0.001–0.008 15.9–24.0 0.003 (0.002) MRS 15–17 Sep 2010 OB1 OVOC 0.007–0.009 10.5–12.6 0.008 (0.001)
a1 sample from pre-bait 2 was excluded from the reported average ERs (MBO ER=29.2;T=28.2, PAR=1319 µmol s−1m−2). b1 sample from pre-bait 2 was excluded from the reported ERs (MBO ER=27.6;T=29.0, PAR=889 µmol s−1m−2). cEmissions from tree CT1 may be influenced by unknown pathogen (see Discussion, Sect. 4).
dAugust emissions from post-baiting (AB) and control (CT) trees at MRS may have been influenced by enclosure heat stress (see Sects. 3.2.2 and 3.2.3).
between clusters, further evidence that only one chemotype was present in the live trees at CP.
The ratios of SQT observed at CP tell a different story, with SQT compositions being somewhat unique across the three sample classes, and possibly also among individual stands (Table 5).α-farnesene or e-β-farnesene was the dom-inant compound among the LG trees, while the BG trees had more heterogeneous SQT profiles, with increased impor-tance ofγ- andδ-cadinene, along with aromadendrene and
α-cuprenene in BG2. Interestingly, LG3 was similar to BG3; these two trees were growing relatively close to each other (but were still in different stands), while BG2 and BR2 also had similarities (and were growing just a few meters apart). Among the BR trees that were screened, BR1 had SQT
ra-tios comprised almost entirely of γ-andδ-cadinene, while BR2 (which emitted very little SQT) was dominated byγ -cadinene, aromadendrene, andα-cuprenene.
3.2 MRS, CO sampling results
3.2.1 Emission rates: 30 June–1 July
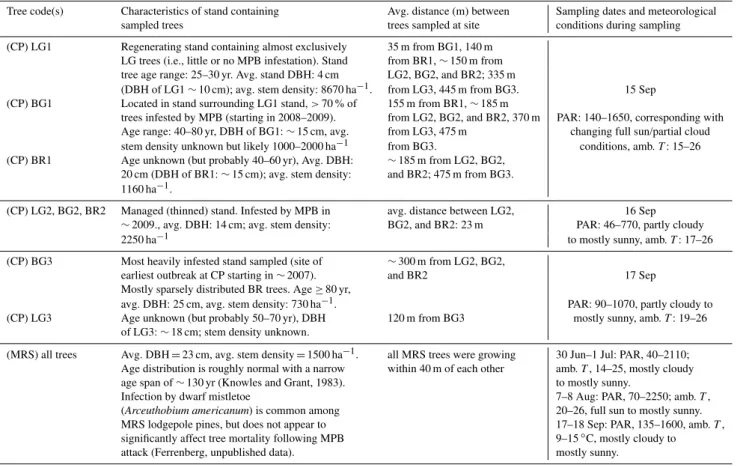
Fig. 3.MT emissions observed between 8–9 August at MRS, plotted as a function of temperature.
Helmig et al., 2007) while CT1 exhibited a higher MT BER (Table 3) with significant variability in MT BER among most of the trees (Table 6). One of the baited trees (OB2) and con-trol tree 1 (CT1) exhibited significantly higher SQT BERs than the other four trees (Tables 3 and 7). Emissions of to-tal OVOC (Table 3) exhibited an exponential temperature re-sponse (R2=0.64), with an average OVOC ER of 0.165 and average enclosure temperature of 24.4◦C.
3.2.2 Emission rates: 7–8 August
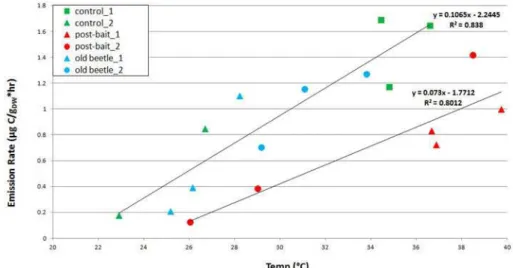
As observed during the first visit, there were no obvious dif-ferences in MBO emissions between any of the classes. MBO emissions exhibited a linear response to temperature, with a slope of 0.85, (R2=0.66). MT emissions also exhibited a more or less linear relationship with temperature (Fig. 3) and less tree-to-tree variability in BERs compared to the 30 June– 1 July visit (Table 6). The slope obtained when a linear re-gression was performed on all the MT ER data (0.07) had a much lower R2 value (0.51) than when the baited trees were treated with a separate regression analysis: The baited trees had lower MT emissions than both control and old-beetle trees at similar temperatures, and had a lower slope (0.07, R2=0.80) than control and old beetle trees (0.11,
R2=0.84, Fig. 3). During both the early August and mid-September sampling days, the trees that had survived beetle attacks 1–2 yr prior to sampling (OB1, OB2) had the highest SQT BERs. OVOC emissions were similar to 30 June–1 July values for all trees except AB2 (Table 3).
Branch CT2 experienced very high temperatures (just over 40◦C, the highest observed enclosure temperature; average ambient temperature at this time was ∼28◦C) during Au-gust sampling. The enclosure overheating, which lasted for
∼35 min, occurred between collection of the first and sec-ond samples (both of which were within 3◦C of ambient val-ues), and was caused by an extended period of direct
sun-light incident on the enclosure. This offered an opportunity to evaluate the effects of a short duration of heat stress on both compound ratios and total emissions before and after exposure of the branch to high temperatures, as well as to evaluate longer-term effects on emissions since we returned to the site and sampled all of the branches again in mid-September. Total MT emitted before and after the heat event exhibited temperature-related differences, which were sim-ilar to the quantities and temperature dependencies of MT emitted by OB1 (which did not experience heat stress), sug-gesting that short-term heat stress did not substantially af-fect the quantity of MT emitted, although the ratios of MT and SQT changed a lot before and after the heat event (not shown). The total amount of SQT emitted following the heat event was almost the same as the pre-heating emission, de-spite the fact that the temperature was 1.3◦C warmer in the latter sample. Ratios of OVOC did not change much, and the branch emitted about the same total amounts of OVOC as other branches (except AB2, which emitted more OVOC than any other branch). Tree AB1 also experienced substan-tial overheating (average enclosure temperature was∼38◦C throughout sampling), and trees AB2 and CT1 experienced moderately elevated enclosure temperatures during August sampling. Therefore, the ERs given in Table 3 and the com-pound speciation data in Tables 4–5 may reflect some degree of stress-induced emissions.
3.2.3 Emission rates: 17–18 September
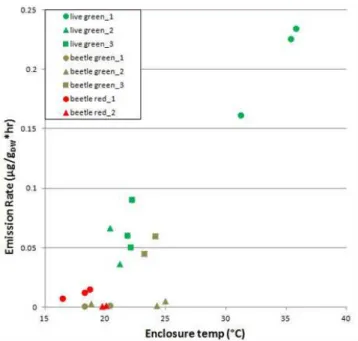
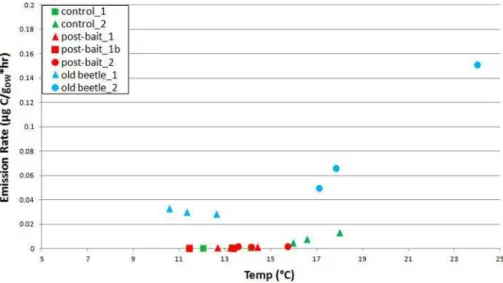
Fig. 4.SQT emissions observed during the last MRS sampling visit (17–18 September), plotted as a function of temperature.
the lowest MBO emissions in mid-September (CT1, AB1 and AB2) experienced the most heat stress from enclosure overheating in August. A second branch from baited tree #1 (“AB1b”) was sampled during the September sampling pe-riod to evaluate potential long-term effects on emissions fol-lowing a period of heat stress, as the primary branch sampled from this tree was exposed to the longest period (∼4.5 h; the entire duration of the sampling period for this branch) of heat stress during August sampling. MT ratios were nearly identical between this branch and the primary branch sam-pled from the tree. MT ERs were slightly higher in branch B than in the other branches experiencing similar tempera-tures (branches AB1 and CT1), but still lower than what was emitted by OB1, which experienced similar enclosure tem-peratures during this visit (and no heat stress during August sampling). MT emissions mostly displayed a linear relation-ship with temperature, with a slope of 0.11 (R2=0.78), ex-cluding OB1, which had a significantly higher BER than the other branches (Table 6), as well as the secondary enclosure placed on a previously unsampled branch from AB1 (AB1b), which had a BER∼2.6 times higher than the other enclo-sures. The enclosures exhibiting the lowest MT emissions in September were the same enclosures that experienced the most heat stress during the August measurements. SQT sions measured in September were lower than August emis-sions for all trees, with the old-beetle branches emitting∼5– 40 times more SQT than other trees at similar temperatures (Fig. 4, Table 3), including the previously unsampled branch from one of the baited trees (i.e., AB1b, which did not emit SQT, although tiny amounts were emitted from AB1), im-plying that the observed differences were not consequences of enclosure overheating during the August campaign. SQT BERs for the OB trees were also significantly higher than the other trees (Table 6). OVOC emissions were<0.0004 for all enclosures other than the two OB trees and CT2. Tree OB1
emitted∼22 times more OVOC during the 17–18 September measurements than other trees at similar enclosure tempera-tures.
3.2.4 Seasonal MT, SQT, and OVOC speciation profiles
MT species (Table 4) identified in each tree during the course of the campaign exhibited significantly more tree-to-tree variability than what was observed at the CP site. During late June/early July,β-pinene was the dominant MT emitted by three of the trees (OB1, OB2 and BB1),β-phellandrene the dominant MT emitted by both trees selected to be controls (CT1, CT2), and 3-carene the dominant MT emitted by BB2. Though ratios changed somewhat during the August cam-paign (Table 4), the MTs (which were dominant in the first sample period) returned to being dominant in the September samples, except in CT1 (which was also by far the highest MT emitter). The baited trees both exhibited a decrease in the richness of MT chemical species emitted by the end of the campaign, with an average of 10 MT observed on 17– 18 September compared to 16 during 30 June–1 July. The control trees both also exhibited a slight decrease (average of 14 MT species observed on 17–18 September compared to 16 during 30 June–1 July), while the old-beetle trees did not show a decrease in MT diversity. A secondary enclosure that was placed on a previously unsampled branch from baited tree #1 (i.e., AB1b) during the September measurements had a very similar MT profile as the dedicated branch from this tree.
R.
Duhl
et
al.:
Emissions
o
f
BV
OC
fr
om
lodgepole
pine
493
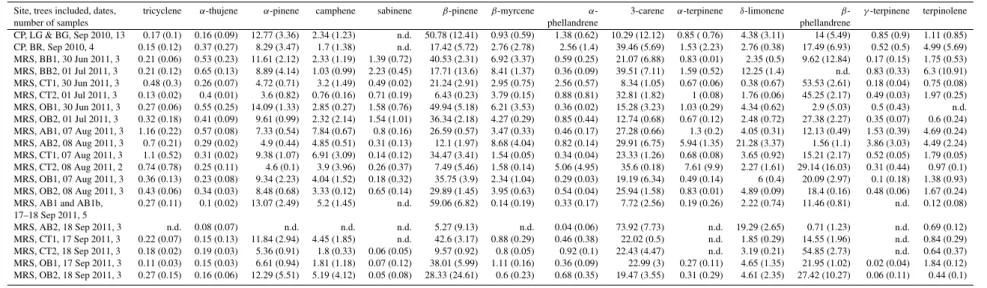
Table 4.Average percent contribution of individual compounds to total observed MT emissions (standard deviations shown in parentheses) at CP and MRS (n.d.=not detected, compounds averaging<0.1 % of total MT emissions for all trees sampled at site were excluded), grouped by site and (for CP) sampling class.
Site, trees included, dates, tricyclene α-thujene α-pinene camphene sabinene β-pinene β-myrcene α- 3-carene α-terpinene δ-limonene β- γ-terpinene terpinolene
number of samples phellandrene phellandrene
CP, LG & BG, Sep 2010, 13 0.17 (0.1) 0.16 (0.09) 12.77 (3.36) 2.34 (1.23) n.d. 50.78 (12.41) 0.93 (0.59) 1.38 (0.62) 10.29 (12.12) 0.85 ( 0.76) 4.38 (3.11) 14 (5.49) 0.85 (0.9) 1.11 (0.85) CP, BR, Sep 2010, 4 0.15 (0.12) 0.37 (0.27) 8.29 (3.47) 1.7 (1.38) n.d. 17.42 (5.72) 2.76 (2.78) 2.56 (1.4) 39.46 (5.69) 1.53 (2.23) 2.76 (0.38) 17.49 (6.93) 0.52 (0.5) 4.99 (5.69) MRS, BB1, 30 Jun 2011, 3 0.21 (0.06) 0.53 (0.23) 11.61 (2.12) 2.33 (1.19) 1.39 (0.72) 40.53 (2.31) 6.92 (3.37) 0.59 (0.25) 21.07 (6.88) 0.83 (0.01) 2.35 (0.5) 9.62 (12.84) 0.17 (0.15) 1.75 (0.53) MRS, BB2, 01 Jul 2011, 3 0.21 (0.12) 0.65 (0.13) 8.89 (4.14) 1.03 (0.99) 2.23 (0.45) 17.71 (13.6) 8.41 (1.37) 0.36 (0.09) 39.51 (7.11) 1.59 (0.52) 12.25 (1.4) n.d. 0.83 (0.33) 6.3 (10.91) MRS, CT1, 30 Jun 2011, 3 0.48 (0.3) 0.26 (0.07) 4.72 (0.71) 3.2 (1.49) 0.49 (0.02) 21.24 (2.91) 2.95 (0.75) 2.56 (0.57) 8.34 (1.05) 0.67 (0.06) 0.38 (0.67) 53.53 (2.61) 0.18 (0.04) 0.75 (0.08) MRS, CT2, 01 Jul 2011, 3 0.13 (0.02) 0.4 (0.01) 3.6 (0.82) 0.76 (0.16) 0.71 (0.19) 6.43 (0.23) 3.79 (0.15) 0.88 (0.81) 32.81 (1.82) 1 (0.08) 1.76 (0.06) 45.25 (2.17) 0.49 (0.03) 1.97 (0.25) MRS, OB1, 30 Jun 2011, 3 0.27 (0.06) 0.55 (0.25) 14.09 (1.33) 2.85 (0.27) 1.58 (0.76) 49.94 (5.18) 6.21 (3.53) 0.36 (0.02) 15.28 (3.23) 1.03 (0.29) 4.34 (0.62) 2.9 (5.03) 0.5 (0.43) n.d. MRS, OB2, 01 Jul 2011, 3 0.32 (0.18) 0.41 (0.09) 9.61 (0.99) 2.32 (2.14) 1.54 (1.01) 36.34 (2.18) 4.27 (0.29) 0.85 (0.44) 12.74 (0.68) 0.67 (0.12) 2.48 (0.72) 27.38 (2.27) 0.35 (0.07) 0.6 (0.24) MRS, AB1, 07 Aug 2011, 3 1.16 (0.22) 0.57 (0.08) 7.33 (0.54) 7.84 (0.67) 0.8 (0.16) 26.59 (0.57) 3.47 (0.33) 0.46 (0.17) 27.28 (0.66) 1.3 (0.2) 4.05 (0.31) 12.13 (0.49) 1.53 (0.39) 4.69 (0.24) MRS, AB2, 08 Aug 2011, 3 0.7 (0.21) 0.29 (0.02) 4.9 (0.44) 4.85 (0.51) 0.31 (0.13) 12.1 (1.97) 8.68 (4.04) 0.82 (0.14) 29.91 (6.75) 5.94 (1.35) 21.28 (3.37) 1.56 (1.1) 3.86 (3.03) 4.49 (2.24) MRS, CT1, 07 Aug 2011, 3 1.1 (0.52) 0.31 (0.02) 9.38 (1.07) 6.91 (3.09) 0.14 (0.12) 34.47 (3.41) 1.54 (0.05) 0.34 (0.04) 23.33 (1.26) 0.68 (0.08) 3.65 (0.92) 15.21 (2.17) 0.52 (0.05) 1.79 (0.05) MRS, CT2, 08 Aug 2011, 2 0.74 (0.78) 0.25 (0.11) 4.6 (0.1) 3.9 (3.96) 0.26 (0.37) 7.49 (5.46) 1.58 (0.14) 5.06 (4.95) 35.6 (0.18) 7.61 (9.9) 2.27 (1.61) 29.14 (16.03) 0.31 (0.44) 0.97 (0.1) MRS, OB1, 07 Aug 2011, 3 0.36 (0.13) 0.23 (0.08) 9.34 (2.23) 4.04 (1.52) 0.18 (0.32) 35.75 (3.9) 2.34 (1.04) 0.29 (0.03) 19.19 (6.34) 0.49 (0.14) 6 (0.4) 20.09 (2.97) 0.1 (0.18) 1.38 (0.93) MRS, OB2, 08 Aug 2011, 3 0.43 (0.06) 0.34 (0.03) 8.48 (0.68) 3.33 (0.12) 0.65 (0.14) 29.89 (1.45) 3.95 (0.63) 0.54 (0.04) 25.94 (1.58) 0.83 (0.01) 4.89 (0.09) 18.4 (0.16) 0.48 (0.06) 1.67 (0.24) MRS, AB1 and AB1b, 0.27 (0.11) 0.1 (0.02) 13.07 (2.49) 5.2 (1.45) n.d. 59.06 (6.82) 0.14 (0.19) 0.33 (0.17) 7.72 (2.56) 0.19 (0.26) 2.22 (0.74) 11.46 (0.81) n.d. 0.12 (0.08) 17–18 Sep 2011, 5
MRS, AB2, 18 Sep 2011, 3 n.d. 0.08 (0.07) n.d. n.d. n.d. 5.27 (9.13) n.d. 0.04 (0.06) 73.92 (7.73) n.d. 19.29 (2.65) 0.71 (1.23) n.d. 0.69 (0.12) MRS, CT1, 17 Sep 2011, 3 0.22 (0.07) 0.15 (0.13) 11.84 (2.94) 4.45 (1.85) n.d. 42.6 (3.17) 0.88 (0.29) 0.46 (0.38) 22.02 (0.5) n.d. 1.85 (0.29) 14.55 (1.96) n.d. 0.84 (0.29) MRS, CT2, 18 Sep 2011, 3 0.18 (0.02) 0.19 (0.03) 5.36 (0.91) 1.8 (0.33) 0.06 (0.05) 9.57 (0.92) 0.8 (0.05) 0.92 (0.1) 22.43 (4.47) n.d. 3.19 (0.21) 54.85 (2.73) n.d. 0.64 (0.37) MRS, OB1, 17 Sep 2011, 3 0.11 (0.03) 0.15 (0.03) 6.61 (0.94) 1.81 (1.18) 0.07 (0.12) 38.01 (5.99) 1.11 (0.16) 0.36 (0.09) 22.99 (3) 0.27 (0.11) 4.65 (1.35) 21.95 (1.02) 0.02 (0.04) 1.84 (0.12) MRS, OB2, 18 Sep 2011, 3 0.27 (0.15) 0.16 (0.06) 12.29 (5.51) 5.19 (4.12) 0.05 (0.08) 28.33 (24.61) 0.6 (0.23) 0.68 (0.35) 19.47 (3.55) 0.31 (0.29) 4.61 (2.35) 27.42 (10.27) 0.06 (0.11) 0.44 (0.1)
Table 5.Average percent contribution of individual compounds to total observed SQT emissions (standard deviations shown in parentheses) at CP and MRS (n.d.=not detected). Compounds comprising<0.1 % of total SQT emissions were excluded, asterisk indicates tentative compound identification.
Site, tree, dates, α-copaene β- α- α-trans- aroma- c-β- e-β- γ- α- α- α- γ-cadinene δ-cadinene unidentified number of samples caryophyllene bergamotene bergamotene dendrene* farnesene farnesene muurolene zingiberene* cuprenene farnesene SQT CP, LG1, 15 Sep 2010, 2 n.d. n.d. 0.07 (0.03) n.d. 0.36 (0) n.d. 12.55 (1.47) n.d. 3.15 (0.13) n.d. 80.93 (1.96) 0.57 (0.25) 0.65 (0.14) 1.72 (0.19) CP, LG2, 16 Sep 2010, 2, n.d. 0.08 (0.12) 2.93 (1.97) n.d. n.d. n.d. 53.78 (8.52) n.d. 0.7 (0.16) n.d. 37.92 (5.38) n.d. n.d. 4.59 (1.12) CP, LG3, 17 Sep 2010, 2, 0.85 (0.13) n.d. 0.06 (0) 5.12 (0.69) n.d. n.d. 2.5 (0.29) n.d. n.d. n.d. 75.67 (3.74) 6.83 (1.29) 3.89 (1.14) 5.07 (0.19) CP, BG1, 15 Sep 2010, 2, n.d. n.d. 2.71 (0.1) n.d. n.d. n.d. 40.76 (5.15) n.d. 4.96 (1.12) n.d. 2.82 (3.98) 13.9 (6.68) 34.35 (4.07) n.d. CP, BG2, 16 Sep 2010, 3 n.d. 0.89 (1.54) 1.23 (0.31) n.d. 24.69 (10.99) n.d. 23.26 (6.48) n.d. n.d. 13.32 (13.43) 8.55 (8.11) 15.46 (13.14) 11.99 (10.93) 0.53 (0.91) CP, BG3, 17 Sep 2010, 2 1.23 (0.87) n.d. 0.15 (0.01) 2.7 (0.23) n.d. n.d. 3.18 (0.04) n.d. n.d. n.d. 64.27 (6.62) 13.14 (2.86) 12.71 (2.96) 2.61 (0.18) CP, BR1, 15 Sep 2010, 2 n.d. n.d. 1.4 (0.59) n.d. 1.77 (0.79) n.d. 0.95 (1.35) n.d. n.d. n.d. n.d. 43.33 (0.6) 52.34 (2.38) 0.19 (0.26) CP, BR2, 16 Sep 2010, 2 n.d. 2.39 (0.4) 0.44 (0.62) n.d. 37.07 (0.15) n.d. 25.63 (7.21) n.d. n.d. 27.35 (0.7) 4.52 (6.39) 2.47 (1.49) n.d. n.d. MRS, BB1, 30 Jun 2011, 3 n.d. 0.92 (0.84) n.d. 9.16 (1) 1.46 (1.3) 53.09 (0.71) 4.79 (1.68) 0.79 (0.41) 0.8 (0.38) 14.26 (3.11) 4.38 (1.26) 2.14 (1.39) 8.22 (1.47) 0.92 (0.84) MRS, BB2, 01 Jul 2011, 3 n.d. 0.47 (0.66) n.d. 3.98 (2.75) 0.25 (0.26) 34.16 (19.66) 0.88 (1) 0.16 (0.13) n.d. 57.19 (16.15) 0.31 (0.17) 0.08 (0.05) 2.52 (0.87) 0.47 (0.66) MRS, CT1, 30 Jun 2011, 3 n.d. 0.02 (0.03) n.d. 14.27 (0.75) n.d. 67.01 (1.68) n.d. 0.82 (0.09) 0.52 (0.08) 9.01 (1.54) 3.5 (0.37) 2.48 (0.24) 2.37 (0.17) 0.02 (0.03) MRS, CT2, 01 Jul 2011, 3 n.d. n.d. n.d. 15.45 (4.06) 2.02 (1.88) 37.74 (1.57) n.d. 2.3 (1.04) 2.39 (0.99) 24.18 (14.03) 7.66 (3.13) 6.01 (1.78) 2.26 (0.12) n.d. MRS, OB1, 30 Jun 2011, 3 n.d. n.d. n.d. 7.18 (2.27) 1.3 (1.14) 46.56 (12.78) 0.98 (0.96) 1.01 (0.48) n.d. 24.3 (22.97) 4.79 (3) 4.09 (1.39) 9.79 (2.76) n.d. MRS, OB2, 01 Jul 2011, 3 n.d. n.d. n.d. 13.66 (1.45) 0.08 (0.07) 45.6 (4.62) n.d. 0.26 (0.04) 0.31 (0.06) 30.79 (5.94) 1.17 (0.12) 0.82 (0.08) 7.31 (0.05) n.d. MRS, AB1, 07 Aug 2011, 3 n.d. 0.77 (0.08) n.d. 6.94 (0.34) 0.49 (0.11) 55.51 (2.31) n.d. 0.34 (0.07) 0.34 (0.04) 24.66 (1.19) 1.02 (0.07) 0.74 (0.09) 9.19 (2.33) 0.77 (0.08) MRS, AB2, 08 Aug 2011, 3 n.d. 0.17 (0.15) n.d. 2.77 (0.4) 0.27 (0.35) 46.4 (9.51) n.d. 0.12 (0.01) 0.13 (0.1) 47.67 (9.2) 0.23 (0.02) 0.37 (0.03) 1.87 (0.33) 0.17 (0.15) MRS, CT1, 07 Aug 2011, 3 n.d. 0.67 (0.2) n.d. 6.58 (0.22) 0.17 (0.07) 54.79 (2.75) n.d. 1.87 (0.46) 1.94 (0.67) 8.66 (0.9) 8.01 (1.87) 6.18 (1.41) 11.14 (2.13) 0.67 (0.2) MRS, CT2, 08 Aug 2011, 2 n.d. n.d. n.d. 1.46 (0.31) 0.17 (0.24) 46.95 (10.43) n.d. 0.26 (0.22) 0.37 (0.24) 47.22 (13.38) 1.2 (0.98) 1.16 (0.82) 1.22 (0.15) n.d. MRS, OB1, 07 Aug 2011, 3 n.d. n.d. n.d. 1.88 (0.49) n.d. 39.28 (8.42) n.d. 0.13 (0.06) 0.09 (0.08) 51.52 (9.35) 0.5 (0.16) 0.35 (0.11) 6.25 (0.54) n.d. MRS, OB2, 08 Aug 2011, 3 n.d. n.d. n.d. 6.63 (0.26) n.d. 39.43 (4.48) n.d. 0.18 (0.06) 0.21 (0.08) 44.82 (4.45) 0.62 (0.15) 0.45 (0.06) 7.66 (0.61) n.d. MRS, AB1 and AB1b, n.d. n.d. n.d. n.d. n.d. n.d. 60 (54.77) n.d. n.d. n.d. n.d. n.d. n.d. n.d. 17—18 Sep 2011, 5
MRS, AB2, 18 Sep 2011, 3 n.d. n.d. n.d. 7.39 (1.53) n.d. n.d. 92.61 (1.53) n.d. n.d. n.d. n.d. n.d. n.d. n.d. MRS, CT1, 17 Sep 2011, 3 n.d. n.d. n.d. n.d. n.d. n.d. n.d. 3.01 (5.21) 6.12 (10.59) n.d. 44.56 (8.52) 46.32 (10.22) n.d. n.d. MRS, CT2, 18 Sep 2011, 3 n.d. n.d. n.d. 0.65 (0.13) 0.72 (1.24) 74.33 (4.1) n.d. 0.62 (0.16) 1.48 (0.52) 15.4 (6.03) 2.6 (0.4) 4.19 (1.45) n.d. n.d.
.biogeosciences.net/10/48
3/2013/
Biogeosciences,
10,
483–
499,
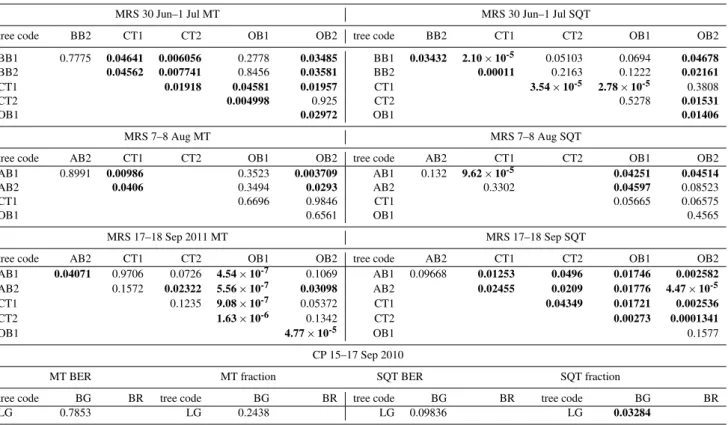
Table 6.Two-sided t-test results (reported as p-values) between individual tree MT and SQT BERs during the first, second, and third sampling visits at MRS, and between sampling classes at CP (bold lettering indicates significance at the 95 % confidence level). The BR sample class at CP and August emissions from tree CT-2 at MRS were excluded from statistical analyses due to small sample sizes.
MRS 30 Jun–1 Jul MT MRS 30 Jun–1 Jul SQT
tree code BB2 CT1 CT2 OB1 OB2 tree code BB2 CT1 CT2 OB1 OB2
BB1 0.7775 0.04641 0.006056 0.2778 0.03485 BB1 0.03432 2.10×10⁻⁵ 0.05103 0.0694 0.04678
BB2 0.04562 0.007741 0.8456 0.03581 BB2 0.00011 0.2163 0.1222 0.02161
CT1 0.01918 0.04581 0.01957 CT1 3.54×10⁻⁵ 2.78×10⁻⁵ 0.3808
CT2 0.004998 0.925 CT2 0.5278 0.01531
OB1 0.02972 OB1 0.01406
MRS 7–8 Aug MT MRS 7–8 Aug SQT
tree code AB2 CT1 CT2 OB1 OB2 tree code AB2 CT1 CT2 OB1 OB2
AB1 0.8991 0.00986 0.3523 0.003709 AB1 0.132 9.62×10⁻⁵ 0.04251 0.04514
AB2 0.0406 0.3494 0.0293 AB2 0.3302 0.04597 0.08523
CT1 0.6696 0.9846 CT1 0.05665 0.06575
OB1 0.6561 OB1 0.4565
MRS 17–18 Sep 2011 MT MRS 17–18 Sep SQT
tree code AB2 CT1 CT2 OB1 OB2 tree code AB2 CT1 CT2 OB1 OB2
AB1 0.04071 0.9706 0.0726 4.54×10⁻⁷ 0.1069 AB1 0.09668 0.01253 0.0496 0.01746 0.002582
AB2 0.1572 0.02322 5.56×10⁻⁷ 0.03098 AB2 0.02455 0.0209 0.01776 4.47×10⁻⁵
CT1 0.1235 9.08×10⁻⁷ 0.05372 CT1 0.04349 0.01721 0.002536
CT2 1.63×10⁻⁶ 0.1342 CT2 0.00273 0.0001341
OB1 4.77×10⁻⁵ OB1 0.1577
CP 15–17 Sep 2010
MT BER MT fraction SQT BER SQT fraction
tree code BG BR tree code BG BR tree code BG BR tree code BG BR
LG 0.7853 LG 0.2438 LG 0.09836 LG 0.03284
or five most dominant MT or all MT detected), indicating the presence of 3–5 MT chemotypes at MRS in Septem-ber (irrespective of infestation status). The PCA plots ob-tained for the various cluster solutions and lumping schemes also indicated strong clusters, further evidence that several chemotypes were present in the live trees at MRS. When three clusters were selected, the resultant chemotypes could be classified according to their dominant MT (β-pinene,β -phellandrene, or 3-carene). When 5 clusters were used, addi-tional “mixed” chemotypes emerged that were formed when the average contribution to total MT from the second-most dominant MT was within a factor of two of the dominant compound.
Table 5 depicts the SQT species identified in each tree during the campaign. In both the 30 June–1 July and 7–8 August sample periods, z-β-farnesene andα-farnesene were the dominant SQT emitted from all of the trees. Similar to observed MT behavior, the baited trees exhibited a decrease in the richness of SQT chemical species emitted by the end of the campaign. Both baited trees had completely differ-ent SQT profiles in September (comprised mostly of e-β -farnesene), compared with samples from the first two vis-its and with the other trees. Control tree #1, which had SQT profiles similar to the other trees during the first two measure-ment periods, also had a radically different SQT profile
dur-ing the final sampldur-ing visit, dominated byδ- andγ-cadinene, a profile that was similar to that of the MPB-infested trees at Chimney Park.
4 Discussion
This screening study highlights differences in the chemical diversity of emissions from lodgepole pines in two forest sites impacted differently by the MPB, and also presents the seasonal variation observed in BVOC emissions from appar-ently healthy trees versus trees in different stages of MPB attack. At the Chimney Park, WY site, where MPB-related mortality has been high, we found remarkable homogeneity in MT speciation profiles among the various live lodgepole trees studied, irrespective of whether or not they had been infested by MPB. The ostensibly dead (i.e., red-needled) trees at the Chimney Park site emitted negligible amounts of MBO and had different MT profiles than live trees. This may simply reflect a difference in the MT speciation profiles of woody and foliar tissues. Ratios of SQT detected at that site were more unique to the studied groups (i.e., uninfested trees had a different profile than infested but still living trees, etc.), and possibly reflective of the stage of infestation, al-though within-stand differences may also have been present. The SQTγ- andδ-cadinene seemed to correlate with MPB infestation at CP. Measurements conducted at this site sug-gest that trees that might be expected to succumb to MPB attack may have lower SQT emission capacities than their non-infested counterparts.
Lodgepole trees screened at the University of Colorado Mountain Research Station (MRS) site exhibited signifi-cantly more diverse MT profiles, even though the trees that were sampled at this site were growing much nearer to each other and were also closer in age than the Chimney Park trees. At the MRS site, lodgepoles appear to be more resilient to the MPB and/or its fungal symbiont, the blue stain fungus (of which there are at least two species). Although, to our knowledge, little is known about whether specific chemo-types ofPinus contortaare better equipped to survive MPB attack, it has been known for some time that MT emission profiles observed both in tree resin and in emissions are unique between most subspecies/varieties of lodgepole (e.g., Zavarin et al., 1969; Lusebrink et al., 2011). Even within a seemingly homogenous zone, several chemotypes of a given species may be present, and the relative ratios of compounds detected in ambient air have been observed to reflect this di-versity (B¨ack et al., 2012).
SQT profiles from MRS trees in both late June/early July and early August showed a high degree of homogeneity, al-though samples collected in mid-September (during the same time of year that the trees at Chimney Park were sampled) suggest that, at some point in the∼6 weeks following MPB attack, SQT profiles change in newly infested trees. Also, the trees that survive attack (from previous years) may even-tually return to their “pre-attack” SQT profiles (based on the observation that survivors of MPB attack had profiles simi-lar to uninfested trees). There were no obvious class-related differences in SQT emissions at the MRS in late June/early July sampling, but during both the early-August and
mid-September visits to MRS, the trees that had survived bee-tle attacks 1–2 yr prior to sampling exhibited the highest temperature-adjusted SQT emission capacities, which was opposite the trend observed at CP. The two beetle attack sur-vivors sampled at MRS in early August did not experience enclosure heat stress, while the other four enclosures (placed on two baited and two control trees) did experience vary-ing degrees of enclosure over-heatvary-ing. However, the mid-September sampling period included an enclosure placed on a previously unsampled branch from one of the baited trees, and results from this enclosure showed no SQT emissions. Also, one of the control trees experienced elevated enclosure temperatures for only∼35 min during the August measure-ments, and still exhibited substantially lower SQT emissions than the trees that had survived MPB attack in prior years. The reasons why elevated SQT emissions were seen in the MPB survivors only during mid- and late-season sampling are unknown, but it could be a response to beetle activity at the site, since MPBs were not observed at the site during the early season sampling campaign at MRS.
Emissions of MBO from vegetation are both light- and temperature-driven and decline with needle age (Gray et al., 2003). This was not observed between the late June/early July versus early August campaigns, although MBO emis-sion capacities (at comparable temperatures) were lower in mid-September. The observations that mid-September MBO and MT emissions were lower among branches that had ex-perienced heat stress lead us to conclude that exposure to a relatively short duration (∼30 min to several hours) heat event may reduce longer-term MBO and MT (and possi-bly also SQT) emission capacity, although this effect is not definitive. Both MT and SQT ratios did change in response to heat stress, although this was likely a short-term effect.
There was a general pattern across all compound classes studied that the number of compounds detected in each class declined during the growing season, with the greatest decline observed in newly infested trees and the least decline in sur-vivors of MPB-attack from previous years. Other than a tree potentially infested with an unknown pathogen at MRS (see below), there were not significant differences in total OVOC emissions between the trees, except during the last measure-ment days, when the MPB survivors emitted more OVOC than their counterparts.
during this first visit, so heat stress was ruled out as a cause of the unusual emissions observed from CT1, which also emit-ted methyl salicylate as its dominant OVOC during the first sampling period (unlike any other tree sampled), a compound whose emissions are known to be enhanced in many tree species in response to both biotic and abiotic stressors (e.g., K¨annaste et al., 2008; Jo´o et al., 2011). This tree also emit-ted∼30–50 times more o-cymene and p-cymenene than any of the other trees sampled (data not shown) and had unusual behavior in both MT and SQT profiles through the course of the growing season. Whereas the dominant MT observed in the early part of the season was also dominant towards the end of the growing season, in this tree alone a different MT was dominant during the final sampling visit. B¨ack et al. (2012) found that, despite seasonal changes observed in MT profiles among different chemotypes of Scots pine (Pi-nus sylvestrisL.), the dominant compound did not cease to be dominant. Also, the SQT profile observed in this tree at the end of the campaign was singular, but was interestingly comprised mostly of the same two compounds found to be associated with MPB infestation at the Chimney Park site (δ -andγ-cadinene).
Some evidence suggests that fire injury inPinus contorta can lessen induced defenses against MPB (Powell and Raffa, 2011). Fires have not been common at MRS in the last few hundred years, nor at CP in the last 100 yr (Table 1). None of the trees sampled had obvious fire damage, and so this ef-fect is not suspected to play a role in observed differences be-tween Chimney Park and MRS. It is not known which species of blue stain fungus predominate either site, while it is known that some species are more virulent than others (Lusebrink et al., 2011), and so this factor cannot be excluded when pon-dering the difference in apparent MPB resilience between the sites.
The effects of soil type and nutrient availability on emis-sions from lodgepole are unknown, though Orme˜no et al. (2007) observed higher emissions of α-pinene from a Mediterranean pine species (P. halepensis) growing in cal-careous versus siliceous soils. At both the MRS and CP sites, soils are dominated by Typic Cryocrepts and Typic Cryob-oralfs (Table 1, Knight, 1991; Birkeland et al., 2003; Ve-blen and Donnegan, 2005); soils at the MRS study site are predominantly of a sandy loam texture (with 10–15 % clay content, Birkeland et al., 2003) with large cobbles and rocks present. The mineral soils at MRS are overlain by a fairly shallow organic layer (5–10 cm), which is also overlain by a forest litter layer that has high spatial variability depending largely on canopy conditions. Soils at the CP site are predom-inantly of a sandy clay loam texture and exhibit more verti-cal stratification than do the soils at the MRS site. Similar to the MRS site, CP soils under lodgepole pine stands have a significant litter layer covering a decayed organic layer of 5– 10 cm thickness (D. Gochis, personal communication, 2012). The similarity of the soil types at the two sites makes it
un-likely, in our opinion, that differences in observed emissions between the sites are driven by local geology.
The presence or absence of water stress must be consid-ered when evaluating differences between the sites, as water deficit has been shown to decrease emissions of MT in lodge-pole seedlings and may also affect tree resistance to MPB (Lusebrink et al., 2011; Safranyik et al., 2010). We analyzed precipitation data for the 5- and 10-yr period prior to the start of sampling at both the Chimney Park and MRS sites (using PRISM precipitation data, PRISM Climate Group, Oregon State University, http://prism.oregonstate.edu, cre-ated 4 Feburary 2004), and found that both sites had received at or above 100 % of their 1971–2000 average values dur-ing the study time periods (Table 1), although it should be noted that average annual precipitation at CP is∼60 % of the average for MRS. The fact that the sites were relatively moist during the recent period compared to their long-term climatologies is not intended to dispute that severe punctu-ated drought may have been a possible causative mechanism for the MPB outbreak that caused widespread tree mortal-ity as has been suggested by others (e.g., Bentz et al., 2010; Breshears et al., 2005). Instead, it is only presented to illus-trate the recent hydroclimatic context of the summers when BVOC sampling was performed. Lastly, it is noted that the seasonal soil moisture in this region is largely modulated by strong springtime snowmelt followed by a long gradual dry-down throughout the summer growing season with periodic pulses from summer rainfall events. Both sites exhibited this typical behavior (not shown) during the 2010 and 2011 sam-pling years.
ask whether the trees at MRS may be more genetically di-verse than their counterparts at CP or other locations with higher MPB mortality. Analyses of monoterpene resin chem-istry indicate that MRS specimens have higher heterozygos-ity as compared with a number of other stands sampled (Fer-renberg, unpublished data), although CP was not included in these resin samples. Nonetheless, these observations, the site-specific comparisons of other biotic and abiotic factors (above), and the observed differences in MT chemodiversity between the sites suggest that the trees sampled at MRS may be more diverse than many other lodgepole populations.
The observations made in this study have unclear conse-quences on our understanding of feedbacks in plant–insect interactions (since MPBs are thought to respond mainly to BVOC emanating from trunks), whereas the potential for MPB-driven effects on regional air quality and secondary or-ganic aerosol (SOA) formation from both trunk- and canopy-level emission changes is a more obvious use of the data. Since SOA yields of different MT and SQT species vary by more than a factor of two (Ng et al., 2006), a change in MT or SQT speciation can result in a substantial change in the amount of SOA produced from these emissions. The changes in MT speciation of the newly infested trees at MRS in-clude one case where the average SOA yield would increase, due to a higher proportion of 3-carene andδ-limonene, and another case where the average SOA yield would be ex-pected to decrease due to the increase in the contribution ofβ-pinene. Reactivities of the SQT species (relative to the major atmospheric oxidants) observed in this study are not well constrained, and further inquiry into the aerosol forma-tion potentials of the SQT cadinenes (which may become elevated in MPB-infested trees experiencing MPB-related decline) and farnesenes is warranted. The predicted half-lives of α- and β-farnese with respect to OH and O3 are ∼60–70 % of what is predicted forδ- andγ-cadinene (http: //www.epa.gov/opptintr/exposure/pubs/episuite.htm). There-fore, the expected SOA yield might be lower if the cadinenes are emitted in increased proportions by declining trees. Also of consequence are the total emissions of the various com-pound classes, though these impacts need to be more fully qualified before such extrapolations can be made. Amin et al. (2012) observed higher trunk-level concentrations of the MT β-phellandrene and total MT near infested lodgepole trees as compared to healthy trees and suggested a possi-ble increase in SOA from the MPB epidemic due to both increased MT concentrations near infested trees and to the reactivity of β-phellandrene compared with other MT, al-though it is also necessary to consider that, as soon as needles die, there will be significant loss of SOA-formation potential from MBO since this compound is produced de novo. MBO is thought to make substantial contributions to SOA forma-tion in areas where it is emitted in great quantities, such as from the pine forests of western North America (Steiner et al., 2007).
A caveat to the results presented in this study is the low number of individuals screened, which limits the validity of making extrapolations based on the data we have pre-sented. However, the stark contrast evident between the two sites speaks for itself, and several statistically significant re-lationships have been observed. These findings, especially when combined with other relevant studies, beg for more re-search into relationships between lodgepole pine chemodi-versity and MPB. Additionally, future measurements should focus on quantifying the potential magnitude and direction of change in altered BVOC emissions and thus possible con-sequences for regional atmospheric chemistry.
5 Conclusions