www.atmos-chem-phys.net/9/2793/2009/ © Author(s) 2009. This work is distributed under the Creative Commons Attribution 3.0 License.
Chemistry
and Physics
The CO
2
inhibition of terrestrial isoprene emission significantly
affects future ozone projections
P. J. Young1,2,*, A. Arneth3,**, G. Schurgers3, G. Zeng1,2,***, and J. A. Pyle1,2
1Centre for Atmospheric Science, Department of Chemistry, University of Cambridge, Cambridge, CB2 1EW, UK 2National Centre for Atmospheric Science, UK
3Department of Physical Geography and Ecosystems Analysis, Centre for GeoBiosphere Science, Lund University,
S¨olvegatan, Lund, Sweden
*now at: NOAA Earth System Research Laboratory, Boulder, Colorado, USA **currently at: Physics Department, Helsinki University, Helsinki, Finland
***now at: National Institute of Water and Atmospheric Research, Lauder, New Zealand
Received: 1 August 2008 – Published in Atmos. Chem. Phys. Discuss.: 28 November 2008 Revised: 6 March 2009 – Accepted: 14 April 2009 – Published: 27 April 2009
Abstract. Simulations of future tropospheric composition often include substantial increases in biogenic isoprene emis-sions arising from the Arrhenius-like leaf emission response and warmer surface temperatures, and from enhanced veg-etation productivity in response to temperature and atmo-spheric CO2 concentration. However, a number of recent
laboratory and field data have suggested a direct inhibition of leaf isoprene production by increasing atmospheric CO2
con-centration, notwithstanding isoprene being produced from precursor molecules that include some of the primary prod-ucts of carbon assimilation. The cellular mechanism that un-derlies the decoupling of leaf photosynthesis and isoprene production still awaits a full explanation but accounting for this observation in a dynamic vegetation model that contains a semi-mechanistic treatment of isoprene emissions has been shown to change future global isoprene emission estimates notably. Here we use these estimates in conjunction with a chemistry-climate model to compare the effects of isoprene simulations without and with a direct CO2-inhibition on late
21st century O3 and OH levels. The impact on surface O3
was significant. Including the CO2-inhibition of isoprene
re-sulted in opposing responses in polluted (O3decreases of up
to 10 ppbv) vs. less polluted (O3increases of up to 10 ppbv)
source regions, due to isoprene nitrate and peroxy acetyl ni-trate (PAN) chemistry. OH concentration increased with rel-atively lower future isoprene emissions, decreasing methane lifetime by∼7 months (6.6%). Our simulations underline the
Correspondence to:P. J. Young (paul.j.young@noaa.gov)
large uncertainties in future chemistry and climate studies due to biogenic emission patterns and emphasize the prob-lems of using globally averaged climate metrics (such as global radiative forcing) to quantify the atmospheric impact of reactive, heterogeneously distributed substances.
1 Introduction
Understanding how the chemical composition of the tropo-sphere will evolve over the coming century is of central im-portance for climate change projections and for the devel-opment of air quality policies. Climate model integrations need to consider possible changes to anthropogenic and bio-genic emission patterns, as well as the response of atmo-spheric chemistry to changes in temperature, humidity and atmospheric transport. Whilst there are commonly applied projections of future anthropogenic emissions (e.g. Nakicen-ovic et al., 2000; Dentener et al., 2005), atmospheric chem-istry modellers have to estimate future biogenic emissions in a variety of ways, using off/on-line emissions models (e.g. Sanderson et al., 2003; Hauglustaine et al., 2005) or by scaling present day emissions (e.g. Zeng et al., 2008). In the case of biogenic isoprene (C5H8), a highly reactive
compound (Atkinson and Arey, 2003) and the non-methane volatile organic compound (VOC) with the greatest global emission flux (Guenther et al., 1995), models project large increases in the emission by the 2090s (27–70% relative to present day emissions of∼450–550 Tg C a−1; Sanderson et
Fig. 1.Field and laboratory observations of leaf isoprene emissions from plants grown in a range of CO2 concentrations (Ca). Data
are normalised to be unity at a CO2concentration of 370 ppmv.
The dotted line is the simple representation used in Arneth et al. (2007a): I (normalised)=Ci 370/Ci, withCi being the leaf
in-ternal CO2concentration at non-water-stressed conditions (0.7Ca),
and Ci 370=Ci at 370 ppmv. Figure adopted from Possell et
al. (2005) and Arneth et al. (2007a); data are from Sharkey et al. (1991), Buckley (2001), Rosenstiel et al. (2003), Centritto et al. (2004), Scholefield et al. (2004), Possell et al. (2004, 2005), Monson et al. (2007) and Wilkinson et al. (2009; their Figs. 1, 2a and c).
surface temperatures, strongly temperature-dependent emis-sions algorithms (Guenther et al., 1995) and more productive vegetation. However, recent laboratory and field data sug-gest that higher CO2 concentrations inhibit isoprene
emis-sion (e.g. Rosenstiel et al., 2003; Possell et al., 2005; an overview is provided in Arneth et al., 2007a; see also Fig. 1). These observations are puzzling: they indicate a de-coupling of isoprene production from photosynthesis, al-though one of the chief isoprene precursors (glyceraldehyde-3-phosphate, G3P) is provided by the Calvin Cycle and chemical reduction of the precursors to isoprene is achieved with energy provided from photosynthetic electron transport rate (Niinemets et al., 1999). One hypothesis argues for a changed cell-internal competition for a second isoprene pre-cursor molecule, pyruvate, as a possible metabolic control (Rosenstiel et al., 2003). Phosphoenolpyruvate, the pyruvate precursor, is directed away from the chloroplast (the loca-tion of isoprene synthesis) towards other reacloca-tion pathways, which are stimulated by increasing CO2 concentration. In
future climate change scenarios, including the declining leaf isoprene emission to increasing CO2concentration counters
the stimulation of emissions by the warmer temperatures that accompany the CO2increase. Globally, emissions have been
found to remain relatively unaltered over the 21st century as these two responses tend to balance each other (Arneth et al., 2007b).
This CO2-isoprene effect, thus far omitted from
chem-istry/climate modelling studies, has possible ramifications for projected tropospheric ozone and OH levels (and hence methane lifetime), as both are sensitive to the magnitude and spatial distribution of isoprene emission (e.g. Wang and Shallcross, 2000; Sanderson et al., 2003; Fiore et al., 2005; Hauglustaine et al., 2005; Wu et al., 2007; Zeng et al., 2008). Here, we use a chemistry/climate model with isoprene emissions calculated from a recently developed vegetation-isoprene emission model (Arneth et al., 2007a) to investigate the impact of this isoprene/CO2effect on tropospheric
com-position projections for the late 21st century. Further discus-sion on the impact of isoprene chemistry in the model and the interaction of isoprene and anthropogenic emission changes can be found in Young et al., 2007).
2 Model descriptions
2.1 LPJ-GUESS and isoprene emission
Isoprene emissions were calculated using the dynamic global vegetation modelling framework LPJ-GUESS, used here in global (“DGVM”) mode (Smith et al., 2001; Sitch et al., 2003), with a mechanistic leaf isoprene model adapted from Niinemets et al. (1999). Photosynthesis is calculated in a process-based way, adopted from the well established model developed by Farquhar and colleagues (Farquhar et al., 1980; Collatz et al., 1991; Haxeltine and Prentice, 1996). LPJ-GUESS accounts for stimulation of NPP to increasing CO2
concentration, giving a similar response to the observations from the Free-Air Carbon Enrichment (FACE) experiments (Hickler et al., 2008).
Vegetation isoprene emission calculations combine a mechanistic representation in response to light and tempera-ture that arises from the metabolic pathway of isoprene being linked leaf photosynthesis, while the long-term CO2
inhibi-tion follows an empirical parameterisainhibi-tion reflecting the as-yet not fully understood cellular process. Connecting photo-synthesis and isoprene production ensures that global vegeta-tion carbon cycle and total isoprene calculavegeta-tions and isoprene emissions are performed in a coherent modelling framework that also accounts for effects of vegetation productivity to increasing CO2 (Hickler et al., 2008). Leaf isoprene
pro-duction is calculated from photosynthetic electron transport rate, which provides the energy that is required to chemi-cally reduce the C3-isoprene precursors along the DOXP
carbon supply is non-limiting for isoprene production. It has been demonstrated that the short-term temperature and light response, as well as today’s global emission patterns, are comparable with other isoprene model estimates (Arneth et al., 2007a, b; Arneth et al., 2008).
Over longer periods, for instance past or future climate change scenarios, the model includes a representation of the observed decreasing leaf emissions as CO2concentration
in-creases (and vice versa). Arneth et al. (2007a) showed that the calculated change in leaf internal CO2concentration (Ci),
when expressed inversely proportional to the internal CO2
concentration at 370 ppmv (under non-water stressed con-ditions), successfully reproduced the leaf isoprene response observed in most experimental studies in which plants were grown in a range of CO2environments (Possell et al., 2005).
Figure 1 illustrates the relationship described by Arneth et al. (2007a), updated to include a larger range of field and laboratory studies. Whilst the cellular mechanism behind the isoprene inhibition is not yet fully understood, the simple ex-pression as a function of changingCi conceptually fits well with the hypothesis of changing competition for pyruvate as leaf internal CO2 concentration changes (Rosenstiel et al.,
2003). Nonetheless, while most of the studies follow the sug-gested response it is clear that the sensitivity of the isoprene-CO2response may vary between experimental treatments or
between plant species, most visibly in a study ofQuercus rubrawhere emissions actually increased with CO2(Sharkey
et al., 1991).
Recently, Wilkinson et al. (2009) proposed a sigmoidal, Hill-reaction type isoprene-CO2 response, that was based
on isoprene measurements taken in parallel with short-term CO2-response curves at young aspen trees grown in four
dif-ferent CO2 concentrations (between 400 and 1200 ppmv).
The parameterisation of this algorithm differed between the CO2 treatments, as the sensitivity of the short-term CO2
-isoprene response varied between growth environments. By pooling the normalised isoprene aspen data, the authors pro-posed a common parameterisation to apply the observed short-term Hill-response also to the long-term isoprene-CO2
response. For above-ambient CO2 concentration this
algo-rithm projects a mildly lower inhibitory effect compared to the empirical fit andCi-dependent relationship as used by Possell et al. (2005) and Arneth et al. (2007a) respectively. This small difference is unlikely to change the results in our study substantially. However, the study draws attention to the uncertainty of the below-ambient isoprene-CO2response.
Wilkinson et al. (2009) found a large increase in leaf iso-prene emissions for Eucalypt grown at 240 ppmv CO2, but
not for Sweetgum (see also Fig. 1). Clearly, a larger num-ber of studies are needed to establish the CO2-response more
firmly. But, based on our current knowledge, when the CO2
-inhibition of isoprene emission is included in models, it has the potential to counter the stimulating effects of higher tem-perature and vegetation CO2 fertilization in a range of
cli-mate and CO2scenarios (Arneth et al., 2007b).
Studies on isoprene-CO2 interactions have been
per-formed on a limited number of species, mostly from tem-perate growth environments. Initial experimental evidence obtained on Acacia indicates that the overall trend between three CO2 treatments (sub-ambient, ambient and elevated)
observed by Possell et al. (2005) may also hold for tropical tree species; but as the experiment is still ongoing these ob-servations must be considered to be preliminary (M. Possell, personal communication, 2009). Incidentally, since monoter-pene production occurs along the same chloroplastic path-way it is likely that a similar response takes place. Whilst the effects of growth CO2concentration on monoterpene
emis-sions have not been the focus of intensive study, an inhibition of monoterpene emissions at elevated CO2has been observed
(Loreto et al., 2001; Rapparini et al., 2004). 2.2 UM CAM chemistry-climate model
Chemistry-climate integrations were conducted using the latest version of UM CAM (fully described by Zeng et al., 2008), which has been used previously for both contem-porary (Zeng and Pyle, 2005) and future (Zeng and Pyle, 2003) chemistry-climate simulations. Briefly, the climate model is based on the atmosphere-only version of the UK Met Office Unified Model (v4.5, HadAM3, Pope et al., 2000), using prescribed sea-surface temperatures (SSTs) and sea-ice distribution. The horizontal resolution is 2.5◦×3.75◦
(latitude/longitude) and 19 hybrid sigma-pressure vertical coordinates extend from the surface to 4.6 hPa. The radi-ation code (Edwards and Slingo, 1996) includes long and short wave absorptions by water vapour, CO2and O3, with
additional absorption by methane, nitrous oxide, CFC-11 and CFC-12 in the long wave only. Note, we used an ozone cli-matology in this experiment (Li and Shine, 1995) and con-centrations of radiatively active chemical species as calcu-lated by UM CAM were not used in the radiation code.
Photolysis, wet and dry deposition, and the non-isoprene part of the chemical mechanism are similar to the offline chemical transport model TOMCAT (Law et al., 1998), in-cluding a full description of inorganic Ox-NOx-HOx
chem-istry and near-explicit oxidation mechanisms for methane, ethane, propane and acetone. For isoprene oxidation we use the Mainz isoprene mechanism (MIM) (P¨oschl et al., 2001), which is also implemented in the MATCH model (von Kuhlmann et al., 2003) and is of comparable complexity to isoprene oxidation schemes used in other global models (Fol-berth et al., 2006; Horowitz et al., 2007).
The role of isoprene in reactive-nitrogen (NOy) chemistry
has received particular attention in atmospheric chemistry modelling studies (e.g. Horowitz et al., 1998; von Kuhlmann et al., 2004; Horowitz et al., 2007) and it is therefore impor-tant to clarify the parameterisations of NOychemistry used
Table 1.Simulation emission fluxes and tropospheric ozone budget terms, PAN burden, OH concentration and methane lifetimea.
BASE noCO2 wCO2
NOx 48.8 124.1 124.1
CO 1077 2327 2327
CH4 1760 3731 3731
Isoprene 401 764 346
Other VOCs 137 278 278
UM CAM climate present 2095–2100 2095–2100
O3production 4133 8554 8288
O3loss 3338 7444 7183
O3influx 387 816 788
O3dry deposition 1182 1926 1893
O3burden 316.0 457.8 455.5
PAN burden 4.0 6.6 5.0
OH concentration 8.4 8.7 9.3
CH4lifetime 10.7 9.1 8.5
a NO
x emissions (Tg N a−1) include contributions from surface,
aircraft and lightning; CO emissions in Tg a−1; fixed CH
4
concen-trations in ppbv; isoprene in Tg C a−1; and other VOC emissions
in Tg C a−1. O
3budget terms (production, loss, influx and
deposi-tion) in Tg a−1; O
3and PAN burdens in Tg; OH concentration in
105molecules cm−3; and methane lifetime in years.
isoprene hydroxy-peroxy radicals (ISO2) with NO, and
per-oxy alkyl nitrates, from the reaction of isoprene with NO3.
The parameterisation of the kinetics and solubility of ISON is important in determining whether it is a reservoir or sink of NOx(=NO+NO2) in the atmosphere. For deposition, we
use parameters that aim to account for the expected differ-ent physical properties of the constitudiffer-ent species of ISON: hydroxy alkyl nitrates are likely to deposit more quickly than peroxy alkyl nitrates. A Henry’s Law constant (KH
(298 K)) of 3.0×10³M atm−1 is applied, derived from the average of data for 2-nitroxy butanol and 3-methyl-1-butyl nitrate (Staudinger and Roberts, 1996), and the dry deposi-tion velocities are approximately 15% higher than those used for PAN (using data from Giannakopoulos (1998) and refs. therein). For the reaction kinetics, the data from P¨oschl et al. (2001) were adopted: ISON is produced in a 4.4% yield from the ISO2+NO reaction (Chen et al., 1998), whilst the
ISON+OH reaction (ultimately recycling NOx) has a rate
constant of 1.3×10⁻¹¹cm3molecule s−1(Kwok and
Atkin-son, 1995). The solubility, dry deposition rate and rate con-stants are on the lower end of the range of literature estimates (e.g. see the discussion in Horowitz et al., 2007), although sensitivity studies suggest that changing these parameterisa-tions to match the recommendaparameterisa-tions of Horowitz et al. (2007) result in relatively small perturbations globally (generally <5% effect on boundary layer ozone) (P. J. Young, unpub-lished results).
3 Experiment descriptions
In this study, we present the results from three UM CAM model simulations, summarised in Table 1. The set up of the BASE simulation is appropriate to present day condi-tions, using IIASA anthropogenic emissions (Dentener et al., 2005), LPJ isoprene emissions (average of 1980–1999) cal-culated with present day climate and CO2concentration
(Ar-neth et al., 2007b), and climatological SSTs and sea-ice fields (GISST) (Parker et al., 1995) as the boundary condition for UM CAM.
The future simulations (noCO2 and wCO2) were designed to simulate a pessimistic 2090s atmosphere consistent with the SRES A2 scenario (Nakicenovic et al., 2000). Emissions of anthropogenic ozone precursors and the concentrations of well-mixed greenhouse gases (see Johns et al., 2003) are greatly enhanced compared to present day, though emissions from biomass burning and biogenic sources other than iso-prene are at the same level as BASE. UM CAM was forced with SST and sea-ice fields calculated for a doubled CO2
atmosphere for these simulations. We used the SRES A2 scenario in order to assess the sensitivity to a large climate change and increase of ozone precursor emissions. Note, lightning NOx emissions are parameterised based on
con-vective cloud top height following Price and Rind (1992, 1994), and are therefore sensitive to the model climate. For wCO2 and noCO2, lightning emissions are 3.9 Tg N yr−1,
an increase of 26% compared to the emissions in BASE (3.1 Tg N yr-1).
noCO2 and wCO2 differ in terms of their isoprene emis-sion calculated by LPJ-GUESS. In the former, emisemis-sions re-spond to a warmer temperature (an effect of stimulating pho-tosynthesis in many environments and of the high tempera-ture optimum of isoprene production) and enhance vegeta-tion productivity (an effect of CO2fertilization of
photosyn-thesis). In the latter, the long-term leaf CO2-isoprene
inhi-bition is included in addition. The indirect effects of tem-perature and CO2 concentration on vegetation productivity
were the same in both cases (see Sect. 2.1 and Arneth et al., 2007b). Both vegetation model simulations used CO2
concentrations following the SRES A2 scenario and a cor-responding future climate from the Hadley Centre HadCM3 model to calculate the isoprene emission response (Arneth et al., 2007b). In the calculations LPJ-GUESS simulated po-tential natural vegetation; additional effects of anthropogenic land-cover change on isoprene emissions were not taken into account. Figure 2 illustrates the differences in yearly total isoprene emission between the three simulations. The dif-ference between the wCO2 and noCO2 simulations reveals the impact of the direct CO2-isoprene effect in a 2090s
at-mosphere.
(a) noCO2 - BASE
(b) wCO2 - BASE
(c) wCO2 - noCO2
g C m-2 yr-1
Fig. 2. Difference in the yearly total isoprene emissions (g C m−2yr−1) between (a) noCO2 and BASE, (b) wCO2 and BASE and(c)wCO2 and noCO2.
For BASE, we report results that are the average of the final 2 years of a 30 month simulation. We employ a shorter in-tegration here because, as we use climatological SSTs, the differences between simulated years are very much less than the difference between BASE and wCO2/noCO2.
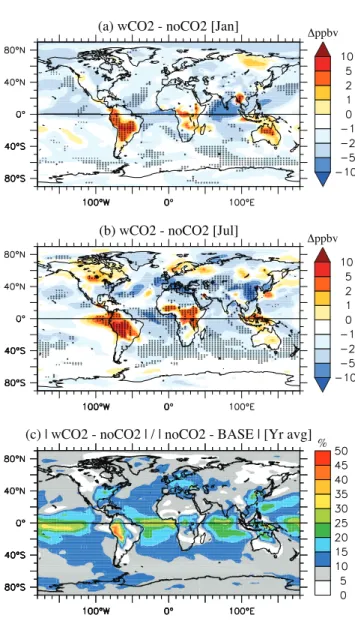
(b) wCO2 - noCO2 [Jul]
(a) wCO2 - noCO2 [Jan] Δppbv
(c) | wCO2 - noCO2 | / | noCO2 - BASE | [Yr avg]
% Δppbv
Fig. 3. Difference in monthly mean surface ozone concentrations (ppbv) between wCO2 and noCO2 simulations for(a)January and (b) July (2090–2095 average). The shading indicates where the difference is significant at the 95% level (student’s t-test). And (c)Yearly averaged (absolute) difference in surface ozone between wCO2 and noCO2 relative to the yearly averaged (absolute) differ-ence between noCO2 and BASE (%).
4 Impact on ozone concentrations
Figure 3a, b shows the difference in (January and July) monthly-mean surface ozone concentrations that were sim-ulated by using the two different future isoprene emission scenarios. Both panels clearly illustrate a significant impact on surface ozone, but with a large degree of spatial hetero-geneity. The relatively lower isoprene emissions in wCO2 compared to noCO2 resulted in decreased ozone levels over most oceanic regions in both months. In these areas the ma-jor source of NOx(and hence ozone production) is the
(Moxim et al., 1996; Horowitz et al., 1998). Isoprene is the major PAN precursor in the model; the tropospheric PAN burden decreased by∼24% between noCO2 and wCO2 (Ta-ble 1). Surface NOxlevels decreased by 10–30% over most
oceanic regions in wCO2, and by 50% in continental out-flow regions (not shown). This effect becomes visible, for in-stance, in the North Atlantic Ocean in July, where the wCO2 simulation shows peak ozone reductions of 5–10 ppbv (15– 20%) due to reduced export of NOxfrom Eastern USA, an
area influenced by isoprene emissions from South-Eastern USA (Fiore et al., 2005). A similar pattern was apparent over the Indian Ocean in January, related to reduced NOxexport,
due to less isoprene emission, from Asia (Fig. 2). Decreases in ozone in wCO2 were also evident in July over the pol-luted regions of Eastern USA, Europe and Southeast Asia, with reductions of between 2–10 ppbv (5–10%). Co-located higher NOxlevels in these areas indicate that ozone
produc-tion is sensitive to the level of VOCs, hence the less isoprene in wCO2 leading to reduced ozone (Sillman, 1999).
Figure 3a, b shows 2–10 ppbv (up to 20–25%) surface ozone increases over the Amazon, tropical Africa and the maritime continent for both months, coincident with a∼50% decrease in isoprene emission over these major source re-gions in wCO2 compared to noCO2. The ozone increase resulted from reduced sequestration of NOxby isoprene
oxi-dation products (isoprene nitrates and PAN) (e.g. Roelofs and Lelieveld, 2000), leading to increased NOxlevels (10–30%)
and increased ozone production in these regions, as well as reduced isoprene ozonolysis (as noted by Fiore et al., 2005; Wiedinmyer et al., 2006). The surface ozone increase was most marked in the Amazon (>15% in both months), where the low NOxlevels result in a lower oxidizing capacity
in-creasing the stability of isoprene nitrates and hence their im-portance as a NOxsink (P¨oschl et al., 2000).
Zonal mean ozone changes (not shown) were largely con-sistent with the effects of non-methane VOC chemistry de-scribed by Wang et al. (1998). wCO2 showed a 1–3 ppbv in-crease (∼5%) in tropical upper troposphere (UT) concentra-tions compared to noCO2 in January and July. This resulted from a decrease in isoprene oxidation products in convective plumes, reducing NOxsequestration in the region (NOx
lev-els increase by 20–40%) and hence increasing ozone produc-tion. In the mid and lower troposphere, ozone decreased by ∼5% in wCO2. In less-polluted regions, such as the tropics, the ozone decrease is attributable to the reduction in NOx
transported by isoprene oxidation products (NOxlevels
de-crease by 10–15%). Over more polluted regions, where NOx
is more efficiently recycled from isoprene nitrates due to the higher oxidising capacity, the drop in ozone levels is due to lower peroxy radical concentrations in wCO2 compared to noCO2, reducing ozone production.
Overall, Table 1 shows that the tropospheric ozone bur-dens of noCO2 and wCO2 were almost the same, indicat-ing that increases and decreases in ozone concentration ap-proximately balance. Likewise for the tropospheric ozone
budget terms, Table 1 shows that difference between wCO2 and noCO2 for the globally integrated production and loss terms is small, disguising larger regional differences. For instance, the difference in boundary layer ozone production between wCO2 and noCO2 ranges from +/−50%, with the increases and decreases following the pattern outlined for surface ozone above. Further discussion on the relation-ship between isoprene and the tropospheric ozone budget can be found in Wu et al. (2007), as well as Young (2007) for UM CAM.
The results from this study can be compared to two other studies that investigated the relationship between late 21st century ozone levels and isoprene emission changes, also us-ing the SRES A2 scenario. The presence of both decreases and increases in future surface ozone, due to the regionally heterogeneous effect of isoprene on atmospheric chemistry, are not reported by Sanderson et al. (2003) or Hauglustaine et al. (2005), who found near universal increases in ozone wher-ever isoprene increases. Part of the reason for the difference between the simulations may arise from the treatment of iso-prene nitrates, which were identified as the major source of systematic difference between chemical mechanisms of dif-ferent models by P¨oschl et al. (2000). The chemical scheme of Sanderson et al. (2003) does not include the formation of isoprene nitrates from the isoprene-peroxy+NO reaction (Collins et al., 1999), excluding this sink for NOx. The
oxi-dation mechanism of Hauglustaine et al. (2005) recycles NOx
from isoprene nitrates at a 15% faster rate than in our model (Folberth et al., 2006 versus P¨oschl et al., 2001), reducing their efficacy as a NOxsink and potentially leading to higher
ozone levels. However, a UM CAM model integration us-ing 3 times faster NOxrecycling than the BASE simulation
(not shown) (as per Horowitz et al., 2007) resulted in<5% increases in ozone. Furthermore, compared to a present-day UM CAM integration without isoprene emissions included, both this sensitivity simulation and BASE simulation show similar magnitude decreases in ozone over non-polluted trop-ical regions. Overall, whilst the treatment of isoprene nitrates might explain some of the differences between this model study and that of Hauglustaine et al. (2005), there are clearly other model elements making a contribution. Although both models include wet and dry depositional losses for isoprene nitrates, there are no data presented in Folberth et al. (2006) to compare the UM CAM parameters against.
the South-Eastern USA, which they attribute to decreased isoprene ozonolysis and isoprene nitrate chemistry. Houwel-ing et al. (1998), Roelofs and Lelieveld (2000) and Pfister et al. (2008) all also report tropical ozone decreases (especially over the Amazon) when comparing runs with and without isoprene emissions included. Houweling et al. (1998) as-sumed no wet depositional loss of isoprene nitrates, as well as a low dry deposition velocity (the same as PAN). But as they used a low rate constant for isoprene nitrates with OH (∼7 times lower than used here), their effectiveness as a NOx-sink is increased. Roelofs and Lelieveld (2000)
as-sumed that isoprene nitrates quickly react to produce nitric acid, which makes them an effective NOx-sink (due to the
high solubility of nitric acid). Pfister et al. (2008) used an iso-prene nitrate+OH rate constant∼3.5 times faster than used in UM CAM (as well as including an additional reaction with ozone), and parameterised isoprene nitrate wet deposition by mapping the species onto nitric acid; there is no information on the dry deposition velocity.
Clearly there are many additional differences in both the model chemistry schemes and the underlying climate mod-els/meteorological data (that drive emissions and control chemical reaction rates) that can lead to the range of re-sponses published to date. For instance, von Kuhlmann et al. (2004) investigated the sensitivity of their model results to different isoprene oxidation mechanisms, reporting effects as large as 20–60% on surface ozone over isoprene source re-gions. The differences between studies underline both the need to investigate sensitivities and constraints of isoprene nitrate chemistry (von Kuhlmann et al., 2004; Horowitz et al., 2007) as well as to conduct multi-model ensemble stud-ies (e.g. Stevenson et al., 2005; Shindell et al., 2006).
Figure 3c compares the yearly average absolute ence between wCO2 and noCO2, with the absolute differ-ence between noCO2 and BASE (i.e. the total change be-tween the 2090s and present day as reported in studies that do not include the CO2impact on isoprene emission). As
has been observed in a number of previous other model ex-periments studies (e.g. Johnson et al., 1999; Zeng and Pyle, 2003; Hauglustaine et al., 2005; Zeng et al., 2008) altered anthropogenic emissions (mainly NOx) dominated the
fu-ture surface ozone projections overall. However, the differ-ence between wCO2 and noCO2 amounts to>20% of the noCO2-BASE difference in the continental outflows, and it is up to half the effect over the Western Amazon, highlight-ing the importance of isoprene chemistry in these regions. As well as emission perturbations, climate change also con-tributes to the impact on ozone. In UM CAM, the effect of climate change alone on the tropospheric ozone burden is a 3.5% reduction (Zeng et al., 2008), mainly attributable to an increased loss rate with the higher humidity in a warmer cli-mate.
90S 30S 0 30N 90N
1000 750 500 250
4.9 13.9 17.2 8.2
4.2 10.4 12.9 6.9
3.7 5.3 7.1 5.6
-9.6% -8.8% 1.0% -6.4% 4.5% 12.4% 14.4% 3.0% -3.8% 18.1% 17.1% -1.5%
-6.7% 1.7% 8.2% -0.5%
6.4% 20.6% 18.3% 6.2%
4.3% 37.2% 28.9% 6.1%
Year avg [OH] / 105 molec cm-3
Altitude / hPa
% difference: noCO2 - BASE wCO2 - BASE
Fig. 4.Air mass weighted, yearly average tropospheric OH concen-trations for the BASE simulation (black), calculated for the regions specified in Lawrence et al. (2001). The percentage differences be-tween noCO2 and BASE (blue) and wCO2 and BASE (red) are also shown.
5 Impact on OH concentrations
OH is the most important oxidizing agent in the troposphere, determining the rate of removal of many reduced gases, in-cluding methane. Tropospheric OH levels are uniformly higher in wCO2 compared to noCO2 (Fig. 4), as the rela-tively lower isoprene emission in the former reduced the OH sink (e.g. see also Spivakovsky et al. (2000) and Pfister et al., 2008). Figure 4 shows that the largest relative difference between wCO2 and noCO2 OH levels was simulated in the tropical upper tropopause (UT), where, when averaged over 30 S–30 N and for 500–250 hPa, there was a 13% increase. Two reasons underlie this result (cf. zonal mean ozone): firstly, in wCO2 there was a decreased OH sink in the UT due to relatively lower concentrations of isoprene oxidation products in the convectively lifted air masses; and secondly, less lightning-produced NOx was sequestered by isoprene
oxidation products in wCO2 (tropical UT NOx levels were
20–35% higher in wCO2 compared to noCO2), increasing the efficiency of HO2to OH conversion (Spivakovsky et al.,
2000). There was also a large increase in the tropical lower troposphere OH concentrations in wCO2 (8%), mostly due to a decrease in the reaction rate of isoprene with OH. Globally, the average tropospheric OH concentration was 7.2% higher in wCO2 which reduced the tropospheric chemical lifetime of methane by∼7 months (Table 1), illustrating the indirect role in radiative forcing attributable to isoprene (Collins et al., 2002).
As for ozone, OH differences between BASE and noCO2 or BASE and wCO2 are the product of both climate change and changes in anthropogenic and isoprene emis-sions. Changes in emissions have antagonistic effects, with NOx increases tending to increase OH (through increased
OH (by increasing the OH sink). In previous simulations with the UM CAM model, anthropogenic emission increases in the SRES A2 scenario have led to an overall 17% increase in OH (Zeng et al., 2008). A warmer climate increases OH production, due to increased humidity. In the present sim-ulations the signal of climate on OH was calculated from two wCO2 runs, one with SSTs, sea-ice and well-mixed greenhouse gas concentrations as in BASE (wCO2 p) and the other as described in Sect. 3 (wCO2). Comparing these sim-ulations showed that climate change led to a 7.6% increase in the average OH concentration (wCO2 – wCO2 p). This is comparable to the difference calculated between wCO2 and noCO2; in fact the signal from the change in isoprene emis-sions was similar in magnitude to the climate change signal throughout most of the lower troposphere and the tropical UT. Of course, the result of climate change is regionally het-erogeneous and influences many other reaction rates and me-teorological parameters relevant to atmospheric chemistry.
6 Conclusions
Biogenic emissions are important uncertainties in future at-mospheric chemistry and climate even in a scenario with strong anthropogenic emission changes. The direct isoprene-CO2interaction significantly alters surface ozone
concentra-tions, especially in the tropics, which is important for future air quality projections. The projected tropospheric OH lev-els are also significantly affected, with the relatively lower isoprene emission, in simulations that accounted for the in-hibitory effect of increasing CO2concentration, reducing the
methane lifetime notably. However, whether the ozone bur-den increases or decreases depends on the region, illustrat-ing the problems of expressillustrat-ing climate effects of reactive traces gases based on global total burden or global tive forcing. In our calculations the overall ozone radia-tive effect presumably would be small, but the global totals hide a possible cooling effect in some areas and a warming in others (although not necessarily geographically aligned with the changes in ozone, Shindell et al., 2007). Other re-gional impacts due to long-range transport of reaction prod-ucts (e.g. PAN) or the indirect climate effect on methane lifetime are also difficult to take into account with exist-ing climate change metrics. Ways forward may be to break global warming potentials (GWPs) into distinct regional val-ues and/or to use novel calculations like global temperature change potentials (GTPs) (Rypdal et al., 2005; Shine et al., 2005) of short-lived species that may also be compared rela-tive to that of CO2(Boucher and Reddy, 2008).
Our results have demonstrated the different response of at-mospheric chemical models to isoprene emissions, namely that the globally averaged response of UM CAM to less iso-prene emissions is an increase in ozone, rather than the de-crease noted by some other studies (Sanderson et al., 2003; Hauglustaine et al., 2005). Whilst we have tried to rationalise
the differences by appealing to differences in the model iso-prene schemes, there is a need to better quantify the differ-ences between atmospheric chemical models and their con-stituent parts. Initial work in this direction has been com-pleted by studies such as Mallet and Sportisse (2006), who conducted an ensemble simulation of ozone by substituting different values for parameters such as turbulent closure and the model resolution, though further work is needed to ex-pand this effort to different model systems. Clearly, the models are also limited in their ability to represent isoprene chemistry accurately and new mechanisms (e.g. Butler et al., 2008) need to interface with new laboratory measurements for evaluation
In this experiment, we only highlight one of the many un-certainties in the overall response of future BVOC emissions, atmospheric chemistry and climate. A number of additional factors will also affect future BVOC emissions. Firstly, fu-ture land use and land cover change is likely to alter emis-sions substantially, particularly in tropical ecosystems where conversion of rainforest, woodlands and savannahs into agri-cultural ecosystems will decrease isoprene and monoterpene emissions (Lathi`ere et al., 2006). Furthermore, the net ef-fect of interactions between BVOC emissions, tropospheric ozone and plant productivity are as yet unresolved. Ozone is phototoxic and reduces photosynthesis and net carbon up-take (Sitch et al., 2007). However, some studies have shown that isoprene and monoterpene emissions may help plants to withstand the phytotoxic effects (Loreto and Velikova, 2001; Fares et al., 2008). How these additional interactions affect biogenic emission projections and atmospheric chemistry re-mains to be tested.
Acknowledgements. PY, JP and GZ acknowledge funding from the National Centre for Atmospheric Science (NCAS) and thank the Hadley Centre for use of the UM. AA and GS acknowledge support from the European Commission, Swedish Formas and the Swedish Research Council.
Edited by: J. Rinne
References
Arneth, A., Niinemets, U., Pressley, S., B¨ack, J., Hari, P., Karl, T., Noe, S., Prentice, I. C., Serc¸a, D., Hickler, T., Wolf, A., and Smith, B.: Process-based estimates of terrestrial ecosystem iso-prene emissions: Incorporating the effects of a direct isoiso-prene CO2-isoprene interaction, Atmos. Chem. Phys., 7, 31–53, 2007a,
http://www.atmos-chem-phys.net/7/31/2007/.
Arneth, A., Miller, P. A., Scholze, M., Hickler, T., Schurg-ers, G., Smith, B., and Prentice, I. C.: CO2 inhibition of
global terrestrial isoprene emissions: Potential implications for atmospheric chemistry, Geophys. Res. Lett., 34, L18813, doi:10.1029/2007GL030615, 2007b.
Chem. Phys., 8, 4605–4620, 2008,
http://www.atmos-chem-phys.net/8/4605/2008/.
Atkinson, R. and Arey, J.: Gas-phase tropospheric chemistry of bio-genic volatile compounds: A review, Atmos. Environ., 37, 197– 219, 2003.
Bey, I., Jacob, D. J., Yantosca, R. M., Logan, J. A., Field, B. D., Fiore, A. M., Li, Q., Liu, H. Y., Mickley, L. J., and Schultz, M. G.: Global modeling of tropospheric chemistry with assim-ilated meteorology: Model description and evaluation, J. Geo-phys. Res., 106, 23073-23096, 2001.
Boucher, O. and Reddy, M. S.: Climate trade-off between black carbon and carbon dioxide, Energy Policy, 36, 193–200, 2008. Buckley, P. T.: Isoprene emissions from a Florida scrub oak species
grown in ambient and elevated carbon dioxide, Atmos. Environ., 35, 631–634, 2001.
Butler, T. M., Taraborrelli, D., Br¨uhl, C., Fischer, H., Harder, H., Martinez, M., Williams, J., Lawrence, M. G., and Lelieveld, J.: Improved simulation of isoprene oxidation chemistry with the ECHAM/MESSy chemistry-climate model: Lessons from the GABRIEL field campaign, Atmos. Chem. Phys., 8, 4529–4546, 2008,
http://www.atmos-chem-phys.net/8/4529/2008/.
Centritto, M., Nascetti, P., Petrilli, L., Raschi, A., and Loreto, F.: Profiles of isoprene emission and photosynthetic parameters in hybrid poplars exposed to free-air CO2enrichment, Plant Cell
Environ., 27, 403–412, 2004.
Chen, X., Hulbert, D. and Shepson, P. B.: Measurement of the or-ganic nitrate yield from OH reaction with isoprene, J. Geophys. Res., 103, 25563–25568, 1998.
Collatz, G. J., Ball, J. T., Grivet, C., and Berry, J. A.: Physiologi-cal and environmental regulation of stomatal conductance, pho-tosynthesis and transpiration: A model that includes a laminar boundary layer, Agr. Forest Meteorol., 54, 107–136, 1991. Collins, W. J., Stevenson, D. S., Johnson, C. E., and Derwent,
R. G.:, Role of convection in determining the budget of odd-hydrogen in the upper troposphere, J. Geophys. Res., 104, 26927–26941, 1999.
Collins, W. J., Derwent, R. G., Johnson, C. E., Sanderson, M. G., and Stevenson, D. S.: The oxidation of organic compounds in the troposphere and their global warming potentials, Clim. Change, 52, 453-479, 2002.
Dentener, F., Stevenson, D., Cofala, J., Mechier, R., Amann, M., Bergamaschi, P., Raes, F., and Derwent, R.: The impact of air pollutant and methane emission controls on tropospheric ozone and radiative forcing: CTM calculations for the period 1990– 2030, Atmos. Chem. Phys., 5, 1731–1755, 2005,
http://www.atmos-chem-phys.net/5/1731/2005/.
Edwards, J. M. and Slingo, A.: Studies with a flexible new radiation code. 1: Choosing a configuration for a large-scale model, Quart. J. Roy. Meteor. Soc., 122, 689–719, 1996.
Fares, S., Loreto, F., Kleist, E., and Wildt, J.: Stomatal uptake and stomatal deposition of ozone in isoprene and monoterpene emit-ting plants, Plant Biol., 10, 44–54, 2008.
Farquhar, G. D., von Caemmerer, S., and Berry, J. A.: A biochem-ical model of photosynthetic CO2assimilation in leaves of C3
species, Planta, 149, 78–90, 1980.
Fiore, A. M., Horowitz, L. W., Purves, D. W., Levy II, H., Evans, M. J., Wang, Y., Li, Q., and Yantosca, R. M.: Evaluating the contri-bution of changes in isoprene emissions to surface ozone trends
over the eastern United States, J. Geophys. Res., 110, D12303, doi:10.1029/2004JD005485, 2005.
Folberth, G. A., Hauglustaine, D. A., Lathi`ere, J., and Brocheton, F.:, Interactive chemistry in the Laboratoire de M´et´eorologie Dy-namique general circulation model: Model description and im-pact analysis of biogenic hydrocarbons on tropospheric chem-istry, Atmos. Chem. Phys., 6, 2273–2319, 2006,
http://www.atmos-chem-phys.net/6/2273/2006/.
Giannakopoulos, C.: Modelling the impact of physical and removal processes on tropospheric chemistry, Ph.D. Thesis, Univ. Cam-bridge, 1998.
Guenther, A.: The contribution of reactive carbon emissions from vegetation to the carbon balance of terrestrial ecosystems, Chemosphere, 49, 837–844, 2002.
Guenther, A., Hewitt, C. N., Erickson, D., Fall, R., Geron, C., Graedel, T., Harley, P., Klinger, L., Lerdau, M., McKay, W. A., Pierce, T., Scoles, B., Steinbrecher, R., Tallaamraju, R., Taylor, J., and Zimmerman, P.: A global model of natural volatile or-ganic compound emissions, J. Geophys. Res., 100, 8873–8892 1995.
Hauglustaine, D. A., Lathi`ere, J., Szopa, S., and Folberth, G. A.: Future tropospheric ozone simulated with a chemistry-climate-biosphere model, Geophys. Res. Lett., 32, L24807, doi:10.1029/2005GL02031, 2005.
Haxeltine, A. and Prentice, I. C.: A general model for the light-use efficiency of primary production, Funct. Ecol., 10, 551–561, 1996.
Hickler, T., Smith, B., Prentice, I. C., Mj¨ofors, K., Miller, P., Arneth, A., and Sykes, M.: CO2fertilization in
tem-perate face experiments not representative of boreal and tropical forests, Global Change Biol., 14, 1–12, doi:10.1111/j.1365-2486.2008.01598.x, 2008.
Horowitz, L. W., Liang, J., Gardner, G. M., and Jacob, D. J.: Ex-port of reactive nitrogen from North America during summer-time: Sensitivity to hydrocarbon chemistry, J. Geophys. Res., 103, 13451–13476, 1998.
Horowitz, L. W., Walters, S., Mauzerall, D. L., Emmons, L. K., Rasch, P. J., Grainier, C., Tie, X., Lamarque, J.-F., Schultz, M. G., Tyndall, G. S., Orlando, J. J., and Brasseur, G. P.: A global simulation of tropospheric ozone and related tracers: Description and evaluation of MOZART, version 2, J. Geophys. Res., 108, 4784, doi:10.1029/2002JD002853, 2003.
Horowitz, L. W., Fiore, A. M., Milly, G. P., Cohen, R. C., Perring, A., Wooldridge, P. J., Hess, P. G., Emmons, L. K., and Lamar-que, J.-F.: Observational constraints on the chemistry of isoprene nitrates over the eastern United States, J. Geophys. Res., 112, D12S08, doi:10.1029/2006JD007747, 2007.
Houweling, S., Dentener, F., and Lelieveld, J.: The impact of non-methane hydrocarbon compounds on tropospheric photochem-istry, J. Geophys. Res., 103, 10673–10696, 1998.
Johns, T. C., Gregory, J. M., Ingram, W. J., Johnson, C. E., Jones, A., Lowe, A. J., Mitchell, J. F. B., Roberts, D. L., Sexton, D. M. H., Stevenson, D. S., Tett, S. F. B., and Woodage, M. J.: An-thropogenic climate change for 1860 to 2100 simulated with the HadCM3 model under updated emissions scenarios, Clim. Dyn., 20, 583–612, 2003.
18645, 1999.
Kwok, E. S. C. and Atkinson, R.: Estimation of hydroxyl radical reaction rate constants for gas-phase organic compounds using a structure activity relationship: An update, Atmos. Environ., 29, 1685–1695, 1995.
Lathi`ere, J., Hauglustaine, D. A., Friends, A. D., De Noblet-Ducondr´e, N., Viovy, N., and Folberth, G. A.: Impact of climate variability and land use changes on global biogenic volatile or-ganic compound emissions, Atmos. Chem. Phys., 6, 2129–2146, 2006,
http://www.atmos-chem-phys.net/6/2129/2006/.
Law, K. S., Plantevin, P.-H., Shallcross, D. E., Rogers, H. J., Pyle, J. A., Grouhel, C., Thouret, V., and Marenco, A.: Evaluation of modelled O3using Measurement of Ozone by Airbus In-Service
Aircraft (MOZAIC) data, J. Geophys. Res., 103, 25721–25737, 1998.
Lawrence, M. G., J¨ockel, P., and von Kuhlmann, R.: What does the global mean OH concentration tell us? Atmos. Chem. Phys., 1, 37–49, 2001,
http://www.atmos-chem-phys.net/1/37/2001/.
Li, D. and Shine, K. P.: A 4-D ozone climatology for UGAMP mod-els, Univ. Global Atmospheric Modelling Project Internal Report 35, UK, 1995.
Lichtenthaler, H. K.: The 1-deoxy-d-xylulose-5-phosphate pathway of isoprenoid biosynthesis in plants, Ann. Rev. Plant Phys., 50, 47–65, 1999.
Loreto, F. and Velikova, V.: Isoprene produced by leaves protects the photosynthetic apparatus against ozone damage, quenches ozone products, and reduces lipid peroxidation of cellular mem-branes, Plant. Physiol., 127, 1781–1787, 2001.
Loreto, F., Fischbach, R. J., Schnitzler, J.-P., Ciccioli, P., Brancale-oni, E., Calfapietra, C., and Seufert, G.: Monoterpene emission and monoterpene synthase activities in the Mediterranean ever-green oakQuercus ilexl. Grown at elevated CO2concentrations,
Global Change Biol., 7, 709–717, 2001.
Mallet, V. and Sportisse, B.: Uncertainty in a chemistry-transport model due to physical parameterizations and numerical approx-imations: An ensemble approach applied to ozone modeling, J. Geophys. Res., 111, D01302, doi:10.1029/2005JD006149, 2006 Monson, R. K. and Fall, R.: Isoprene emission from aspen leaves: Influence of environment and relation to photosynthesis and pho-torespiration, Plant Physiol., 90, 267–274, 1989.
Monson, R. K., Trahan, N., Rosenstiel1, T. N., Veres, P., Moore, D., Wilkinson, M., Norby, R. J., Volder, A., Tjoelker, M. G., Briske, D. D., Karnosky, D. F. and Fall, R.: Isoprene emission from ter-restrial ecosystems in response to global change: Minding the gap between models and observations, Phil. Trans. R. Soc. A, 365, 1677–1695, 2007.
Moxim, W. J., Levy II, H. and Kasibthala, P. S.: Simulated global tropospheric PAN: Its transport and impact on NOx, J. Geophys.
Res., 101, 12,621-12,638, 1996.
Nakicenovic, N., Alcamo, J., Davis, G., et al.: Special Report on Emissions Scenarios, Cambridge Univ. Press, New York, USA, 2000.
Niinemets, U., Tenhunen, J. D., Harley, P. C., and Steinbrecher, R.: A model of isoprene emission based on energetic require-ments for isoprene synthesis and leaf photosynthetic properties forLiquidambar and Quercus, Plant Cell Environ., 22, 1319– 1335, 1999.
Parker, D. E., Jackson, M., and Horton, E. B.: The GISST 2.2 sea-surface temperature and sea ice climatology, Climate Res. Tech. Note 63, Hadley Centre, Met Office, Exeter, UK, 1995. Pfister, G. G., Emmons, L. K., Hess, P. G., Lamarque, J.-F.,
Orlando, J. J., Walters, S., Guenther, A., Palmer, P. I., and Lawrence, P. J.: Contribution of isoprene to chemical budgets: A model tracer study with the NCAR CTM MOZART-4, J. Geo-phys. Res., 113, D05308, doi:10.1029/2007JD008948, 2008. Pope, V. D., Gallani, M. L., Rowntree, P. R., and Stratton, R. A.:
The impact of new physical parameterizations in the Hadley Cen-tre climate model: HadAM3, Clim. Dyn., 16, 123–146, 2000. P¨oschl, U., von Kuhlmann, R., Poisson, N., and Crutzen, P. J.:
De-velopment and intercomparison of condensed isoprene oxidation mechanisms for global atmospheric modeling, J. Atmos. Chem., 37, 29–52, 2000.
Possell, M., Hewitt, C. N., Ayres, E., and Kerstiens, G.: Interactive effects of elevated CO2and soil fertility on isoprene emissions fromQuercus robur, Glob. Change Biol., 10, 1835–1843, 2004. Possell, M, Hewitt, C. N. and Beerling, D. J.: The effects of glacial
atmospheric CO2concentrations and climate on isoprene
emis-sions by vascular plants, Global Change Biol., 11, 60–69, 2005. Rapparini, F., Baraldi, R., Miglietta, F., and Loreto, F.: Isoprenoid
emission in trees ofQuercus pubescensandQuercus ilexwith lifetime exposure to naturally high CO2environment, Plant Cell
Environ., 27, 381–391, 2004.
Roelofs, G.-J. and Lelieveld, J.: Tropospheric ozone simulation with a chemistry-general circulation model: Influence of higher hydrocarbon chemistry, J. Geophys. Res., 105, 22697–22712, 2000.
Rosenstiel, T. N., Potosnak, M. J., Griffin, K. L., Fall, R., and Mon-son, R. K.: Increased CO2uncouples growth from isoprene
emis-sion in an agriforest ecosystem, Nature, 421, 256–259, 2003. Rypdal, K., Berntsen, T., Fuglestvedt, J. S., Aunan, K., Torvanger,
A., Stordal, F., Pacyna, J. M., and Nygaard, L. P.: Tropospheric ozone and aerosols in climate agreements: Scientific and politi-cal challenges, Environ. Sci. Policy, 8, 29–43, 2005.
Sanderson, M. G., Jones, C. D., Collins, W. J., Johnson, C. E., and Derwent, R. G.: Effect of climate change on isoprene emis-sions and surface ozone levels, Geophys. Res. Lett., 30, 1936, doi:10.1029/2003GL017642, 2003.
Scholefield, P. A., Doick, K. J., Herbert, B. M. J., Hewitt, C. N. S., Schnitzler, J. P., Pinelli, P., and Loreto, F.: Impact of rising CO2 on emissions of volatile organic compounds: Isoprene emission fromPhragmites australisgrowing at elevated CO2in a natural carbon dioxide spring, Plant Cell Environ., 27, 393–401, 2004. Sharkey, T. D., Loreto, F., and Delwiche, C. F.: High-carbon
diox-ide and sun shade effects on isoprene emission from oak and as-pen tree leaves, Plant Cell Environ., 14, 333–338, 1991. Shindell, D. T., Faluvegi, G., Stevenson, D. S., et al.:
Multi-model simulations of carbon monoxide: Comparison with ob-servations and projected near-future changes, J. Geophys. Res., 111, D19306, doi:10.1029/2006JD007100, 2006.
Shindell, D. T., Faluvegi, G., Bauer, S. E., Koch, D. M., Unger, N., Menon, S., Miller, R. L., and Schmidt, G. A. and Streets, D. G.: Climate response to projected changes in short-lived species un-der an A1B scenario from 2000-2050 in the GISS climate model, J. Geophys. Res., 112, D20103, doi:10.1029/2007JD008753, 2007.
Alternatives to the global warming potential for comparing cli-mate impacts of emissions of greenhouse gases, Clim. Change, 68, 281–302, 2005.
Sillman, S.: The relationship between ozone, NOxand
hydrocar-bons in urban and polluted rural environments, Atmos. Environ., 33, 1821–1845, 1999.
Sitch, S., Smith, B., Prentice, I., Arneth, A., Bondeau, A., Cramer, W., Kaplan, J. O., Levis, S., Lucht, W., Sykes, M. T., Thon-icke, K., and Venevsky, S.: Evaluation of ecosystem dynamics, plant geography and terrestrial carbon cycling in the LPJ dy-namic global vegetation model, Global Change Biol., 9, 161– 185, 2003.
Sitch, S., Cox, P. M., Collins, W. J., and Huntingford, C.: Indirect radiatve forcing of climate change through ozone effects on the land-carbon sink, Nature, 448, 791–794, 2007.
Smith, B., Prentice, I. C., and Sykes, M. T.: Representation of vegetation dynamics in the modelling of terrestrial ecosystems: comparing two contrasting approaches within European climate space, Global Ecol. Biogeogr., 10, 621–637, 2001.
Spivakovsky, C. M., Logan, J. A., Montzka, S. A., Balkanski, Y. J., Foreman-Fowler, M., Jones, D. B. A., Horowitz, L. W., Fusco, A. C., Brenninkmeijer, C. A. M., Prather, M. J., Wolfsy, S. C., and McElroy, M. B.: Three-dimensional climatological distribution of tropospheric OH: Update and evaluation, J. Geophys. Res., 105, 8931–8980, 2000.
Staudinger, J. and Roberts, P. V.: A critical compilation of Henry’s law constant temperature-dependent relations for organic com-pounds in dilute aqueous solutions, Chemosphere, 44, 561–576, 2001.
Stevenson, D. S., Dentener, F. J., Schultz, M. G., et al.: Mulitmodel ensemble simulations of present-day and near-future tropospheric ozone, J. Geophys. Res., 111, D08301, doi:10.1029/2005JD006338, 2006.
von Kuhlmann, R., Lawrence, M. G., Crutzen, P. J., and Rasch, P. J.: A model for studies of tropospheric ozone and nonmethane hydrocarbons: Model description and ozone results, J. Geophys. Res., 109, 4294, doi:10.1029/2002JD002893, 2003.
von Kuhlmann, R., Lawrence, M. G., P¨oschl, U., and Crutzen, P. J.: Sensitivities in the global scale modeling of isoprene, Atmos. Chem. Phys., 4, 1–17, 2004,
http://www.atmos-chem-phys.net/4/1/2004/.
Wang, K. Y. and Shallcross, D. E.: Modelling terrestrial biogenic isoprene fluxes and their potential impact on global chemical species using a coupled LSM-CTM model, Atmos. Environ., 34, 2909–2925, 2000.
Wang, Y., Jacob, D. J., and Logan, J. A.: Global simulation of tro-pospheric O3-NOx-hydrocarbon chemistry. 3. Origin of
tropo-spheric ozone and effects of nonmethane hydrocarbons, J. Geo-phys. Res., 103, 10757–10767, 1998.
Wiedinmyer, C., Tie, X., Guenther, A., Neilson, R., and Granier, C.: Future changes in biogenic isoprene emissions: How might they affect regional and global atmospheric chemistry? Earth Interactions, 10, 1–19, 2006.
Wilkinson, M., Monson, R. K., Trahan, N., Lee, S., Brown, E., Jackson, R. B., Polley, H. W., and Fall, R.: Isoprene emission rate as a function of atmospheric CO2concentration, Global Change
Biol., 15, 1189–1200, 2009.
Wu, S., Mickley, L. J., Jacob, D. J., Logan, J. A., Yantosca, R. M., and Rind, D: Why are there large differences between model sin global budgets of tropospheric ozone?, J. Geophys. Res., 112, D05302, doi:10.1029/2006JD007081, 2007.
Young, P. J.: The influence of biogenic isoprene emissions on mospheric chemistry: A model study for present and future at-mospheres, PhD Thesis, University of Cambridge, UK, 2007. Zeng, G. and Pyle, J. A.: Changes in tropospheric ozone between
2000 and 2100 modeled in a chemistry-climate model, Geophys. Res. Lett., 30, 1392, doi:10.1029/2002GL016708, 2003. Zeng, G. and Pyle, J. A.: Influence of El Ni˜no Southern
Os-cillation on stratosphere/troposphere exchange and the global tropospheric ozone budget, Geophys. Res. Lett., 32, L01814, doi:10.1029/2004GL021353, 2005.
Zeng, G., Pyle, J. A., and Young, P. J.: Impact of climate change on tropospheric ozone and its global budgets, Atmos. Chem. Phys., 8, 369–387, 2008,