www.biogeosciences.net/9/3777/2012/ doi:10.5194/bg-9-3777-2012
© Author(s) 2012. CC Attribution 3.0 License.
Biogeosciences
Contribution of flowering trees to urban atmospheric biogenic
volatile organic compound emissions
R. Baghi1,2, D. Helmig1, A. Guenther3, T. Duhl3, and R. Daly1
1Institute of Arctic and Alpine Research, University of Colorado, Boulder, CO 80309, USA 2Laboratoire d’A´erologie, Universit´e de Toulouse, France
3National Center for Atmospheric Research, Boulder, CO 80307, USA
Correspondence to:D. Helmig ([email protected])
Received: 13 January 2012 – Published in Biogeosciences Discuss.: 15 March 2012 Revised: 4 July 2012 – Accepted: 13 September 2012 – Published: 5 October 2012
Abstract.Emissions of biogenic volatile organic compounds
(BVOC) from urban trees during and after blooming were measured during spring and early summer 2009 in Boulder, Colorado. Air samples were collected onto solid adsorbent cartridges from branch enclosures on the tree species crabap-ple (Malus sp.), horse chestnut (Aesculus carnea, “Ft. Mc-Nair”), honey locust (Gleditsia triacanthos, “Sunburst”), and hawthorn (Crataegus laevigata, “Pauls Scarlet”). These species constitute∼65 % of the insect-pollinated fraction of
the flowering tree canopy (excluding catkin-producing trees) from the street area managed by the City of Boulder. Samples were analyzed for C10–C15 BVOC by thermal desorption and gas chromatography coupled to a flame ionization detec-tor and a mass spectrometer (GC/FID/MS). Identified emis-sions and emission rates from these four tree species during the flowering phase were found to vary over a wide range. Monoterpene emissions were identified for honey locust, horse chestnut and hawthorn. Sesquiterpene emissions were observed in horse chestnut and hawthorn samples. Crabap-ple flowers were found to emit significant amounts of ben-zyl alcohol and benzaldehyde. Floral BVOC emissions in-creased with temperature, generally exhibiting exponential temperature dependence. Changes in BVOC speciation dur-ing and after the flowerdur-ing period were observed for every tree studied. Emission rates were significantly higher dur-ing the bloomdur-ing compared to the post-bloomdur-ing state for crabapple and honey locust. The results were scaled to the dry mass of leaves and flowers contained in the enclosure. Only flower dry mass was accounted for crabapple emis-sion rates as leaves appeared at the end of the flowering pe-riod. Total normalized (30◦C) monoterpene emissions from
honey locust were higher during flowering (5.3 µgC g−1h−1)
than after flowering (1.2 µgC g−1h−1). The total
normal-ized BVOC emission rate from crabapple (93 µgC g−1h−1)
during the flowering period is of the same order as iso-prene emissions from oak trees, which are among the high-est BVOC flowering period floral emissions observed from plants to date. These findings illustrate that during the rela-tively brief springtime flowering period, floral emissions con-stitute by far the most significant contribution to the BVOC flux from these tree species, some of which are leafless at this time. Experimental results were integrated into the MEGAN biogenic emission model and simulations were performed to estimate the contribution of floral BVOC emissions to the to-tal urban BVOC flux during the spring flowering period. The floral BVOC emitted during this three-month simulation are equivalent to 11 % of the integrated monoterpene flux for the Boulder urban area.
1 Introduction
Volatile organic compounds (VOC) play an important role in atmospheric chemistry, in particular in secondary pollutant formation (e.g., tropospheric ozone and secondary organic aerosols) (Andreae and Crutzen, 1997). Biogenic VOC emis-sions (BVOC) from vegetation comprise ∼90 % of global
and weather conditions. Seasonal changes are not well un-derstood and are thus difficult to account for. In particular, BVOC emissions from flowers during the blooming period are generally not considered. Ornamental vegetation with colorful and/or fragrant flowers is often planted to brighten up urban areas. This general vegetation group contributes to VOC concentrations to an extent that could potentially im-pact air quality. To our knowledge only three studies in the literature have addressed the possibility of increased atmo-spheric VOC during the blooming period (Arey et al., 1991; Ciccioli et al., 1999; M¨uller et al., 2002). Flower volatiles have been widely studied in botanical research for their role in plant-pollinator and plant-herbivore interactions. There-fore, an abundant body of literature on BVOC emissions from flowers is available. However, most studies on flo-ral BVOC emissions report only qualitative results. A sum-mary of this literature is presented in Table 1 in the Sup-plement. A few studies report emission rates, but it is dif-ficult to incorporate them into quantitative models. For ex-ample, Baraldi et al. (1999) and Rapparini et al. (2001) report emission rates in µg per 100 flowers h−1. Ibrahim
et al. (2010) detected significantly higher isoprene and monoterpene emission rates from flower branches compared to vegetative branches of Yeheb tree (Cordeauxiaedulis) and express these findings in µg (g dry weight)−1h−1. M¨uller et al. (2002) reported terpene fluxes from flowering rape plants of 16–32 µg m−2(ground area) h−1, and Rodriguez-Sanoa et
al. (2011) observed a mean volatile production of 48.6 ng h−1
per flower of blueberry.
The review of this literature demonstrates that there is a significant amount of BVOC emitted by flowers and that there is a high variability in emissions. There seems to be a common pattern in that there are higher VOC emission rates from flowering branches than vegetative branches (Arey et al., 1991; Ibrahim et al., 2010). These issues motivated us to study the floral emissions from urban trees in the City of Boulder and their contribution to the urban BVOC flux to as-sess the potential effect of flowering tree emissions on urban air quality.
2 Experimental
2.1 Site description
The field site was located in the CreekSide Tree Nursery in Boulder, Colorado, USA. An enclosed trailer sitting within the tree nursery was used as a mobile field laboratory. Flow-ering trees were provided by the nursery during the mea-surement period corresponding to the blooming season. Four tree species were studied: crabapple (Malus sp.), hawthorne (Crataegus laevigata, “Pauls Scarlet”), horse chestnut (Aes-culus carnea, “Ft. McNair”), and honey locust (Gleditsia triacanthos, “Sunburst”). Together, honey locust, crabapple and hawthorn represent∼65 % of the insect pollinated,
non-catkin-producing flowering tree canopy in the City of Boul-der according to a municipal tree resource analysis report from the City of Boulder (City of Boulder, 2005; see Sup-plement Table 2), while horse chestnut represents less than 1 %. Only those flowering species present in the urban tree inventory that produce conspicuous, showy floral structures and are assumed to be insect pollinated were considered for screening. The rationale for this sampling decision was that these tree species would be most likely to invest resources into floral BVOC production for the purpose of pollinator attraction. The remaining 35 % of the insect-pollinated, non-catkin-producing flowering tree species in Boulder is com-prised of 9 species, which were not screened during the course of this study, in part because of limitations in the number of branch enclosure experiments that could be op-erated simultaneously at the time of the study, and also be-cause specimens were not available for screening at the tree nursery during the sampling campaign. All investigated trees were between 2 and 3 m tall and between 3 and 5 yr old. They were kept in their planting pots during the experiments.
2.2 Sampling
Sampling methods and materials used for the BVOC emis-sion measurements followed the procedures recommended in Ortega and Helmig (2008). The studied vegetation was enclosed in a Tedlar bag with minimal contact of foliage and flowers with the bag. The bag was attached at the branch base with a Velcro strap. Ambient air was filtered for particles (respirator filter, Mersorb, Part no. 463532, Mine Safety Appliances Company, Pittsburgh, PA) and scrubbed of ozone (cartridge with MnO2-coated screens, O.B.E. Corp. Fredericks-burg, TX) and pumped at 25 l min−1into the
en-closure providing a slight overpressure inside the bag. The turnover time inside the enclosure was estimated as 2.0 to 2.5 min. A cold trap was used to reduce moisture and cool the air pumped into the enclosure. A small flow of a 5-component reference standard mixture, spanning a wide volatility range was doped into the purge air to serve as a reference for tracing compound recovery rates from the ex-periment (Ortega and Helmig, 2008). The standard was com-posed of 5 aromatic compounds including toluene, isopropyl-benzene, tetrahydronaphthalene, tri-isopropyl-benzene and n-nonyl-benzene, and concentrations were determined us-ing a gas chromatograph calibrated with a multi-component-alkane gas standard as described in Helmig et al. (2003). The aromatic mixture was introduced in the main purge flow at a mass flow-controlled rate of 6.5 ml min−1. The
multi-adsorbent bed composed of half TenaxGR (Buchem BV, Apeldoorn, The Netherlands) and half Carboxen 1016 (Supelco, Bellefonte, PA, USA). A second adsorbent car-tridge (breakthrough carcar-tridge) was placed in series with every 10th sample cartridge. Analysis of the breakthrough cartridges was used to ensure that sampled compounds did not make their way through the primary adsorbent cartridge. Sampling flow was 200 ml min−1 for a typical sample
vol-ume of 12 l.
One tree of each species was selected for this study. For each tree, a single branch was chosen to be sampled repeat-edly over the course of the study. The enclosure was installed as carefully as possible to minimize any disturbance effects. Figure 1 shows a picture of the enclosure setup for one of the crabapple experiments. Sampling on a branch enclosure started no sooner than six hours after the enclosure was in-stalled. This delay allowed the plant and the enclosure to reach an equilibrium state, and also allowed for any stress-induced emissions caused by the installation of the enclosure to subside (Tarvainen et al., 2005). Sampling times varied from one hour during daytime to 2 h during nighttime. Two sets of enclosure equipment were used simultaneously when several trees were blooming at the same time. Approximately 400 samples were collected over the course of this study, from 16 April to 19 June 2009: 99 samples on hawthorn, 40 on crabapple, 145 on chestnut, and 70 samples on honey lo-cust. In addition, 20 samples of the inlet purge air were col-lected to allow for a comparison of the aromatic reference standard recovery rates from the experiment. For each tree a second set of emission samples was collected once flowers had withered to obtain reference measurements of the foliar BVOC emissions from each species after the flowering pe-riod had ended.
Samples collected at the field site were brought back to the laboratory and stored in a freezer for 1 to 2 days before being analysed. Thermal desorption using a Perkin-Elmer ATD 400 allowed the sample to be transferred from the car-tridge to a GC (Model 5890, Hewlett-Packard). Separation was achieved on a 0.32 mm i.d., 50 m long, 5 µm film thick-ness DB-1 capillary column (Agilent). Analyte identification and quantification were performed using a mass spectrometer (Model 5970, Hewlett-Packard) and flame ionization detec-tor (FID) after splitting the column flow. Similar instrumen-tation and calibration procedures have been described previ-ously (Helmig et al., 2004b; Ortega et al., 2008). Compound identification was achieved using relative retention times, along with comparing mass spectra with the NIST database and Adams (1989). All quantifications were performed using the FID signals. The typical limit of detection of the system during this study was 50 pptv and the typical accuracy was
∼10 %. Isoprene (which previously has not been reported
as a major floral emission) was not quantified as it was not sufficiently retained under the chosen GC conditions. Quan-titative results are reported in mass of carbon (C).
Fig. 1.Branch enclosure experiment setup on a crabapple tree dur-ing its flowerdur-ing period.
2.3 Biomass dry weight determination
Dry biomass weight of the enclosed material is needed to normalize emission rates; however, cutting the branch for a weight estimate may stress the plant and induce an ab-normal emission response. Therefore, instead of harvesting the enclosed branch, blossoms on the branches investigated were counted, and an equivalent number of flowers were har-vested from another tree of the same species for flower dry weight estimation. After the experiment biomass dry weight determinations were made for both flowers and leaves of every tree studied, with leaves harvested from the sampled branches. Collected biomass was dried for 24 h in a 50◦C
oven.
2.4 Environmental monitoring
ambient air temperature. A thermocouple was placed in each bag to monitor the temperature inside the enclosure. BVOC and particularly sesquiterpenes are very reactive. It was therefore important that oxidant levels inside the enclosure were kept low. Ozone concentrations in the enclosure were measured regularly, and were usually below 2 ppbv. Environ-mental data were acquired at 1 s and averaged and recorded every 5 min using a Campbell Scientific CR10X datalogger (Campbell Scientific, Logan, UT, USA).
2.5 Normalized emission rate calculations
Temperature dependencies for emissions of monoterpenes, benzenyl alcohol and benzyl aldehyde, oxygenated monoter-penes, and sesquiterpenes were observed in this study. There was no obvious light dependency in observed emis-sions. Normalized emission rates, referred to here as basal emission rates (BER), were calculated for conditions of Ts=30◦C using the algorithm of Guenther et al. (1993);
E= BER[exp (β(T−Ts))], whereEis emission rate andT is leaf temperature.βwas derived from experimental results for each tree. The results for the flower dry weight and leaf biomass determination were used to normalize emission rates to the amount of biomass inside the enclosure. Since leaves had just started to develop on the crabapple by the end of the flowering period, only flower petal dry weight was consid-ered for normalizing emission rates. For the control exper-iments conducted after the flowering had subsided, the leaf biomass inside the enclosure was used to normalize emission rates.
2.6 Modeling
The Model of Emissions of Gases and Aerosols from Na-ture version 2.0 (MEGANv2.0) was applied for condi-tions in Boulder, Colorado, USA (latitude 40.0◦N, longitude
105.3◦W, elevation 1600 m), which is located at the border
of the Rocky Mountain and Central Plains ecoregions. Flo-ral and foliar BVOC emissions were estimated using a sin-gle grid version of MEGAN (Guenther et al., 2006), which is driven by both land cover data and environmental condi-tions. Land cover inputs included the City of Boulder tree in-ventory and an urban tree cover fraction estimate. Tree cover was estimated by analyzing high resolution land surface im-agery using the approach described by Duhl et al. (2011), whereby the Boulder area was divided into 900 cells (in this case, we selected a cell size of 10 s by 10 s; ∼0.73 km2).
350 cells located in residential, commercial/industrial, and city park land use classes within the city limits were ran-domly evaluated; average tree cover fraction was found to be 0.15. Tree species information for Boulder was derived from a municipal tree resource analysis report by Boulder foresters (City of Boulder, 2005). Since there were no data available for the tree species composition on private property, for the purpose of this study it was assumed to be the same as on city
property and BVOC emissions were assumed to be the same on public and private land throughout the city. Monoter-pene emissions were calculated for April to June 2009. Tem-perature and solar radiation inputs for MEGAN were ob-tained from a University of Colorado weather station (http: //foehn.colorado.edu/weather/atoc1/). Observed floral emis-sion rates were included in the model for honey locust and crabapple using the experimental results of this study, as to-gether these two species represent∼64 % of the fraction of
insect-pollinated flowering street trees in Boulder that pro-duce conspicuous flowers, and>13 % of total street trees (by number) according to the tree inventory. Hawthorn and horse chestnut trees did not exhibit significantly different sions during flowering as compared to non-flowering emis-sions and were therefore excluded from the simulations.
3 Results and discussion
Blooming occurred at different times for each tree species and lasted between 7 and 18 days. Figure 2 shows the flow-ering period (shaded) along with the sampling schedule for each species.
3.1 Emission results
BVOC emission rates varied significantly between vege-tation species. Identified floral emissions showed a strong dependence on temperature and consequently were much higher during the day. The following section provides results for each of the species investigated.
3.2 Crabapple
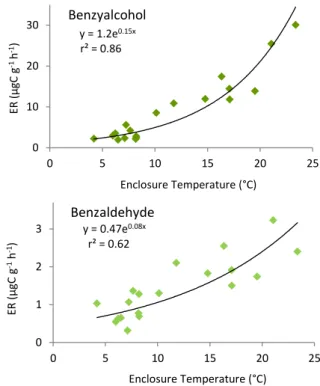
Crabapple flowers appeared first, in late April, at a time when leaves were still in the bud stage. Benzyl alcohol and bzaldehyde were the only volatiles identified from branch en-closure samples. Figure 3 shows emission rate results for a typical day for each compound and Fig. 4 depicts the tem-perature dependence of both compounds.
The averaged contribution of benzyl alcohol and benzalde-hyde to the overall emissions was 94 % and 6 %, respec-tively. The averaged total normalized emission rate during the flowering period was 93 µgC g−1h−1 (standard
devia-tion σ, determined by repeated experiments on the same branch, was 30 µgC g−1h−1). The emissions of both
Fig. 2.Blooming periods (marked in blue) for crabapple, horse chestnut, hawthorn, and honey locust trees investigated in 2009. Sample collection days are shown by green triangles.
0 10 20 30
0 10 20 30 40
5:00 7:00 9:00 11:00 13:00 15:00 17:00 19:00 21:00
Te
p
˚
C
a
d
PAR µ
ol
s
-1 m -2 / 100)
E
R (
μ
gC
g
-1 h -1)
Time of day (April 28, 2009)
benzylalcohol benzaldehyde Ambient T Enclosure T PAR
Fig. 3.Profile of benzyl alcohol and benzaldehyde emissions from crabapple for a day of measurements at full bloom with temperature inside the enclosure, ambient temperature and photosynthetically active radiation (PAR).
oak trees (Guenther et al., 1993; Sharkey et al., 1996; Geron et al., 2001). Benzenoids have been reported as abundant flo-ral scent emissions in a number of other studies on floflo-ral volatiles (Dudareva et al., 1998; Pichersky and Gershenzon, 2000; Van Schie et al., 2006). The results shown here in par-ticular agree with Loughrin et al. (1990), who also identified benzyl alcohol as well as benzaldehyde in apple flower emis-sions.
3.3 Horse chestnut
Compounds identified in the horse chestnut branch enclo-sure samples included thujene,α- andβ-pinene, camphene, β-myrcene,α- and γ-terpinene, o-cymene,β-phellandrene, terpinolene, 4-terpineol, methyl salicylate,α-terpineol, and limonene.
Figure S1 in the Supplement shows emission rate re-sults for a typical day for the major compounds emit-ted. Normalized emission rates were calculated using an empirically-derived β-factor of 0.20 for the flowering pe-riod and 0.21 after flowering (Fig. 6). The average total basal
y = 1.2e0.15x
r² = 0.86
0 10 20 30
0 5 10 15 20 25
E
R
(
µ
g
C
g
-1
h
-1)
Enclosure Temperature (°C)
Benzyalcohol
25
y = 0.47e0.08x
r² = 0.62
0 1 2 3
0 5 10 15 20 25
E
R
(
µ
g
C
g
-1 h -1)
Enclosure Temperature (°C)
Benzaldehyde
Fig. 4.Emission rates of benzyl alcohol and benzaldehyde during blooming as a function of air temperature inside the enclosure from a crabapple experiment.
0 10 20 30 40 50 60 70 80 90 100
during blooming after blooming
BE
R
(
µ
g
-C g
-1 h -1)
Benzylalcohol
Benzaldehyde
Fig. 5.Comparison of basal emission rates (30◦C) of benzylalco-hol and benzaldehyde from crabapple before and after the flowering period.
BVOC emission rate during flowering was 9.1 µgC g−1h−1
(σ=3.0 µgC g−1h−1), whereas after the flowering period
emissions reached 12 µgC g−1h−1 (σ
=6.3 µgC g−1h−1)
y = 0.018e0.20x
R² = 0.79
0 1 2 3 4 5 6 7 8
0 10 20 30
E R ( µ g g
-1 h -1)
Enclosure Temperature (°C) May 12 May 13 May 16 May 17 May 19 May 21
y = 0.015e0.21x R² = 0.75
0 1 2 3 4 5 6 7 8 9 10
0 10 20 30
E R ( µ g g
-1 h -1)
Enclosure Temperature (°C) May 29
June 6 June 9 June 11 June 13
Fig. 6.Emission rates (expressed as the sum of monoterpenes) from horse chestnut as a function of temperature during blooming (left), and after the end of the blooming period (right).
3.4 Honey locust
Forty samples were collected during the flowering pe-riod of the honey locust tree and twenty more samples were taken after flowering. Monoterpenes and oxygenated monoterpenes were identified, includingα-thujene, α- and β-pinene,β-myrcene, o-cymene,β-phellandrene, limonene, γ-terpinene and α-terpineol. The average normalized to-tal MT emission rate during the flowering period was 5.3 µgC g−1h−1 (σ
=3.5 µgC g−1h−1) with α-pinene, β
-pinene, and limonene being the dominant BVOC (Fig. 8). Figure S2 in the Supplement shows the temperature depen-dence of the emissions. After flowering, average emission rates dropped to 1.2 µgC g−1h−1 (σ=0.85 µgC g−1h−1)
(Fig. 9);γ-terpinene,β-phellandrene, and limonene were the major BVOC emitted at this time.
3.5 Hawthorn
Two sesquiterpenes, β-caryophyllene and humulene were identified in the hawthorn emissions during flow-ering (Fig. S3, in the Supplement). Averaged BER for β-caryophyllene and humulene were 15.1 ngC g−1h−1
(σ=18 ngC g−1h−1) and 4.4 ngC g−1h−1 (σ=
5.6 ngC g−1h−1), respectively (Fig. S4, in the Supplement).
0 1 2 3 4 5 6 7 8 during blooming BE R ( µ g
-C g
-1 h -1) a-pinene b-pinene limonene other MT after blooming
Fig. 7.Average normalized emission rates (30◦C) forα-pinene, β-pinene, limonene, and other monoterpenes from horse chestnut dur-ing and after the bloomdur-ing period. Error bars represent 95 % con-fidence intervals from the averaging of individual results from four experiments. 0 5 10 15 20 25 30 35 0.0 0.2 0.4 0.6 0.8 1.0 1.2 1.4 1.6
2:00 4:00 6:00 8:00 10:00 12:00 14:00 16:00 18:00 20:00
T e mp ( °C) P A R ( µ mo l s
-1 m -2/10 0) E R ( µ g g
-1 h -1)
Time of day a-pinene b-pinene limonene Ambient Temp Enclosure Temp PAR
Fig. 8.Emission rates forα-pinene,β-pinene, and limonene from a honey locust branch enclosure on 9 June with concurrently mea-sured environmental parameters.
These compounds were also identified in the later foliage emissions. The post-flowering average emission rates were 4.0 ngC g−1h−1(σ
=6.9 ngC g−1h−1) and 0.5 ngC g−1h−1
(σ=0.8 ngC g−1h−1) for caryophyllene and humulene,
respectively. A third sesquiterpene, α-farnesene, and the monoterpene limonene, neither of which were observed during flowering, were detected in the hawthorn emissions after flowering.
3.6 Modeling results
0.0 0.2 0.4 0.6 0.8 1.0 1.2 1.4 1.6 1.8 2.0
during blooming
BE
R
(
µ
g
-C.g
-1.h -1)
after blooming a-pinene b-pinene limonene other MT
Fig. 9.Comparison of daily averaged and normalized emission rates (30◦C) forα-pinene,β-pinene and limonene, and other monoter-penes from honey locust during and after the flowering period. Error bars represent 95 percent confidence intervals.
0 10 20 30 40 50 60 70
01/04/2009 16/04/2009 01/05/2009 16/05/2009 31/05/2009 15/06/2009 30/06/2009
S
u
rfac
e
F
lu
x
(µ
g
m
-2 h -1)
MT emissions Flower BVOC emissions
Fig. 10.Modeled sum of monoterpenes (MT) emitted from foliage (using default MEGAN emission rates; red trace) as well as mod-eled floral emissions of MT + other BVOC for the City of Boulder (green trace) based on the measurements conducted in the present study during spring 2009.
non-flower (foliage) MT emissions (Fig. 11). Honey locust flowers appear later in the season (Fig. 12); during that time these emissions represent 36 % of MT emissions.
The simulated estimates have high associated uncertainties due to assumptions made, such as using the city-maintained tree inventory to represent tree species composition across the entire domain. It should also be recognized that the contribution of floral emissions to total biogenic emissions within other urban areas may be quite different from what was observed in Boulder. As a comparison, in the south-ern US city of Riverside, California, flowering trees repre-sent 40 % of total street trees with more than 10 different flowering tree species according to the City of Riverside ur-ban tree inventory. It should also be noted that floral emis-sions within a city may be clustered in some regions, such as city parks and specific neighborhoods, and so could make a higher contribution in some areas and a lower contribu-tion in others. Finally, we would like to emphasize that al-though in the present analysis a direct comparison of MT emissions from honey locust flowers against simulated leaf MT emissions is made, this is not the case for crabapple, in which the dominant BVOC emitted (benzyl alcohol and benzaldehyde) are oxygenated compounds. Species-specific emission factors for oxygenated compounds have a high
de-0 10 20 30 40 50 60 70 80
4/23/2009 4/25/2009 4/27/2009 4/29/2009 5/1/2009 5/3/2009
S
u
rfac
e
F
lu
x
(µ
g
m
-2 h -1)
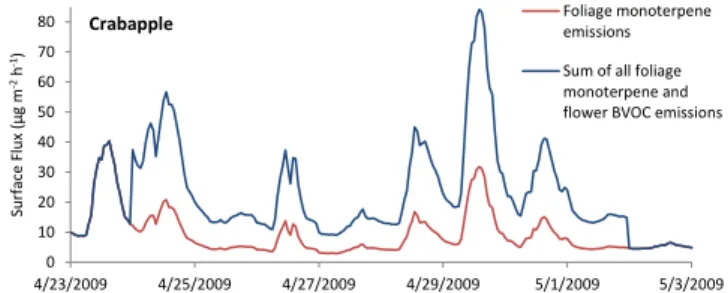
Crabapple Foliage monoterpeneemissions
Sum of all foliage monoterpene and flower BVOC emissions
Fig. 11.Time series showing modeled total foliage and floral BVOC emissions (blue) and default MEGAN, foliage monoterpene emis-sions only (red), during the crabapple flowering period for the City of Boulder urban area.
0 10 20 30 40 50 60
6/4/2009 6/7/2009 6/10/2009 6/13/2009 6/16/2009
S
u
rfac
e
F
lu
x
(µ
g
m
-2 h -1)
Honey locust
Foliage monoterpene emissions
Sum of all foliage monoterpene and flower BVOC emissions
Fig. 12.Time series of modeled total floral and foliage BVOC emis-sions (blue) and default MEGAN, foliage monoterpene emisemis-sions only (red), during the honey locust flowering period for the City of Boulder urban area.
gree of uncertainty, and as such, we felt it prudent to instead compare our simulated floral emission estimates for these compounds with simulated MT emissions, which have sub-stantially lower uncertainties associated with their emission factors.
4 Conclusions
This study represents an attempt to assess the significance of urban tree floral BVOC emissions at an urban scale. The findings demonstrate that floral BVOC emissions may constitute a significant seasonal source of BVOC in areas containing high proportions of flowering trees, with floral emissions approaching and possibly even exceeding non-isoprene BVOC emissions during the peak flowering pe-riod. These emissions estimates are based on the survey of
∼65 % of the insect-pollinated flowering tree species present
composition in urban settings. Additional screening exper-iments of important flowering tree species should also be conducted and the temporal, species-specific blooming pat-terns of these trees should be characterized to better quan-tify the significance of floral emissions in locations which contain substantial fractions of flowering species. The timing of many phenological processes (such as bud-burst, flower-ing, etc.) may shift in response to global climatic changes. In addition to ecological repercussions associated with cli-matic shifts (such as chemically mediated biological inter-actions between plants and their pollinators or even herbi-vores), changes and shifts in floral BVOC emissions might occur. The potential also exists for the timing of these floral emissions bursts to coincide with the Northern Hemisphere springtime ozone maximum, a scenario with implications for urban air quality (due to the reactive nature of many BVOC chemical species); all of these possibilities highlight the need for further research in this area.
Supplementary material related to this article is available online at: http://www.biogeosciences.net/9/ 3777/2012/bg-9-3777-2012-supplement.pdf.
Acknowledgements. This research was supported by the National
Science Foundation, project ATM-0608582. We thank the Creek-side Nursery for accommodating the emissions experiment.
Edited by: N. Saigusa
References
Adams, R. P.: Identification of Essential Oils by Ion Trap Mass Spectrometry, Academic Press, San Diego, USA, 1989. Andreae, M. O. and Crutzen, P. J.: Atmospheric aerosols:
Biogeo-chemical sources and role in atmospheric chemistry, Science, 276, 1052–1058, 1997.
Arey, J., Corchnoy, S. B., and Atkinson, R.: Emission of linalool from Valencia orange blossoms and its observation in ambient air, Atmos. Environ., 25, 1377–1381, 1991.
Baraldi, R., Rapparini, F., Rossi, F., Latella, A., and Ciccioli, P.: Volatile organic compound emissions from flowers of the most occuring and economically important species of fruit trees, Phys. Chem. Earth, 24, 729–732, 1999.
Ciccioli, P., Brancaleoni, E., Frattoni, M., Di Palo, V., Valentini, R., Tirone, G., Seufert, G., Bertin, N., Hansen, U., Csiky, O., Lenz, R., and Sharma, M.: Emission of reactive terpene compounds from orange orchards and their removal by within-canopy pro-cesses, J. Geophys. Res., 104, 8077–8094, 1999.
City of Boulder, Colorado, Municipal Tree Resource Analysis, available at:www.bouldercolorado.gov, 2005.
Dudareva, N., Raguso, R. A., Wang, J., Ross, J. R., and Pichersky, E.: Floral Scent Production in Clarkia breweri, Plant Physiol., 116, 599–604, 1998.
Duhl, T., Guenther, A., and Helmig, D.: Estimating urban vegeta-tion cover fracvegeta-tion using Google Earth® Images, J. Land Use Science, 1–19, doi:10.1080/1747423X.2011.587207, 2011.
Fuentes, J. D., Lerdau, M., Atkinson, R., Baldocchi, D., Botten-heim, J. W., Ciccioli, P. Lamb, B., Geron, C., Gu, L., Guenther, A., Sharkey, T. D., and Stockwell, W.: Biogenic hydrocarbons in the atmospheric boundary layer: A review, B. Am. Meteorol. Soc., 81, 1537–1575, 2000.
Geron, C., Harley, P., and Guenther, A.: Isoprene emission capacity for US tree species, Atmos. Environ., 35, 3341–3352, 2001. Guenther, A. B., Zimmerman, P. R., Harley, P. C., Monson, R. K.,
and Fall, R.: Isoprene and Monoterpene Emission Rate Variabil-ity: Model Evaluations and Sensitivity Analyses, J. Geophys. Res., 98, 12609–12617, 1993.
Guenther, A., Karl, T., Harley, P., Wiedinmyer, C., Palmer, P. I., and Geron, C.: Estimates of global terrestrial isoprene emissions using MEGAN (Model of Emissions of Gases and Aerosols from Nature), Atmos. Chem. Phys., 6, 3181–3210, doi:10.5194/acp-6-3181-2006, 2006.
Helmig, D., Revermann, T., Pollmann, J., Kaltschmidt, O., Jim´enez Hern´andez, A., Bocquet, F., and David, D.: Calibration system and analytical considerations for quantitative sesquiterpene mea-surements in air, J. Chromatogr. A, 1002, 193–211, 2003. Helmig, D., Bocquet, F., Pollmann, J., and Revermann, T.:
Analyt-ical techniques for sesquiterpene emission rate studies in veg-etation enclosure experiments, Atmos. Environ., 38, 557–572, 2004a.
Helmig, D., Revermann, T., and Hall, B.: Characterization of a pressurized C5–C16hydrocarbon gas calibration standard for air analysis, Anal. Chem., 76, 6528–6534, 2004b.
Helmig, D., Ortega, J., Guenther, A., Herrick, J., and Geron, C.: Sesquiterpene emissions from Loblolly Pine and their potential contribution to biogenic aerosol formation in the Southeastern US, Atmos. Environ., 40, 4150–4157, 2006.
Ibrahim, M. A., Egigu, M. C., Kasurinen, A., Yahya, A., and Holopainen, J. K.: Diversity of volatile organic compound emissions from flowering and vegetative branches of Yeheb, Cordeauxia edulis (Caesalpiniaceae), a threatened evergreen desert shrub, Flavour Frag. J., 25, 83–92, 2010.
Johne, A. B., Weissbecker, B., and Sch¨utz, S.: Volatile Emissions from Aesculus hippocastanum Induced by Mining of Larval Stages of Cameraria ohridella Influence Oviposition by Conspe-cific Females, J. Chem. Ecol., 32, 2303–2319, 2006.
Knudsen, J. T., Eriksson, R., Gershenzon, J., and St˚ahl, B.: Diversity and Distribution of Floral Scent, Bot. Rev., 72, 1–120, 2006. Li, Z.-G., Lee, M.-R., and Shen, D.-L.: Analysis of volatile
com-pounds emitted from fresh Syringa oblata flowers in differ-ent florescence by headspace solid-phase microextraction-gas chromatography-mass spectrometry, Anal. Chim. Acta, 576, 43– 49, 2006.
Loughrin, J. N., Hamilton-Kemp, T. R., Andersen, R. A., and Hilde-brand, D. F.: Volatiles from flowers of Nicotiana sylvestris, N. otophora and Malus ×domestica: headspace components and
day/night changes in their relative concentrations, Phytochem-istry, 29, 2473–2477, 1990.
Martin, D. M., Touba, O., Chiang, A., Lo, B. C., Ohse, S., Lundb, S. T., and Bohlmann, J.: The bouquet of grapevine (Vitis vinifera L. cv. Cabernet Sauvignon) flowers arises from the biosynthesis of sesquiterpene volatiles in pollen grains, P. Natl. Acad. Sci., 106, 7245–7250, 2009.
Observations, Ann. Bot.-London, 86, 347–354, 2000.
Mena Granero, A., Egea Gonzalez, F. J., Guerra Sanz, J. M., and Mart´ınez Vidal, J. L.: Analysis of Biogenic Volatile Or-ganic Compounds in Zucchini Flowers: Identification of Scent Sources, J. Chem. Ecol., 31, 2309–2322, 2005.
M¨uller, K., Pelzing, M., Gnauk, T., Kappe, A., Teichmann, U., Spindler, G., Haferkorn, S., Jahn, Y., and Herrmann, H.: Monoterpene emissions and carbonyl compound air concen-trations during the blooming period of rape (Brassica napus), Chemosphere, 49, 1247–1256, 2002.
Ortega, J. and Helmig, D.: Approaches for quantifying reactive and low-volatility biogenic organic compound emissions by vegeta-tion enclosure techniques – Part A, Chemosphere 72, 343–364, 2008.
Ortega, J., Helmig, D., Daly, R. W., Tanner, D. M., Guenther, A. B., and Herrick, J. D.: Approaches for quantifying reactive and low-volatility biogenic organic compound emissions by vegeta-tion enclosure techniques – Part B: Applicavegeta-tions, Chemosphere, 72, 365–380, 2008.
Pichersky, E. and Gershenzon, J.: The formation and function of plant volatiles: perfumes for pollinator attraction and defense, Curr. Opin. Plant Biol., 5, 237–243, 2002.
Rapparini, F., Baraldi, R., and Facini, O.: Seasonal variation of monoterpene emission from Malus domestica and Prunus avium, Phytochemistry, 57, 681–687, 2001.
Robertson, G. W., Griffiths, D. W., Woodford, J. A. T., Birch, A. N. E., Picket, J. A., and Wadhams, L. J.: A comparison of the flower volatiles from hawthorn and four raspberry cultivars, Phy-tochemistry, 33, 1047–1053, 1993.
Rodriguez-Saona, C., Parra, L., Quiroz, A., and Isaacs, R.: Varia-tion in highbush blueberry floral volatile profiles as a funcVaria-tion of pollination status, cultivar, time of day and flower part: implica-tions for flower visitation by bees, Ann. Bot., 107, 1377–1390, doi:10.1093/aob/mcr077, 2011.
Sharkey, T. D., Singsaas, E. L., Vanderveer, P. J., and Geron, C.: Field measurements of isoprene emission from trees in response to temperature and light, Tree Physiol., 16, 649–654, 1996. Tarvainen, V., Hakola, H., Hell´en, H., B¨ack, J., Hari, P., and
Kulmala, M.: Temperature and light dependence of the VOC emissions of Scots pine, Atmos. Chem. Phys., 5, 989–998, doi:10.5194/acp-5-989-2005, 2005.
Van Schie, C. C., Haring, M. A., and Schuurink, R. C.: Regulation of terpenoid and benzenoid production in flowers, Curr. Opin. Plant Biol., 9, 203–208, 2006.
Yamaguchi, K. and Shibamoto, T.: Volatile constituents of the chest-nut flower, J. Agric. Food Chem., 28, 82–84, 1980.