AMTD
8, 11533–11596, 2015TD-CRDS for NO2,
RO2NO2 and RONO2 J. Thieser et al.
Title Page
Abstract Introduction
Conclusions References
Tables Figures
◭ ◮
◭ ◮
Back Close
Full Screen / Esc
Printer-friendly Version
Interactive Discussion
Discussion
P
a
per
|
Discussion
P
a
per
|
Discussion
P
a
per
|
Discussion
P
a
per
|
Atmos. Meas. Tech. Discuss., 8, 11533–11596, 2015 www.atmos-meas-tech-discuss.net/8/11533/2015/ doi:10.5194/amtd-8-11533-2015
© Author(s) 2015. CC Attribution 3.0 License.
This discussion paper is/has been under review for the journal Atmospheric Measurement Techniques (AMT). Please refer to the corresponding final paper in AMT if available.
A two-channel, Thermal Dissociation
Cavity-Ringdown Spectrometer for the
detection of ambient NO
2
, RO
2
NO
2
and
RONO
2
J. Thieser1, G. Schuster1, G. J. Phillips1,a, A. Reiffs1, U. Parchatka1, D. Pöhler2,
J. Lelieveld1, and J. N. Crowley1
1
Max-Planck-Institut für Chemie, Division of Atmospheric Chemistry, Mainz, Germany 2
Institute of Environmental Physics, University of Heidelberg, Heidelberg, Germany a
now at: Department of Natural Sciences, University of Chester, Chester, UK
Received: 23 September 2015 – Accepted: 8 October 2015 – Published: 3 November 2015
Correspondence to: J. N. Crowley ([email protected])
AMTD
8, 11533–11596, 2015TD-CRDS for NO2,
RO2NO2 and RONO2 J. Thieser et al.
Title Page
Abstract Introduction
Conclusions References
Tables Figures
◭ ◮
◭ ◮
Back Close
Full Screen / Esc
Printer-friendly Version
Interactive Discussion
Discussion
P
a
per
|
Discussion
P
a
per
|
Discussion
P
a
per
|
Discussion
P
a
per
|
Abstract
We describe a Thermal Dissociation Cavity-Ring-Down Spectrometer (TD-CRDS) for measurement of ambient NO2, total peroxy nitrates (ΣPNs) and total alkyl ni-trates (ΣANs). The spectrometer has two separate cavities operating at ∼405.2 and 408.5 nm, one cavity (reference) samples NO2 continuously from an inlet at ambient
5
temperature, the other samples sequentially from an inlet at 473 K in which PNs are converted to NO2or from an inlet at 723 K in which both PNs and ANs are converted to NO2, difference signals being used to derive mixing ratios ofΣPNs andΣANs. We describe an extensive set of laboratory experiments and numerical simulations to char-acterise the fate of organic radicals in the hot inlets and cavity and derive correction
10
factors to account for the bias resulting from interaction of peroxy radicals with ambient NO and NO2. Finally, we present the first measurements and comparison with other instruments during a field campaign, outline the limitations of the present instrument and provide an outlook for future improvements.
1 Introduction
15
Reactive nitrogen oxides are centrally important trace gases in atmospheric chemistry as they affect air quality, climate, and ecosystem nutrient. Nitrogen oxides are involved in the photochemical production/loss of ozone (O3), they interact with HOx radicals
(HOx≡OH+HO2+RO2, where R is an organic fragment) to either catalyse ozone formation or terminate the HOxcatalytic chain and thereby suppress ozone formation.
20
Nitrogen oxides are largely emitted to the atmosphere as NO which is then oxidised to NO2. Beside inorganic NOx (NOx≡NO+NO2) there are several classes of organic nitrogen oxides including peroxy nitrates (RO2NO2) and alkyl nitrates (RONO2) which have an important influence on atmospheric composition. Peroxy nitrates and alkyl nitrates are produced as by-products in the photochemical oxidation of volatile organic
25
AMTD
8, 11533–11596, 2015TD-CRDS for NO2,
RO2NO2 and RONO2 J. Thieser et al.
Title Page
Abstract Introduction
Conclusions References
Tables Figures
◭ ◮
◭ ◮
Back Close
Full Screen / Esc
Printer-friendly Version
Interactive Discussion
Discussion
P
a
per
|
Discussion
P
a
per
|
Discussion
P
a
per
|
Discussion
P
a
per
|
produce the pollutant and greenhouse gas ozone. In addition to being indicators of photochemical ozone production, organic nitrates exert a direct influence on regional ozone levels and can have a large impact on the global distribution of NOx and thus ozone (Roberts, 1990; Singh and Hanst, 1981).
Peroxy nitrates are formed in the reaction of RO2with NO2 Reaction (R1) and their
5
lifetime with respect to thermal decomposition Reaction (R2) is strongly temperature dependent.
RO2+NO2+M→RO2NO2+M (R1)
RO2NO2+M→RO2+NO2+M (R2)
Peroxy nitrates such as peroxyacetic nitric anhydride (PAN, CH3C(O)O2NO2), which
10
possess an acyl group adjacent to the peroxy group have thermal decomposition life-times that vary from less than an hour at the surface at temperatures close to 295 K, to more than a month at the low temperature of e.g. the upper troposphere. Consequently peroxyacetic nitric anhydrides are important reservoirs of NOx and mediators of its long-range transport to remote regions. In contrast, peroxy nitrates that do not possess
15
the acyl group (e.g. HO2NO2or CH3O2NO2) are much shorter lived and are only found in significant abundance in cold regions of the troposphere such as in the Antarctic boundary layer (Slusher et al., 2002) and the upper troposphere (Browne et al., 2011). Other losses of RO2NO2 such as photolysis or reaction with OH are vastly reduced in importance compared to thermal decomposition (Talukdar et al., 1995). Throughout
20
this manuscript, we use the term “PN” to refer to peroxy nitrates.
During daytime, alkyl nitrates (RONO2) are formed in a minor branch of the reaction between organic peroxy radicals (RO2) and NO (Reaction R3). The dominant reaction channel (Reaction R4) leads to the formation of NO2and therefore (via its photolysis) to ozone.
25
RO2+NO→RONO2+M (R3)
AMTD
8, 11533–11596, 2015TD-CRDS for NO2,
RO2NO2 and RONO2 J. Thieser et al.
Title Page
Abstract Introduction
Conclusions References
Tables Figures
◭ ◮
◭ ◮
Back Close
Full Screen / Esc
Printer-friendly Version
Interactive Discussion
Discussion
P
a
per
|
Discussion
P
a
per
|
Discussion
P
a
per
|
Discussion
P
a
per
|
The fractional flux through Reaction (R3) (relative to Reactions R3 and R4) depends on the carbon chain and also the pressure and temperature and can vary from very low values (<2 %) for small hydrocarbons to>50 % for longer chain hydrocarbons such as heptane (Lee et al., 2014).
Alkyl nitrates can also be formed at night in the NO3induced degradation of
unsat-5
urated VOCs, which proceeds via addition of NO3 across the double bond to form (in the presence of O2) a nitrooxyalkyl peroxy radical that can further react to form an alkyl nitrate with e.g. hydroxyl- or carbonyl groups:
NO3+R=R(+O2) → R′RONO2 (R5)
Yields of ANs from these reactions can be large, especially for biogenic organics such
10
as isoprene or terpenes (Atkinson and Arey, 2003). Hereafter, we use the term “AN” to refer to alkyl nitrates, irrespective of their mode of generation.
ANs which do not contain double bonds or hydroxyl groups generally have a low affinity for surfaces and react only slowly with oxidants such as OH (Talukdar et al., 1997) so that they can sequester a significant fraction of reactive nitrogen (Perring
15
et al., 2013).
The organic nitrate content of ambient air comprises a mixture of many structurally distinct compounds in generally low individual abundance, which makes their quantita-tive determination challenging. Organic nitrates have been measured on many occa-sions using gas chromatography (GC). The advantage of this technique is a limit of
de-20
tection of a few pptv and the possibility to distinguish between individual organic nitrates (see e.g. Roberts et al., 2003). The disadvantages are the requirement of calibration for many trace gases (usually not commercially available) and low time resolution (Hao et al., 1994; Flocke et al., 2005). Recently, PAN and other peroxycarboxylic nitric anhy-drides such as MPAN (peroxymethacrylic nitric anhydride) and PPAN (peroxypropionic
25
AMTD
8, 11533–11596, 2015TD-CRDS for NO2,
RO2NO2 and RONO2 J. Thieser et al.
Title Page
Abstract Introduction
Conclusions References
Tables Figures
◭ ◮
◭ ◮
Back Close
Full Screen / Esc
Printer-friendly Version
Interactive Discussion
Discussion
P
a
per
|
Discussion
P
a
per
|
Discussion
P
a
per
|
Discussion
P
a
per
|
et al., 2013; LaFranchi et al., 2009; Roiger et al., 2011; Mielke and Osthoff, 2012; Zheng et al., 2011; Wolfe et al., 2009).
The first measurements of alkyl nitrates in the atmosphere were made by Atlas et al. (1988), and subsequent calculations and measurements suggested that the atmosphere should contain a wide suite of individual alkyl and multifunctional
ni-5
trates (Atherton and Penner, 1988; Calvert and Madronich, 1987; Schneider and Ballschmiter, 1999) and that hydroxy alkyl nitrates derived from isoprene oxidation could constitute as much as 12–26 % of tropospheric NOy (Trainer et al., 1991).
To-tal measured NOy has frequently been found to exceed the sums of different nitrogen compounds (NO+NO2+PAN+HNO3+HONO+NO3+2N2O5+. . .), the range of the
10
“missing” NOy being 10–20 %. In most of these observations the total alkyl nitrate con-tent was not measured or only partially (e.g. Buhr et al., 1990; Fahey et al., 1986; Parrish and Buhr, 1993; Ridley et al., 1990; Williams et al., 1997; Singh et al., 1996).
These considerations led to the development of instruments (Day et al., 2002) which make use of the thermal instability of RO2NO2and RONO2 at elevated temperatures
15
and which report measurements of the sum of peroxy nitrates (ΣPN) or the sum of alkyl-nitrates (ΣAN) by monitoring the NO2 product of the thermal decomposition of PNs and ANs to NO2at different temperatures.
RO2NO2−∆(>450 K)→RO2+NO2 (R6)
RONO2 −∆(>650 K)→RO+NO2 (R7)
20
These studies have helped to confirm that ANs and PNs represent a significant fraction of atmospheric NOy and confirm their role in e.g. HOx radical chain termination, or as indicators of photochemical O3 generation (see e.g. Perring et al., 2013; Rosen et al., 2004; Day et al., 2003).
Here we describe a recently constructed instrument to measure ambient NO2 and
25
AMTD
8, 11533–11596, 2015TD-CRDS for NO2,
RO2NO2 and RONO2 J. Thieser et al.
Title Page
Abstract Introduction
Conclusions References
Tables Figures
◭ ◮
◭ ◮
Back Close
Full Screen / Esc
Printer-friendly Version
Interactive Discussion
Discussion
P
a
per
|
Discussion
P
a
per
|
Discussion
P
a
per
|
Discussion
P
a
per
|
2 Principal of operation and instrument set-up
Cavity-ring-down spectroscopy (hereafter CRDS) and its use for the sensitive detection of atmospheric trace gases has been reviewed in detail (Brown, 2003; Berden et al., 2000). CRDS is based on direct absorption spectroscopy in which the absorption path length is enhanced by a high finesse cavity formed by a set of two highly reflective
5
mirrors. Most applications use pulsed or intensity modulated CW lasers as light source with direct coupling into the cavity via one (front) mirror. The present experiment uses a square-wave, on/offmodulated CW laser. During the “laser-on” phase the light inten-sity in the cavity builds up to a level determined by mirror reflectivity and transmission. The light leaking out through the back mirror during “laser off” mode is analysed to
10
derive an exponential decay constant, which is reduced in the presence of an absorb-ing or scatterabsorb-ing gas. This provides an absolute measurement of optical extinction, as given in Eq. (1).
σ[A]=α= l
cd
1 τ −
1 τ0
(1)
where,σis the absorption cross section of the absorber, averaged over the laser
spec-15
trum, [A] is the concentration of the absorber,αis the optical extinction coefficient (units of inverse length),cis the speed of light,τandτ0are the exponential decay constants with and without the absorber in the cavity andl /d is the ratio of the length over which the absorber is present to the distance between the two resonator mirrors. In order to deriveτ0the cavity is flushed with zero air (see later).
20
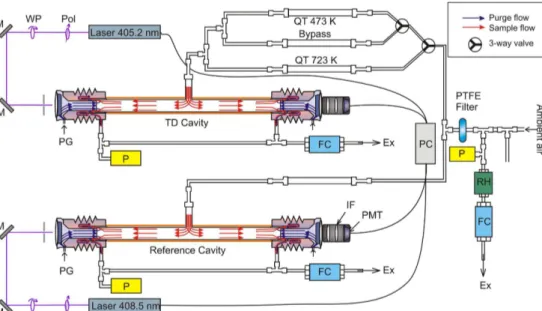
Essential features of the TD-CRDS instrument described here are displayed in Fig. 1. Our two-channel CRDS utilises two laser diodes (Lasercomponents, optical power: 120 mW) in commercially available laser diode heads (Thorlabs) with current- and tem-perature controller units (Thorlabs ITC 510 and ITC 502). The lasers are modulated on and offat 1666 Hz (duty cycle 50 %) by a 6 V square-wave signal. The rise and fall
25
AMTD
8, 11533–11596, 2015TD-CRDS for NO2,
RO2NO2 and RONO2 J. Thieser et al.
Title Page
Abstract Introduction
Conclusions References
Tables Figures
◭ ◮
◭ ◮
Back Close
Full Screen / Esc
Printer-friendly Version
Interactive Discussion
Discussion
P
a
per
|
Discussion
P
a
per
|
Discussion
P
a
per
|
Discussion
P
a
per
|
isolators (consisting of a linear polarizer and a quarter wave plate) are used to reduce back reflections from the front mirror from entering the lasers. The laser diodes are stabilized at about 40 and about 50◦C resulting in wavelengths centred at about 405.2 and 408.5 nm, respectively. The laser emission is monitored at regular intervals by cou-pling weak specular reflection from either of the front mirrors via an optical fibre into
5
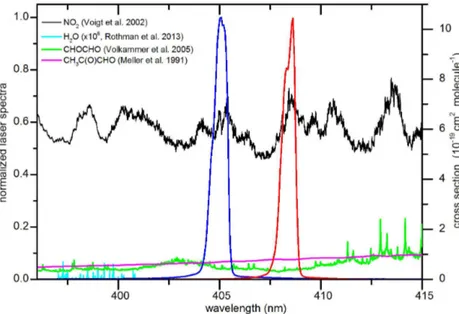
a spectrometer (∼0.1 nm resolution, OMT, temperature regulated CCD detector with 3648 Pixel). Small variations in the laser wavelength are observed (peak-to-peak vari-ability of<2 % over consecutive, 10 min averaging intervals), which result in the same variability of the effective absorption cross-section. Figure 2 shows the laser emission spectra (blue and red) along with the NO2absorption spectrum (black line, righty axis,
10
Voigt et al., 2002). The relatively broad laser emission ensures passive mode matching with resonant frequencies of the cavity, avoiding the need for active mode-matching (Ayers et al., 2005). Effective absorption cross sections were obtained by multiplying the normalised laser emission spectra with the structured absorption of NO2.
The cavity mirrors (1-inch diameter, 1 m radius of curvature) have a nominal
reflectiv-15
ity of 0.999965 (Advanced Thin Films). The mirrors are mounted in a self-made mirror holder system, the∼70 cm distance between them being rigidly fixed using three hol-low carbon-fibre rods (o.d. 15 mm) per cavity. This combination of mirror reflectivity and separation results in ring down times under typical conditions (830 mbar air) of about τ0=38 µs when no absorber is present, or optical path lengths of >10 km. A purge
20
flow, 100 sccm, of zero air protects each mirror from contamination by ambient air and subsequent loss of reflectivity.
The light transmitted through the back mirror of the cavity is detected by a photomul-tiplier, located behind a lens and an interference filter (10 nm FWHM centred at 405 nm) to reject stray light. The preamplified signal is digitised by a USB digital oscilloscope
25
AMTD
8, 11533–11596, 2015TD-CRDS for NO2,
RO2NO2 and RONO2 J. Thieser et al.
Title Page
Abstract Introduction
Conclusions References
Tables Figures
◭ ◮
◭ ◮
Back Close
Full Screen / Esc
Printer-friendly Version
Interactive Discussion
Discussion
P
a
per
|
Discussion
P
a
per
|
Discussion
P
a
per
|
Discussion
P
a
per
|
is repeated 32 times, resulting in a time resolution of about 4 s per data point for both channels.
The two-channel CRDS consists of two nominally identical cavities (both thermostat-ted to 308 K) and sample inlets. The cavities are made of 10 mm i.d. Duran glass, which was coated with a thin film of Teflon (DuPont, FEP TE9568) to minimise interaction of
5
traces gases with the walls, which could potentially results in loss or production of NO2. Aerosols are prevented from entering the inlets and cavities using a 47 mm diameter, 2 µm PTFE filter (PAL Teflo).
The cavities are operated at sub-ambient pressure (typically 800–850 mbar) which is held constant using an additional, mass flow controlled branch linking the inlet manifold
10
to a pump. This line also contains a relative humidity and temperature sensor to enable corrections for laser light scattering by H2O vapour to be made (see later). Ambient air enters the centre of the cavities at a flow rate of 2.0 standard litres per minute in each channel, resulting in a cavity residence time of about 1.2 s. However, as concentrations are integrated over the entire cavity length the average residence time of a molecule of
15
NO2detected in the cavity will be less than this.
Values ofτ0were obtained at regular intervals (every 5–10 min) by switching ambient air for zero-air for a short period (1–2 min). 3-way Teflon valves (NResearch) which have been shown not to permanently remove PNs, ANs or NO2were used. This frequency of zeroing was found to be sufficient to track drifts in the ring down constant (see later).
20
One of the cavities (reference cavity in Fig. 1) continuously measures ambient NO2, the second cavity (TD-cavity) samples alternatively from three separate, quartz tubes of i.d. 1.5 cm and length 42 cm. 15 cm sections of two of the quartz tubes were placed in commercial ovens (Carbolite) and heated up to 473 and 723 K, whereby these are oven temperatures and do not necessarily reflect the temperature of gas flowing through
25
AMTD
8, 11533–11596, 2015TD-CRDS for NO2,
RO2NO2 and RONO2 J. Thieser et al.
Title Page
Abstract Introduction
Conclusions References
Tables Figures
◭ ◮
◭ ◮
Back Close
Full Screen / Esc
Printer-friendly Version
Interactive Discussion
Discussion
P
a
per
|
Discussion
P
a
per
|
Discussion
P
a
per
|
Discussion
P
a
per
|
The cavity which normally samples from the 473 or 723 K inlets can also be switched to sample at ambient temperature (via the “bypass” inlet shown in Fig. 1), enabling di-rect comparison of NO2measurements in the two cavities. As this method for detection ofΣANs andΣPNs relies on the difference in NO2mixing ratios when sampling from the heated and unheated inlets tests were carried out to establish that equal concentrations
5
of NO2are measured in each cavity when only NO2is present. This dataset, displayed as Fig. SI 1, yields slopes of unity when the TD-cavity sampled NO2(2–80 ppb) when sampling from both the 473 and 723 K inlets.
The residence time inside the heated quartz tubes and the connection tubing after splitting the air stream is about 2.5 s before reaching the cavities. The temperature
10
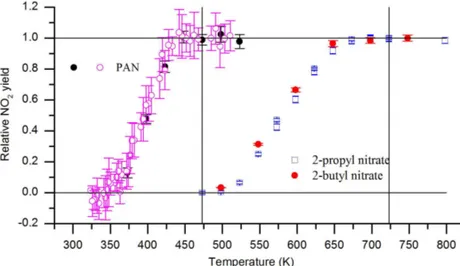
profile inside the heated part of the quartz tube is non-uniform and the operating tem-perature was chosen to ensure complete dissociation of the organic nitrates. Figure 3 displays the relative NO2signals measured when ramping the temperature of the ovens from 323 to 803 K and passing dilute samples of either PAN,i-propyl nitrate or i-butyl nitrate through the heated inlets. This shows clearly that the thermal decomposition of
15
PAN is complete at oven temperatures greater than 443 K. For the two alkyl nitrates tested, very similar profiles are obtained, indicating that decomposition is negligible at temperatures<493 K but that temperatures above∼693 K are sufficient for complete decomposition to NO2. These observations are consistent with those reported for simi-lar TD-set ups to determine peroxy and alkylnitrates (Day et al., 2002; Wooldridge et al.,
20
2010; Zheng et al., 2011). Based on these results, the ovens were set to temperatures of 473 and 723 K (vertical lines in Fig. 3).
For initial estimates of the conversion efficiency of PNs and ANs to NO2 we con-ducted tests using samples of PAN and isopropyl nitrate of known concentration. For PAN we used a photochemical source (Phillips et al., 2013) in which NO is converted
25
AMTD
8, 11533–11596, 2015TD-CRDS for NO2,
RO2NO2 and RONO2 J. Thieser et al.
Title Page
Abstract Introduction
Conclusions References
Tables Figures
◭ ◮
◭ ◮
Back Close
Full Screen / Esc
Printer-friendly Version
Interactive Discussion
Discussion
P
a
per
|
Discussion
P
a
per
|
Discussion
P
a
per
|
Discussion
P
a
per
|
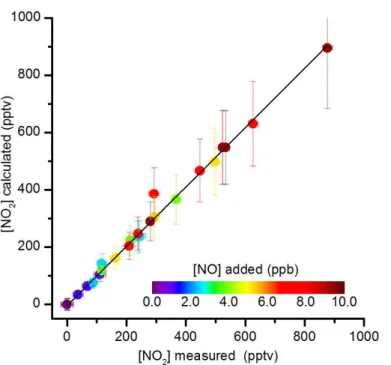
600 pptv) is given in Fig. SI 2. In this case, PAN was calculated by multiplying the NO mixing ratio (itself calculated from the manufacturer’s specification and dilution factors) by 1.1. In this range of PAN mixing ratios, the response of the TD-CRDS to various NO (and thus PAN) concentrations is linear, with a gradient close to unity, suggesting that PAN detection as NO2is quantitative in our TD-CRDS.
5
Samples of alkyl nitrates in air of known concentrations (∼3 and∼6 ppb) were pre-pared manometrically and used to derive the stoichiometry of conversion of 2-propyl nitrate to NO2. The results are also displayed in Fig. SI 2 and indicate that, at 723 K, 2-propyl nitrate in air is quantitatively converted to NO2. Later we discuss the effects of non-stoichiometric conversion of PAN and ANs to NO2due to reactions of the organic
10
radical fragment formed during thermal dissociation.
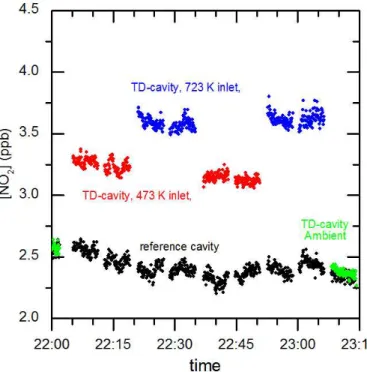
A typical measurement sequence (in this case with an ambient air sample) is illus-trated in Fig. 4 which displays NO2mixing ratios in both cavities. The black data points are NO2measurements in the reference cavity, the blue and red data points were ob-tained when the TD cavity was sampling from the 723 and 473 K ovens, respectively.
15
The green data points were obtained in the TD-cavity when the gas was sampled via the bypass and serve as a check for consistency between the two cavities. The gaps in the data are zeroing periods when the inlet was filled with synthetic air. Zeroing was conducted at the same pressure as the measurement to avoid changes in ring-down due to changes in Rayleigh scattering by air. Note that the change in ring-down time at
20
405 nm caused by a 3.3 mbar change in pressure of air is the equivalent of∼100 pptv of NO2. As we discuss later, the use of dry zero-air to deriveτ0also requires correc-tion for the difference in scattering cross section of dry and humid (i.e. ambient) air. Experiments to derive correction factors for this effect are described in Sect. 2.1.
Subtraction of the NO2mixing ratio measured when sampling from the reference
cav-25
AMTD
8, 11533–11596, 2015TD-CRDS for NO2,
RO2NO2 and RONO2 J. Thieser et al.
Title Page
Abstract Introduction
Conclusions References
Tables Figures
◭ ◮
◭ ◮
Back Close
Full Screen / Esc
Printer-friendly Version
Interactive Discussion
Discussion
P
a
per
|
Discussion
P
a
per
|
Discussion
P
a
per
|
Discussion
P
a
per
|
which also readily decompose at this temperature. In order to derive theΣANs mixing ratio we first have to interpolate [NO2]TD 473 (red data points) and then subtract this from [NO2]TD 723 (blue data points). The need to interpolate the data from the 473 K channel means that the accuracy of theΣANs measurement is impacted by variability of theΣPNs mixing ratio.
5
2.1 Data corrections
2.1.1 l tod ratio
Owing to the use of purge gas flows at the mirrors, the physical distance between the mirrors (d) is longer than the length through which optical absorption takes place (l). The ratio ofd tol was obtained by flowing a constant amount of NO2/N2though the
10
cavity and varying the purge gas flow from zero to 500 sccm as shown previously for our red-laser instrument for measuring NO3and N2O5(Schuster et al., 2009). The re-duction in NO2signal at a purge gas flow of 100 sccm compared to when the complete volume between the mirrors was flushed with NO2(no mirror purge) was 5 %, indicating ad tol ratio of 1.06.
15
2.1.2 Inlet and filter loss of NO2, PNs and ANs
The inlet transmission and filter losses were investigated in the laboratory for NO2,
ΣPNs and ΣANs. The response to concentration changes was nearly instantaneous, suggesting that wall losses or associated memory effects on the inlet and cavity tubing are insignificant. Transmission through a fresh PTFE filter (2 µm pore size) housed in
20
AMTD
8, 11533–11596, 2015TD-CRDS for NO2,
RO2NO2 and RONO2 J. Thieser et al.
Title Page
Abstract Introduction
Conclusions References
Tables Figures
◭ ◮
◭ ◮
Back Close
Full Screen / Esc
Printer-friendly Version
Interactive Discussion
Discussion
P
a
per
|
Discussion
P
a
per
|
Discussion
P
a
per
|
Discussion
P
a
per
|
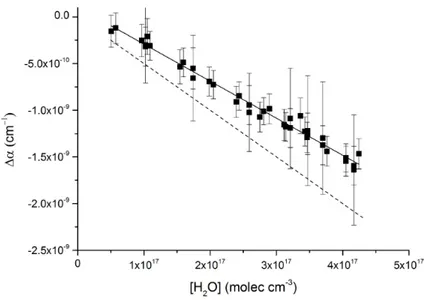
2.1.3 Relative humidity
Use of dry, zero-air to deriveτ0 requires correction for the fact that the Rayleigh scat-tering cross section of water vapour is smaller than that of dry air. The size of this effect was investigated in the laboratory by comparing τ0 (obtained in dry, zero-air) toτ in zero-air at various relative humidities (RH) between 10 and 70 % (Delta Ohm,
5
HD49T) at room temperature. The results are displayed in Fig. 5 which, at constant total pressure, shows a linear decrease in extinction with increasing water vapour con-centration. This confirms that, in contrast to the conclusions of Hargrove and Zhang (2008) who found a large, positive interference caused by water vapour at 405 nm, the effect of H2O in ambient air is to reduce extinction due to its lower Rayleigh scattering
10
cross section. The slope of the fit in Fig. 5 yields a cross section difference between water vapour and dry air of∆σRayleigh405−409 nm=(−4.0±0.4)×10−27cm2molecule−1. This is somewhat lower than the value of∆σRayleigh405−409 nm=(−5.0±0.2)×10−27cm2molecule−1 obtained at 404±0.5 nm by Fuchs et al. (2009). To put this in context, the correction applied for an ambient relative humidity of 70 % at 22◦C is equivalent to 130 pptv NO2
15
under normal operating conditions. At low NO2mixing ratios the correction is therefore large (e.g. 100 % at 100 pptv). We discuss the impact of this later when assessing the total uncertainty.
2.1.4 Presence of NO2in zero air
The presence of NO2in the zero air used would lead to an underestimation of the
ambi-20
ent NO2concentrations. In order to check for NO2impurity in bottled zero air (hydrocar-bon free) we constructed and characterised an efficient, all-quartz blue-light converter (BLC) (Kley and McFarland, 1980) to remove NO2. The BLC consisted of a thin (ID 10 mm) quartz tube of∼30 cm length with the light from two LED arrays operating at a central wavelength of∼390 nm coupled into the tube via quartz end-windows. NO2
25
AMTD
8, 11533–11596, 2015TD-CRDS for NO2,
RO2NO2 and RONO2 J. Thieser et al.
Title Page
Abstract Introduction
Conclusions References
Tables Figures
◭ ◮
◭ ◮
Back Close
Full Screen / Esc
Printer-friendly Version
Interactive Discussion
Discussion
P
a
per
|
Discussion
P
a
per
|
Discussion
P
a
per
|
Discussion
P
a
per
|
a flow rate of 1 SLM, was removed with an efficiency of∼60 %, independent of NO2 mixing ratios up to about 1 ppb. The use of quartz rather than Teflon for the construction of the BLC reduces memory effects related to NO2degassing from or being formed on UV-illuminated Teflon surfaces. The level of NO2in the zero air could thus be monitored with the CRDS by flowing the air through the BLC and modulating the light on-and-off 5
over several 1 min cycles. In all bottles tested during a field campaign (PARADE, see below) no change in NO2signal was observed, placing an upper limit of about 20 pptv of NO2in the zero-air, implying a maximum bias of−20 pptv in the NO2measurements.
2.1.5 Formation of NO2via O3+NO
Common to several established instruments that measure NO2, its formation in a dark
10
reaction between NO and O3in e.g. an inlet line has to be considered (Ryerson et al., 2000).
NO+O3 → NO2 (R8)
Laboratory experiments were thus conducted to examine the formation of NO2via the reaction of O3 with NO, with the mixing ratios of NO (0–10 ppbv) and O3 (25, 48 or
15
80 ppbv) varied systematically. NO was taken from a bottled standard, O3was formed by passing synthetic air over a pen-ray lamp and it concentration was monitored using a photometric O3analyser (Thermo Environmental Instruments, model 49).
Under conditions of low conversion of NO and O3, the amount of NO2formed [NO2]t
can be calculated from the initial concentrations of NO and O3 and the reaction time
20
(t): [NO2]t=k8[NO][O3]t, wherek8is the rate coefficient for Reaction (R8) and is given as 2.07×10⁻¹²exp(−1400/T) cm3molecule−1s−1(Atkinson et al., 2004) which results in a room temperature rate coefficient of about 1.9×10⁻¹⁴cm3molecule−1s−1. For the NO2 reference channel (inlet at 298 K, cavity at 308 K) the amount of NO2 formed was entirely consistent with the kinetic parameters and reaction time used. This is
25
AMTD
8, 11533–11596, 2015TD-CRDS for NO2,
RO2NO2 and RONO2 J. Thieser et al.
Title Page
Abstract Introduction
Conclusions References
Tables Figures
◭ ◮
◭ ◮
Back Close
Full Screen / Esc
Printer-friendly Version
Interactive Discussion
Discussion
P
a
per
|
Discussion
P
a
per
|
Discussion
P
a
per
|
Discussion
P
a
per
|
The expression above indicates that the rate coefficient increases significantly with temperature so that an increase in the formation of NO2would be expected in the ovens of the TD-cavity. Indeed, in order to explain the formation of NO2in the 473 and 723 K channels, “effective” rate coefficients of 2.5×10⁻¹⁴and 6.2×10⁻¹⁴ cm3molecule−1s−1 were necessary. These effective rate coefficients take into account the fact that the
5
NO2production rate is time dependent owing to the temperature gradients through the apparatus and are thus appropriate for making corrections for NO2 formed in this par-ticular system. In order to illustrate the size of this correction we assume O3=50 ppb, NO=1 ppb, NO2=5 ppb, which are typical of a semi-polluted environment during day-time. The amount of NO2 formed in the reference (cold) channel via this route is
10
0.1 ppbv or 2 % of ambient NO2. This increases to 2.6 and 6.5 % in the 473 and 723 K channels, respectively.
2.1.6 Pyrolysis of O3
The potential for the reduction of NO2 to NO via reaction with O( 3
P) atoms formed in the thermal degradation of O3 has been discussed by Day et al. (2002) who show
15
that it is of negligible importance for measurements of PNs and ANs conducted at the temperatures used here. As the equilibrium between O atoms and O3 will be strongly shifted to O3in our experiments at higher pressure and partial pressures of O2, we can safely ignore the pyrolysis of O3as source of systematic error.
2.1.7 Reactions of organic radicals with NO and NO2 20
The method of thermal dissociation of PNs or ANs to NO2and subsequent monitoring of NO2 requires knowledge of the stoichiometry of the conversion factor under op-erating conditions. As discussed already (Wooldridge et al., 2010; Day et al., 2002) deviation from an ideal conversion factor of unity occurs when the NO2formed in the thermal dissociation recombines with the organic radical, or when the organic radical
AMTD
8, 11533–11596, 2015TD-CRDS for NO2,
RO2NO2 and RONO2 J. Thieser et al.
Title Page
Abstract Introduction
Conclusions References
Tables Figures
◭ ◮
◭ ◮
Back Close
Full Screen / Esc
Printer-friendly Version
Interactive Discussion
Discussion
P
a
per
|
Discussion
P
a
per
|
Discussion
P
a
per
|
Discussion
P
a
per
|
can react with other atmospheric substituents (such as NO) to form NO2. The reactions which take place in the 473 and 723 K inlets are discussed below:
473 K inlet:
Alkyl nitrates pass through the 473 K inlet without dissociation so we need only to consider the fate of PNs. For PAN (CH3C(O)O2NO2) the major reactions that either
5
form or consume NO2are:
CH3C(O)O2NO2−∆→CH3C(O)O2+NO2 (R9)
CH3C(O)O2+NO2+M→CH3C(O)O2NO2+M (R10)
CH3C(O)O2+NO(+O2)→NO2+CH3O2+CO2 (R11)
CH3O2+NO(+O2)→HCHO+HO2+NO2 (R12)
10
HO2+NO→OH+NO2 (R13)
OH+NO2→HNO3 (R14)
Note that Reactions (R11) and (R12) are composite reactions in which the initially formed CH3CO2 (Reaction R11) and CH3O (Reaction R12) either decompose and/or react with O2to give the products listed.
15
Reaction (R10) results in underestimation of RO2NO2 mixing ratios, whereas Re-action (R11) and subsequent ReRe-actions (R12) and (R13) of organic radical fragments results in an overestimation by oxidizing a fraction of any ambient NO. These reac-tions compete with loss of the organic radical to the wall of the hot quartz tubing or their thermal decomposition so that the size of the artefact will depend non-linearly
20
on ambient levels of NO and NO2as well as the concentration of RO2NO2. The reac-tion scheme above indicates that, when wall losses of the radicals are neglected, the presence of sufficient NO can result in the generation of three extra NO2for each one formed directly in PAN decomposition.
Such effects can be reduced by operating the instrument at very low pressures (and
25
AMTD
8, 11533–11596, 2015TD-CRDS for NO2,
RO2NO2 and RONO2 J. Thieser et al.
Title Page
Abstract Introduction
Conclusions References
Tables Figures
◭ ◮
◭ ◮
Back Close
Full Screen / Esc
Printer-friendly Version
Interactive Discussion
Discussion
P
a
per
|
Discussion
P
a
per
|
Discussion
P
a
per
|
Discussion
P
a
per
|
et al., 2010). As discussed by Paul et al. (2009), this option is not available for a CRDS instrument which generally operates at higher pressures in order to maintain sufficient sensitivity.
Initial observations of an unchanging mixing ratio when flowing samples of PAN or 2-propyl-nitrate at levels of 1–2 ppb through the inlet and cavities at flow rates of between
5
1 and 3 L (std) min−1(SLM) and thus varying the reaction time by a factor of three indi-cated that such effects are small, in accord with the observations of Paul et al. (2009) and the data shown in Fig. SI 2. A detailed experimental investigation of this artefact was conducted in a set of experiments in which known amounts of NO or NO2 were added to a PAN sample (between 500 and 5000 pptv) and monitoring the resultant NO2
10
formed by thermal decomposition.
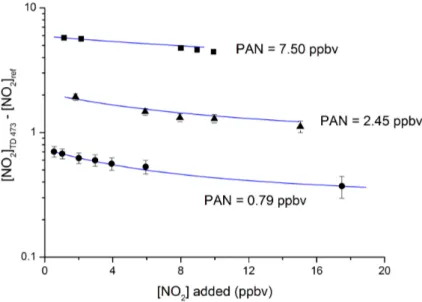
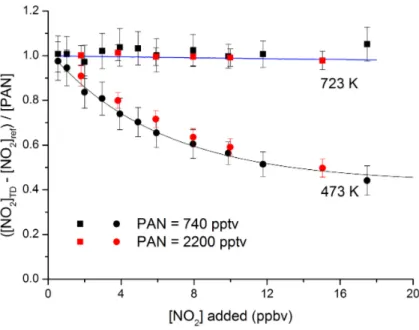
The results of experiments in which various concentrations of NO2 were added to three different concentrations of PAN are displayed in Fig. 7. In these experiments, PAN was supplied from a diffusion source of PAN in tridecane held at 273 K.
In the absence of recombination of CH3C(O)O2 radicals and NO2 the difference
15
between [NO2]TD 473 and [NO2]ref (y axis) would be a flat line at the initial PAN con-centration. The effect of reformation of PAN is clearly seen in the data, so that, at an initial concentration of about 700 pptv of PAN, only 460 pptv would be detected as [NO2]TD473−[NO2]ref if 8 ppb NO2 were also present. Even in the absence of added NO2, [NO2]TD 473−[NO2]ref is smaller than the amount of PAN added as some of the
20
700 pptv of the NO2formed in the thermal dissociation region can also recombine with CH3C(O)O2.
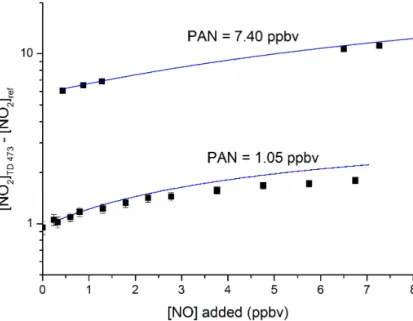
In Fig. 8 we display the results of a similar set of experiments in which NO was added instead of NO2. As expected from the reaction scheme above, by adding NO we convert CH3C(O)O2 radicals into NO2 and thus observe a positive bias in the [NO2]TD 473−
25
[NO2]refsignal. For an initial PAN concentration of about 1000 pptv, the result of adding 4 pbbv of NO is to overestimate the PAN concentration by about 180 %.
AMTD
8, 11533–11596, 2015TD-CRDS for NO2,
RO2NO2 and RONO2 J. Thieser et al.
Title Page
Abstract Introduction
Conclusions References
Tables Figures
◭ ◮
◭ ◮
Back Close
Full Screen / Esc
Printer-friendly Version
Interactive Discussion
Discussion
P
a
per
|
Discussion
P
a
per
|
Discussion
P
a
per
|
Discussion
P
a
per
|
of PN underestimation due to NO2 recombination or PN overestimation as a result of peroxy radical induced oxidation of ambient NO. The sign and size of the bias depends on the concentrations of PN, NO and NO2and also the rate of wall loss of the peroxy radicals involved (Wooldridge et al., 2010). In order to gain insight into the reactions taking place in the ovens and in the piping leading to the cavities and in the cavities
5
themselves, we conducted a detailed set of numerical simulations (FACSIMILE, Curtis and Sweetenham, 1987) of the laboratory experiments described above.
The simulations were initialised with position dependent temperature gradients in the oven and subsequent piping and cavities, which were derived by inserting a thermocou-ple into the quartz tubing and measuring the temperature of the inner wall at different
10
distances from the cold, front edge of the oven. As the 473 K oven and cavities were maintained at 800 mbar, the large variation in temperature results in significant gradi-ents in the gas-density and flow velocity in hot and cold parts of the apparatus, which were also accounted for in the simulations. The gas-phase reactions accounted for in the chemical scheme are listed in the Supplement, the temperature dependent rate
15
constants being taken mainly from IUPAC (IUPAC, 2015). The goal of the simulations was to mimic the observed dependence of the PN-NO2signals on the amounts of NO and NO2added (i.e. the data in Figs. 7 and 8).
Initial simulations confirmed that the bias due to adding NO and NO2was dependent on the assumed wall loss rate constant (kwall) of the HO and peroxy radicals.
Simula-20
tions with unrealistically large wall loss rates such as to make all other radical reactions insignificant removed the bias completely and thus could not reproduce the observa-tions. The use of very small (or zero) values ofkwall resulted in an overestimation of the bias. Althoughkwall clearly plays a role in determining the size of the bias, the use of a single value ofkwall was not able to reproduce the observed effect for different initial
25
AMTD
8, 11533–11596, 2015TD-CRDS for NO2,
RO2NO2 and RONO2 J. Thieser et al.
Title Page
Abstract Introduction
Conclusions References
Tables Figures
◭ ◮
◭ ◮
Back Close
Full Screen / Esc
Printer-friendly Version
Interactive Discussion
Discussion
P
a
per
|
Discussion
P
a
per
|
Discussion
P
a
per
|
Discussion
P
a
per
|
inversely dependent on radical densities, often described in terms of “surface passiva-tion”.
The uptake coefficient (γ) for a gas to a surface can be described by the following expression (Crowley et al., 2010a):
1 γ =
1 α+
1
Γs
+ 1 Γd
(2)
5
Here,αis the accommodation coefficient, which in this case we assume not to be rate limiting and set as 1. Γd is related to diffusive limitation to the uptake and, in tubular geometry, is approximated by:
Γd=
3.66(2Dg)
cr (3)
wherer (cm) is the radius of the tube,c(cm s−1) is the mean thermal velocity andDg
10
a diffusion coefficient (cm2s−1). Temperature and pressure dependent diffusion coeffi -cients for HO, HO2, CH3O2and CH3C(O)O2were calculated from
D(R, air)= 1.0868T
1.75
p
M(R, air)p3 VR+p3
Vair
2 (4)
WhereM is the reduced mass ofR in air,R is one of HO, HO2, CH3O2or CH3C(O)O2, andV is the diffusion volume, which can be calculated from diffusion volumes for the
15
individual atoms of each radical (Fuller et al., 1966).
In the case of a Langmuir–Hinshelwood reaction, we have:
Γs=A
KLangC (1+KLangC[R])
AMTD
8, 11533–11596, 2015TD-CRDS for NO2,
RO2NO2 and RONO2 J. Thieser et al.
Title Page
Abstract Introduction
Conclusions References
Tables Figures
◭ ◮
◭ ◮
Back Close
Full Screen / Esc
Printer-friendly Version
Interactive Discussion
Discussion
P
a
per
|
Discussion
P
a
per
|
Discussion
P
a
per
|
Discussion
P
a
per
|
Ais a composite term:
A=4ks[Y]Nmax
c (6)
whereks is the rate constant for the accommodated trace gas with a surface site Y, KLangC andNmaxdescribe the equilibrium partitioning of RO2to the surface.
We treat A as a variable for optimising agreement between observations and the
5
numerical simulation. In doing this we make some broad simplifications: we take into account the temperature and molecular mass dependence of the mean thermal ve-locity of HO2, CH3O2 and CH3C(O)O2 but do not consider the unknown temperature dependence of terms such asksandKLangC. We further assume that these terms have the same value for all the peroxy radicals involved and sum the concentrations of the
10
peroxy radicals at each time step, so that [RO2] in the above expression is equal to [CH3C(O)O2]+[CH3O2]+[HO2].
We derive temperature and pressure and thus time dependent values ofγ for each peroxy radical involved. This is then converted to individual wall losses using:
kwall(RO2)= γc
2r (7)
15
The time dependent values of kwall varied between 0.3 and 0.8 s −1
with an average value (over the transport time through the ovens and cavities) of ∼0.5 s−1, which is similar to the values of 0.2 and 0.3 s−1derived for Teflon and Quartz surface reported previously (Wooldridge et al., 2010).
The results of the simulations are shown as the solid blue lines in Figs. 7 and 8. In all
20
cases the same reaction scheme has been applied with only the initial concentration of PAN varied to reproduce the dataset. The simulations reproduce the experimental data reasonably well over large variation in PAN (∼700 to∼7000 pptv) and NO/NO2, indi-cating that the reaction scheme is a reasonable representation of the processes taking place. Some deviation (at [NO]>∼3 ppb) between the measurement and model for
AMTD
8, 11533–11596, 2015TD-CRDS for NO2,
RO2NO2 and RONO2 J. Thieser et al.
Title Page
Abstract Introduction
Conclusions References
Tables Figures
◭ ◮
◭ ◮
Back Close
Full Screen / Esc
Printer-friendly Version
Interactive Discussion
Discussion
P
a
per
|
Discussion
P
a
per
|
Discussion
P
a
per
|
Discussion
P
a
per
|
the experiment with PAN=1.05 ppbv is observed which (at 7 ppbv) amounts to∼25 %. This was largely due to fluctuations in the PAN source during this particular experi-ment and the apparent discrepancy disappears when normalised to the PAN amount as shown below for the same dataset.
The results of one experiment in which both PAN (∼560 pptv) and NO (500 pptv)
5
were initially present, and in which NO2 was varied, are also captured well by the simulations, showing that multicomponent mixtures are also correctly represented (Fig. SI 3).
One further test was conducted using a photochemical source of PAN which converts NO to NO2 and then to PAN at a yield of >90 % (see above). This source is free of
10
NO and NO2 in significant amounts and can deliver a calibrated PAN amount if the NO mixing ratio is well characterised. The lack of NO2 in this source was confirmed by observation of (no) NO2in the unheated, reference cavity. The cavity sampling from the 473 K oven displayed the expected increase in NO2, whereas the cold channel showed negligible amounts. The results are displayed in Fig. SI 4 in which we plot
15
[NO2]TD 473−[NO2]ref(solid squares) against that calculated from the conversion factor of NO to PAN and the degree of dilution (solid line). The results indicate that the amount of PAN detected is slightly less than calculated at the lowest mixing ratio and that the bias is enhanced at high PAN mixing ratios, consistent with the recombination of CH3C(O)O2 with NO2 competing with wall loss of CH3C(O)O2. The open circles are
20
the results of a set of simulations (random amounts of PAN) using the same model as described above and initialised with NO and NO2 mixing ratios of zero. The model reproduces the negligible effect of radical recombination at the lowest PAN mixing ratios and captures the dependence of the bias on PAN over a large range (factor 10) of PAN mixing ratios, further validating its applicability to systems with varying amounts of PAN,
25
NO and NO2.
AMTD
8, 11533–11596, 2015TD-CRDS for NO2,
RO2NO2 and RONO2 J. Thieser et al.
Title Page
Abstract Introduction
Conclusions References
Tables Figures
◭ ◮
◭ ◮
Back Close
Full Screen / Esc
Printer-friendly Version
Interactive Discussion
Discussion
P
a
per
|
Discussion
P
a
per
|
Discussion
P
a
per
|
Discussion
P
a
per
|
2100 pptv NO2, would result in detection of 518 pptv NO2in the TD channel, which thus has a bias of−32 pptv, requiring a correction factor of 1.06 (i.e. 6 %). For similar PAN and NO2 concentrations, but with NO reduced to close to zero (e.g. at night) the cor-rection factor increases to 1.28. Corcor-rection factors less than unity are only found when NO is in excess of NO2. E.g. for 550 pptv of PAN with 5100 pptv NO and 1600 pptv NO2,
5
the correction factor is 0.55.
In Sect. 4 we apply PAN, NO and NO2-concentration dependent correction factors to a set of data from a field campaign (PARADE, 2011). In order to do this the results of>90 000 simulations were stored in a look-up table from which correction factors for triads of PAN-NO-NO2 mixing ratios could be read. The results of the full set of
10
simulations are summarised in Fig. SI 5. As expected, correction factors greater than unity are associated with high NO2 mixing ratios and those less than unity with large NO mixing ratios. In both cases, the correction factor is smallest when PAN is low (at the limit of zero PAN, there are no RO2to recombine with or generate NO2).
723 K inlet:
15
At the higher temperatures of the 723 K inlet, the chemistry of acetyl and acetyl peroxy radicals is significantly modified compared to that detailed above. The main difference is that the CH3C(O)O2 radical initially formed in PAN decomposition is thermally in-stable and can decompose to the acetyl radical (CH3CO) and O2 (Reaction R15a) or isomerise to CH2C(O)OOH (Reaction R15b) (Lee et al., 2002; Carr et al., 2011):
20
CH3C(O)O2+M →CH3CO+O2+M (R15a)
→CH2C(O)OOH (R15b)
The major fate of CH2C(O)OOH is thermal decomposition to OH and a singlet α-lactone (Carr et al., 2011).
CH2C(O)OOH→OH+1C2H2O2 (R16)
AMTD
8, 11533–11596, 2015TD-CRDS for NO2,
RO2NO2 and RONO2 J. Thieser et al.
Title Page
Abstract Introduction
Conclusions References
Tables Figures
◭ ◮
◭ ◮
Back Close
Full Screen / Esc
Printer-friendly Version
Interactive Discussion
Discussion
P
a
per
|
Discussion
P
a
per
|
Discussion
P
a
per
|
Discussion
P
a
per
|
The acetyl radical formed in Reaction (R15a) can decompose to CH3+CO (Reac-tion R17) or react with O2 to reform the peroxy radical (Reaction R18a) or form OH (Reaction R18b) and the singletα-lactone (Groß et al., 2014; Tyndall et al., 1995; Carr et al., 2007, 2011; Chen and Lee, 2010; Papadimitriou et al., 2015):
CH3CO→ CH3+CO (R17)
5
CH3CO+O2+M→CH3C(O)O2+M (R18a)
CH3CO+O2→OH+1C2H2O2 (R18b)
CH3+O2+M→CH3O2+M (R19)
The CH3 formed in Reaction (R17) will react with O2 to form the methylperoxy radical (Reaction R19).
10
At 723 K, Reactions (R15)–(R18) proceed on timescales of ms or shorter, the net effect being destruction of CH3C(O)O2on a time scale that is short relative to its other loss processes including loss at the wall, recombination with NO2or reaction with NO. The radical products formed in these steps are OH and CH3O2. The loss of CH3C(O)O2 at 723 K will obviously reduce the potential for reformation of PAN via Reaction (R10)
15
so that the effect of adding NO2should be significantly reduced when compared to the inlet at 473 K. The reaction of CH3O2with NO2also forms a peroxynitrate (CH3O2NO2), but one which is unstable with respect to decomposition back to reactants even at moderate temperatures and this reaction does not lead to significant sequestering of NO2.
20
The effect of adding NO2 was explored in a set of experiments with different initial PAN mixing ratios and with NO2 varied up to ∼20 ppbv. The results are displayed in Fig. 9 which plots the ratio of NO2from PAN thermal dissociation to the amount of PAN added vs. [NO2] added. Ideally, in the case of complete dissociation of PAN to NO2and no subsequent recombination, this should be close to a value of unity and independent
25
AMTD
8, 11533–11596, 2015TD-CRDS for NO2,
RO2NO2 and RONO2 J. Thieser et al.
Title Page
Abstract Introduction
Conclusions References
Tables Figures
◭ ◮
◭ ◮
Back Close
Full Screen / Esc
Printer-friendly Version
Interactive Discussion
Discussion
P
a
per
|
Discussion
P
a
per
|
Discussion
P
a
per
|
Discussion
P
a
per
|
to remove NO2, and that measurements using this inlet are insensitive to variations in ambient NO2up to about 20 ppbv. By way of comparison we also plot the data obtained using the 473 K inlet in the same manner to emphasise the significant dependence on added NO2in the cooler inlet as described above.
A similar set of experiments was carried out with NO added instead of NO2, in this
5
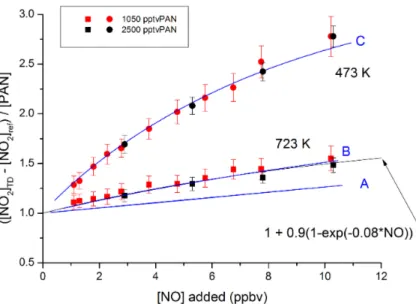
case to investigate potential bias from oxidation of ambient NO to NO2as seen for the 473 K inlet. The results are presented in Fig. 10 which plots the ratio of NO2from PAN thermal dissociation to the amount of PAN added vs. [NO] added. In the absence of any unwanted NO2 formation resulting from NO oxidation, the results should be a flat line with an intercept of 1. Figure 10 shows that NO is converted to NO2in the 723 K inlet,
10
though the effect is much reduced when compared to the 473 K inlet. For example, the effect of adding 10 ppb NO2 is to bias the PAN measured by a factor 2.75 sampling from the 473 K inlet and 1.5 when sampling from the 723 K inlet. There is no significant difference in the bias when PAN was varied between 1 and 2.5 ppb. Note that the data plotted here for the 473 K inlet is the same as that in Fig. 8.
15
As described in detail above, the large bias seen when sampling from the 473 K in-let results largely from reactions of CH3C(O)O2with NO. As CH3C(O)O2 decomposes rapidly at 723 K, the oxidation of NO to NO2at this temperature is expected to be via the CH3O2radicals formed in Reactions (R17) and (R18) and also via conversion of CH3O2 to HO2in the presence of NO/O2(Reaction R12). This could be qualitatively confirmed
20
by extending the simulations described above to cover the temperatures of the 723 K inlet. In order to do this, we scaled the temperature profile to peak at 723 K (instead of at 473 K) and also added Reactions (R15)–(R19). The rate coefficients used were from Baulch et al. (2005) (Reaction R17), (Papadimitriou et al., 2015) (Reaction R18a and R18b) with the dissociation and isomerisation rate constants taken from Lee et al. (Lee
25
AMTD
8, 11533–11596, 2015TD-CRDS for NO2,
RO2NO2 and RONO2 J. Thieser et al.
Title Page
Abstract Introduction
Conclusions References
Tables Figures
◭ ◮
◭ ◮
Back Close
Full Screen / Esc
Printer-friendly Version
Interactive Discussion
Discussion
P
a
per
|
Discussion
P
a
per
|
Discussion
P
a
per
|
Discussion
P
a
per
|
in Fig. 10 (blue line, labelled A) does however capture the observed reduction in oxi-dation of NO to NO2 in the 723 K inlet compared to the 473 K inlet (blue line, labelled “C”). Simulation “C” was obtained using the same simulation but with the temperature profile for the 473 K inlet.
The amount of NO2 formed depends on the abundance of CH3O2and HO2, so that
5
the simulated NO2 generation is favoured by higher rates of CH3C(O)O2 dissociation to CH3CO rather than isomerisation to CH2C(O)OOH and higher rates of CH3CO dis-sociation to CH3relative to reaction with O2, which ultimately leads to OH (which can remove NO2 by forming HNO3) rather than CH3O2 or HO2. An improved match be-tween observation and model (Fig. 10, blue curve marked “B”) was achieved by
re-10
ducing the rate of isomerisation of CH3C(O)O2 to CH2C(O)OOH to 20 % of the value reported by Lee et al. (2002) at 723 K. This value is strongly dependent on calculated barrier heights and is particularly uncertain, as has been noted by Carr et al. (2011). We do not seek to imply that our data constrain this kinetic parameter as there are certainly other factors that can also affect the NO2production rate, including the rates
15
of wall losses of radicals and the relative rates of decomposition and isomerisation of CH3C(O)O2and the thermal stability of CH3CO.
In summary, in the absence of ANs, the experiments sampling PAN via the 723 K inlet reveal that there is no significant bias when adding NO2, and that the (positive) bias introduced by the addition of NO is independent of the amount of PAN, at least
20
up to 2–3 ppbv PAN. This simplification of the chemistry compared to the 473 K inlet removes the need for complex simulations to correct the dataset. The NO2mixing ratio resulting from the presence of PAN and NO in the 723 K inlet is adequately described by the expression PAN×(1+0.9(1−exp(−0.08×NO))) with NO being the NO mixing ratio in ppb (solid black line in Fig. 10), which returns correction factors of 0.94 at 1 ppb
25
AMTD
8, 11533–11596, 2015TD-CRDS for NO2,
RO2NO2 and RONO2 J. Thieser et al.
Title Page
Abstract Introduction
Conclusions References
Tables Figures
◭ ◮
◭ ◮
Back Close
Full Screen / Esc
Printer-friendly Version
Interactive Discussion
Discussion
P
a
per
|
Discussion
P
a
per
|
Discussion
P
a
per
|
Discussion
P
a
per
|
We now consider the chemistry taking place when ANs are present. For the 723 K inlet and considering 2-propylnitrate the additional reactions are:
2-C3H7ONO2→2-C3H7O+NO2 (R20)
2-C3H7O+O2→CH3C(O)CH3+HO2 (R21)
2-C3H7O+M→CH3+CH3CHO (R22)
5
HO2+NO→NO2+OH (R13)
The CH3 radical is immediately converted to CH3O2 so that the radical pool is again a mixture of CH3O2 and HO2, both of which may convert NO to NO2. As neither CH3O2NO2 nor HO2NO2are sufficiently thermally stable to sequester NO2these rad-icals should not lead to loss of NO2 via recombination. In the 723 K inlet, this
chemi-10
cal system should therefore behave similarly to the one described above for PAN, i.e. should suffer from positive bias when adding NO but no negative bias when adding NO2.
The results from a set of experiments to explore the effects of adding NO2 to vari-ous amounts of 2-propylnitrate are displayed in Fig. 11. NO2was varied between∼0.5
15
and 12 ppb for 2-propylnitrate mixing ratios of 0.35, 0.75 and 2.6 ppb. The bias from adding NO2 at these levels is not measurable at the lowest 2-propylnitrate mixing ra-tios, though the data at 2.6 ppb indicate a weak reduction in the measured AN mixing ratio. The model described above was extended with Reactions (R20) to (R22) and initiated with the 2-propylnitrate mixing ratios observed in the absence of extra NO2.
20
The results are shown by the blue lines in Fig. 11. Once again the model satisfacto-rily predicts the trends observed for each experiment, including the weak loss (5 %) of NO2observed at the highest 2-propylnitrate mixing ratio. The simulations revealed that the sole significant “reservoir” of this missing 5 % of 2-propylnitrate was in the form of CH3O2NO2.
25
AMTD
8, 11533–11596, 2015TD-CRDS for NO2,
RO2NO2 and RONO2 J. Thieser et al.
Title Page
Abstract Introduction
Conclusions References
Tables Figures
◭ ◮
◭ ◮
Back Close
Full Screen / Esc
Printer-friendly Version
Interactive Discussion
Discussion
P
a
per
|
Discussion
P
a
per
|
Discussion
P
a
per
|
Discussion
P
a
per
|
(blue lines) also indicates that this is expected, the main oxidant of NO being CH3O2. The effect of adding 5 ppb of NO2 is not observable, consistent with the weak effects described above in the absence of NO.
A more detailed look at the relative bias caused by adding NO is provided by Fig. 13, which plots the ratio of the AN signal in the presence of NO to that without added
5
NO. There is no clear trend in the dataset with the largest effects (i.e. the uppermost and lowermost data points not associated with the extremes of 2-propylnitrate mixing ratios. The positive bias caused by the presence of NO is adequately described by the expression 1+1.8(1−exp(−0.08×NO)) with NO being the NO mixing ratio in ppb. This is plotted as the solid black line in Fig. 13. The blue lines are the model prediction when
10
initialised with 0.56 (upper blue line) and 5.78 ppbv (lower blue line) 2-propylnitrate, respectively. The model correctly predicts the strong response of adding NO and the weak effects caused by using two different 2-propylnitrate concentrations that differ by a factor of∼10.
We conclude that the (negative) bias caused by addition of NO2 to samples of
2-15
propylnitrate is small and, to a good approximation, independent of the 2-propylnitrate mixing ratio. The positive bias caused by oxidation of NO (by CH3O2) is sufficiently large to require correction, the appropriate factor given by the inverse of the expression 1+1.8(1−exp(−0.08×NO)).
As a final test of our understanding of the chemistry, experiments were conducted
20
in which the four components: NO (0.5 ppbv), NO2 (varied) PAN (0.53 ppb) and 2-propylnitrate (0.19 ppb) were present. The results are displayed in Fig. 14. The model (blue lines) correctly predicts the total signal observed in both channels allowing us to conclude that, within experimental error, the model chemistry simulates the effects of radical recombination and radical induced oxidation of NO to NO2in both inlets/cavities.
25
AMTD
8, 11533–11596, 2015TD-CRDS for NO2,
RO2NO2 and RONO2 J. Thieser et al.
Title Page
Abstract Introduction
Conclusions References
Tables Figures
◭ ◮
◭ ◮
Back Close
Full Screen / Esc
Printer-friendly Version
Interactive Discussion
Discussion
P
a
per
|
Discussion
P
a
per
|
Discussion
P
a
per
|
Discussion
P
a
per
|
to calculate its (NO dependent) contribution to the observed total NO2measured when sampling from the 723 K inlet. This contribution is subtracted and the result divided by 1+1.8(1−exp(−0.08×NO)). This leads to the final expression to derive corrected
ΣANs:
[ANs]=[NO2]TD 723−[NO2]ref−[PAN]F1
F2
(8)
5
With correction factors F1=1+0.9(1−exp(−0.08[NO])) and F2=1+1.8(1− exp(−0.08[NO])), where [i] are mixing ratios in ppbv. When the NO mixing ratio is zero Eq. (8) reduces to: [ANs]=[NO2]TD723−[NO2]ref−[PAN].
The laboratory tests we describe above provide insight into the radical reactions that take place in the heated inlets. The tests were conducted with PAN as a
representa-10
tive peroxynitrate and with 2-propylnitrate representing alkylnitrates. Although the initial thermal decomposition of other PNs and ANs is likely to be follow a very similar pattern (Wooldridge et al., 2010; Perring et al., 2013; Day et al., 2002), we cannot rule out that the organic radicals formed with e.g. different functional groups will behave some-what differently and would thus require modified correction factors. Comparison with
15
instruments measuring both speciated and summed PNs and ANs would be required to examine this.
2.1.8 Other absorbing trace gases at 405–408.5 nm
The potential for systematic error owing to light absorption at 405 or 408.5 nm is limited to a small number of trace gases that absorb at such wavelengths. Those
20
known to be present in the atmosphere are dicarbonyls such as glyoxal (CH(O)CH(O)), methylglyoxal (CH3C(O)CH(O)) and biacetyl (CH3C(O)CH3C(O)) which are formed from the degradation of many volatile organic compounds including isoprene and aro-matics (Atkinson, 1994; Calvert et al., 2000, 2002). The absorption cross sections of these di-carbonyls at wavelengths between 405 and 410 nm are approximately
25
AMTD
8, 11533–11596, 2015TD-CRDS for NO2,
RO2NO2 and RONO2 J. Thieser et al.
Title Page
Abstract Introduction
Conclusions References
Tables Figures
◭ ◮
◭ ◮
Back Close
Full Screen / Esc
Printer-friendly Version
Interactive Discussion
Discussion
P
a
per
|
Discussion
P
a
per
|
Discussion
P
a
per
|
Discussion
P
a
per
|
about a factor 10 lower than those of NO2(see Fig. 2). Although high mixing ratios of e.g. glyoxal (>1 ppbv) have been observed in polluted environments (Volkamer et al., 2005a) its contribution to absorption is estimated to be insignificant compared to NO2 (Fuchs et al., 2009). In rural environments peak mixing ratios of glyoxal and methylgly-oxal of up to 200–300 pptv have been reported (Yin-Nan et al., 1995; Huisman et al.,
5
2011). This would generate a bias of ∼20–30 pptv in the NO2 measurement, which corresponds to an error of five percent if NO2levels are less than∼400 pptv.
NO3 radicals also absorb at 405 nm, with a cross-section of ∼3×
10−20cm2molecule−1. I.e. a factor 20 less than NO2. NO3 mixing ratios of sev-eral hundred pptv (only at night) have been reported (see e.g. Crowley et al., 2010b)
10
so that the NO3 contribution to extinction at ∼400 nm could exceed that of the di-carbonyls discussed above. However, as NO2 serves as precursor to NO3, its mixing ratios are always much larger so that, even if NO3was efficiently sampled into the cavity, its contribution to absorption at 405 nm would be negligible.
2.1.9 Detection of N2O5(473 K) and ClNO2(723 K) 15
Numerous studies have reported the measurement of N2O5 via thermal dissociation at temperatures between 80 and 100◦C to NO3, which may be detected by CRDS at 662 nm (see e.g. Brown and Stutz, 2012, and references therein). As the co-product of the thermal dissociation is NO2, the presence of N2O5 also represents a potential interference when sampling from either of the heated inlet lines. We have used the
20
thermal dissociation of N2O5 and detection of NO2 using CRDS at 405 nm to detect N2O5in this manner in laboratory investigations (Tang et al., 2012).
N2O5 is not present in significant mixing ratios during the day but can represent a significant fraction of oxidized nitrogen at night-time. In the dataset obtained at the PARADE campaign, we observed occasional increases in NO2 when sampling from
25