ACPD
15, 33843–33896, 2015Aqueous phase sulphur dioxide
oxidation
C. R. Hoyle et al.
Title Page
Abstract Introduction
Conclusions References
Tables Figures
◭ ◮
◭ ◮
Back Close
Full Screen / Esc
Printer-friendly Version Interactive Discussion
Discussion
P
a
per
|
Discussion
P
a
per
|
Discussion
P
a
per
|
Discussion
P
a
per
|
Atmos. Chem. Phys. Discuss., 15, 33843–33896, 2015 www.atmos-chem-phys-discuss.net/15/33843/2015/ doi:10.5194/acpd-15-33843-2015
© Author(s) 2015. CC Attribution 3.0 License.
This discussion paper is/has been under review for the journal Atmospheric Chemistry and Physics (ACP). Please refer to the corresponding final paper in ACP if available.
Aqueous phase oxidation of sulphur
dioxide by ozone in cloud droplets
C. R. Hoyle1,2, C. Fuchs1, E. Järvinen3, H. Saathoff3, A. Dias4, I. El Haddad1, M. Gysel1, S. C. Coburn5, J. Tröstl1, A.-K. Bernhammer6,16, F. Bianchi1, M. Breitenlechner6, J. C. Corbin1, J. Craven7,a, N. M. Donahue8, J. Duplissy9, S. Ehrhart4, C. Frege1, H. Gordon4, N. Höppel3, M. Heinritzi10, T. B. Kristensen11, U. Molteni1, L. Nichman12, T. Pinterich13, A. S. H. Prévôt1, M. Simon10,
J. G. Slowik1, G. Steiner9,6,13, A. Tomé14, A. L. Vogel4, R. Volkamer5,
A. C. Wagner10, R. Wagner9, A. S. Wexler15, C. Williamson10,b,c, P. M. Winkler13, C. Yan9, A. Amorim14, J. Dommen1, J. Curtius10, M. W. Gallagher12,18,
R. C. Flagan7, A. Hansel6,16, J. Kirkby4,10, M. Kulmala9, O. Möhler3, F. Stratmann11, D. Worsnop9,17, and U. Baltensperger1
1
Laboratory of Atmospheric Chemistry, Paul Scherrer Institute, Villigen, Switzerland
2
WSL Institute for Snow and Avalanche Research SLF Davos, Switzerland
3
Karlsruhe Institute of Technology, Institute for Meteorology and Climate Research, P.O. Box 3640, 76021 Karlsruhe, Germany
4
CERN, 1211 Geneva, Switzerland
5
ACPD
15, 33843–33896, 2015Aqueous phase sulphur dioxide
oxidation
C. R. Hoyle et al.
Title Page
Abstract Introduction
Conclusions References
Tables Figures
◭ ◮
◭ ◮
Back Close
Full Screen / Esc
Printer-friendly Version Interactive Discussion
Discussion
P
a
per
|
Discussion
P
a
per
|
Discussion
P
a
per
|
Discussion
P
a
per
|
6
University of Innsbruck, Institute for Ion Physics and Applied Physics, Technikerstrasse 25, 6020 Innsbruck, Austria
7
California Institute of Technology, Department of Chemical Engineering, Pasadena, CA, 91125, USA
8
Carnegie Mellon University Center for Atmospheric Particle Studies, 5000 Forbes Ave, Pittsburgh, PA 15213, USA
9
Division of Atmospheric Sciences, Department of Physics, P.O. Box 64, 00014, University of Helsinki, Finland
10
Goethe University of Frankfurt, Institute for Atmospheric and Environmental Sciences, 60438 Frankfurt am Main, Germany
11
Leibniz Institute for Tropospheric Research, Permoserstrasse 15, 04318 Leipzig, Germany
12
School of Earth, Atmospheric and Environmental Sciences, University of Manchester, Manchester, M13 9PL, UK
13
University of Vienna, Faculty of Physics, Aerosol and Environmental Physics, Boltzmanngasse 5, 1090 Vienna, Austria
14
CENTRA-SIM, University of Lisbon and University of Beira Interior, 1749-016 Lisbon, Portugal
15
Departments of Mechanical and Aeronautical Engineering, Civil and Environmental Engineering, and Land, Air, and Water Resources, University of California, Davis, CA, USA
16
Ionicon Analytik GmbH, Eduard-Bodem-Gasse 3, 6020 Innsbruck, Austria
17
Aerodyne Research Inc., Billerica, MA, 01821, USA
18
NERC Instrument PI, National Centre for Atmospheric Science (NCAS), Leeds, UK
a
now at: Portland Technology Development Division of Intel, Hillsboro, OR, USA
b
now at: Chemical Sciences Division NOAA Earth System Research Laboratory 325 Broadway R/CSD2 Boulder, CO, USA
c
also at: Cooperative Institute for Research in Environmental Sciences, University of Colorado Boulder, Boulder, CO, USA
Received: 30 October 2015 – Accepted: 19 November 2015 – Published: 1 December 2015
Correspondence to: C. R. Hoyle ([email protected])
ACPD
15, 33843–33896, 2015Aqueous phase sulphur dioxide
oxidation
C. R. Hoyle et al.
Title Page
Abstract Introduction
Conclusions References
Tables Figures
◭ ◮
◭ ◮
Back Close
Full Screen / Esc
Printer-friendly Version Interactive Discussion
Discussion
P
a
per
|
Discussion
P
a
per
|
Discussion
P
a
per
|
Discussion
P
a
per
|
Abstract
The growth of aerosol due to the aqueous phase oxidation of SO2by O3was measured in laboratory generated clouds created in the CLOUD chamber at CERN. Experiments were performed at 10 and −10◦C, on acidic (sulphuric acid) and on partially to fully
neutralised (ammonium sulphate) seed aerosol. Clouds were generated by perform-5
ing an adiabatic expansion – pressurising the chamber to 220 hPa above atmospheric pressure, and then rapidly releasing the excess pressure, resulting in a cooling, con-densation of water on the aerosol and a cloud lifetime of approximately 6 min. A model was developed to compare the observed aerosol growth with that predicted by oxida-tion rates previously measured in bulk soluoxida-tions. The model captured the measured 10
aerosol growth very well for experiments performed at 10 and−10◦C, indicating that,
in contrast to some previous studies, the oxidation rates of SO2in a dispersed aqueous system are well represented by accepted rates, based on bulk measurements. To the best of our knowledge, these are the first laboratory based measurements of aqueous phase oxidation in a dispersed, super-cooled population of droplets. The measure-15
ments are therefore important in confirming that the extrapolation of currently accepted reaction rates to temperatures below 0◦C is correct.
1 Introduction
Sulphur dioxide is an important tropospheric species, influencing air quality as well as the acidity of precipitation (and therefore that of soil, lakes and rivers). It also influences 20
climate directly and indirectly through its oxidation to sulphate and subsequent role in atmospheric new particle formation (e.g. Kulmala, 2003; Riccobono et al., 2014), and the growth of aerosol particles (e.g. Hoppel et al., 1994a) and thus its effect on their CCN properties (e.g. Hobbs, 1971).
Global anthropogenic emissions of SO2 around the year 1990 were estimated to 25
emis-ACPD
15, 33843–33896, 2015Aqueous phase sulphur dioxide
oxidation
C. R. Hoyle et al.
Title Page
Abstract Introduction
Conclusions References
Tables Figures
◭ ◮
◭ ◮
Back Close
Full Screen / Esc
Printer-friendly Version Interactive Discussion
Discussion
P
a
per
|
Discussion
P
a
per
|
Discussion
P
a
per
|
Discussion
P
a
per
|
sions from natural sources. Similar values were given by Faloona (2009) in a review of modelled SO2 emissions. In heavily industrialised regions, the ratio of anthropogenic to natural emissions can be higher than 10. Although air quality legislation in Europe and the USA has led to a significant decline of industrial emissions of SO2 in the last couple of decades, emissions from Asia and developing countries in other locations 5
are increasing (Forster et al., 2007).
The major sink of atmospheric SO2 is oxidation to sulphate, estimated at approxi-mately 51 Tg S yr−1(Faloona, 2009), and anthropogenic emissions of SO2 account for approximately 72 % of sulphate aerosol in the atmosphere (Forster et al., 2007).
SO2 is either oxidised in the gas phase (by reaction with the OH radical), or it can 10
be taken up by cloud droplets and undergo aqueous phase oxidation. In the aqueous phase, oxidation is primarily by reaction with H2O2 or O3, with the O3 reaction be-coming larger than typical gas phase reaction rates at pH higher than approximately 4 (Seinfeld and Pandis, 2006). Model studies suggest that aqueous oxidation comprises a large majority of the global sulphate production, perhaps 80 % or more (Faloona, 15
2009; Barth et al., 2000), however the range of model estimates is rather large, reflect-ing the difficulty in reproducing cloud processes in large scale models.
The aqueous phase oxidation of SO2by O3 proceeds by the absorption of SO2into the cloud droplet, and the establishment of equilibrium between SO2·H2O, HSO−3, and SO23−. Dissolved O3 then oxidises the latter three species, forming SO24−. The Henry’s 20
law coefficients for dissolution of O3 and SO2, as well as the equilibrium constants for the hydration of SO2 and the reaction rates for the subsequent reaction with O3 have all been well studied in bulk solutions in the past (predominantly at temperatures of approximately 20◦C or higher, see Sect. 3.2). The oxidation rates recommended by Hoffmann (1986) are commonly adopted in models simulating cloud chemistry (for ex-25
ample, all of the 7 models simulating SO2 oxidation in clouds, which were compared by Kreidenweis et al., 2003, used these rates). However, to the best of our knowledge, no studies have been performed at temperatures below 0◦
ACPD
15, 33843–33896, 2015Aqueous phase sulphur dioxide
oxidation
C. R. Hoyle et al.
Title Page
Abstract Introduction
Conclusions References
Tables Figures
◭ ◮
◭ ◮
Back Close
Full Screen / Esc
Printer-friendly Version Interactive Discussion
Discussion
P
a
per
|
Discussion
P
a
per
|
Discussion
P
a
per
|
Discussion
P
a
per
|
temperatures. The temperature dependence recommended by Hoffmann (1986), and adopted in most modelling studies, is that of Erickson et al. (1977), based on mea-surements at 25 and 16◦C. In that study, experiments were only performed up to a pH of 4.02, where the vast majority (i.e. 0.994) of dissolved S(IV) is present as HSO−3. At higher pH, as encountered in cloud droplets, more of the S(IV) is present as SO23−, 5
which reacts with O3at a rate approximately 4 orders of magnitude faster than that of HSO−3. The temperature dependence of this reaction is therefore very important. Mea-surements performed by Maahs (1983), at 25 and 10◦C, using buffered solutions at pH up to 6.2 suggest a slightly weaker temperature dependence, and therefore greater oxidation rates at low temperatures than suggested by Erickson et al. (1977).
10
A few previous cloud chamber studies have examined the aqueous phase oxidation of SO2 in cloud droplets, hydrated aerosol, and fogs, with the aim of reconciling re-action rates measured in bulk solutions with those inferred from S(VI) production in a dispersed aqueous system. As discussed below, the results are mixed, and it is not possible to exclude the influence of un-measured contaminants on the rate of S(IV) 15
oxidation.
The 6.7 m3, Desert Research Institute Dynamic Cloud Chamber was described by Steele et al. (1981), who performed experiments with the oxidation of SO2in droplets formed on a range of CCN, without the addition of additional oxidants such as O3. The same chamber was then used by Miller et al. (1986) to perform experiments with the 20
addition of O3. They used a Na2SO4 seed aerosol, and formed clouds by performing adiabatic expansions, that produced temperature decreases from approximately 21 to 10◦C, and cloud lifetimes of 440 to 490 s. Although the chamber could maintain a min-imum wall temperaure of−40◦C, they only performed experiments beginning around
20◦C, representative of warm clouds. Similarly to the present study, they used O3 mix-25
ACPD
15, 33843–33896, 2015Aqueous phase sulphur dioxide
oxidation
C. R. Hoyle et al.
Title Page
Abstract Introduction
Conclusions References
Tables Figures
◭ ◮
◭ ◮
Back Close
Full Screen / Esc
Printer-friendly Version Interactive Discussion
Discussion
P
a
per
|
Discussion
P
a
per
|
Discussion
P
a
per
|
Discussion
P
a
per
|
et al. (1977) in bulk solutions, suggesting that such rates are indeed applicable to the chemistry occuring in cloud droplets, at warm temperatures.
The aqueous phase oxidation of SO2 by H2O2 and by O3 was also investigated in the Calspan 590 m3 environmental chamber by Hoppel et al. (1994b). The chamber was filled with outside air that had been filtered through activated charcoal and aerosol 5
filters and experiments were performed at ambient temperature. After humidifying the air and injecting O3 and SO2, they achieved 4 min cloud periods by performing adia-batic expansions from 15 mb over atmospheric pressure to 5 mb below atmospheric pressure. Aqueous phase oxidation rates determined from the resulting aerosol growth were found to be much higher than the bulk measurement based rates recommended 10
by Hoffmann (1986). This experiment was repeated by Caffrey et al. (2001), with im-proved instrumentation and an imim-proved model, but the measured oxidation rates were still found to be a factor of 5 higher than those of Hoffmann (1986). Small amounts of un-measured ammonia contamination (increasing the droplet pH and raising the reac-tion rate) were given as a possible explanareac-tion.
15
The CLOUD (Cosmics Leaving Outdoor Droplets) chamber at CERN provides an es-sentially contaminant free, and precisely controlled environment in which to perform ex-perimental observations of aqueous phase reactions occuring in cloud droplets. In this study, the aqueous phase oxidation rate of SO2 by O3, in cloud droplets is examined. This study is based on measurements performed during two experimental campaigns, 20
in 2013 (CLOUD8) and 2014 (CLOUD9). Experiments were carried out at tempera-tures of 10 and−10◦C, with acidic (H2SO4) and partially to fully neutral (ammonium
sulphate) aerosol as CCN, and a chemical-microphysical model of the chamber was written to compare commonly accepted reaction rates with the formation of sulphate observed in the cloud chamber droplets.
25
ACPD
15, 33843–33896, 2015Aqueous phase sulphur dioxide
oxidation
C. R. Hoyle et al.
Title Page
Abstract Introduction
Conclusions References
Tables Figures
◭ ◮
◭ ◮
Back Close
Full Screen / Esc
Printer-friendly Version Interactive Discussion
Discussion
P
a
per
|
Discussion
P
a
per
|
Discussion
P
a
per
|
Discussion
P
a
per
|
2 Experimental setup
The experiments were conducted in the CLOUD chamber at CERN. The chamber consists of a 3 m diameter electro-polished stainless steel cylinder, with a volume of 26.1 m3. The temperature in the chamber can be accurately controlled at any point be-tween 183 and 300 K, by regulating the temperature of air flowing bebe-tween the chamber 5
wall and its thermal insulation housing (Kirkby et al., 2011). Experiments are performed in a well-mixed flow chamber mode, with the sample air drawn offby the instruments continually being replaced, and the mixing ratio of any added gas phase species being held approximately constant. In CLOUD8, the sample flow, and therefore the addition of gases to the chamber totalled 250 L min−1, leading to a dilution lifetime of 105 min. 10
In CLOUD9, the sample flow demands of the instruments were lower, leading to a flow of 150 L min−1and thus a dilution lifetime of 174 min. As species such as O3and SO2 were continually added to the chamber to maintain approximately constant mixing ra-tios, the dilution lifetime only applies to the concentration of the aerosol particles.
Gases in the chamber were mixed by two stainless steel fans, mounted at the top and 15
bottom of the chamber, and magnetically coupled to their gearboxes that are mounted outside the chamber. Between CLOUD8 and CLOUD9, the gearboxes were upgraded to allow a fourfold increase in fan speed, but, for the experiments presented here, the fans were set to the same speed in CLOUD8 and CLOUD9. At the beginning of a series of experiments, the chamber is cleaned by heating to 373 K, flushing with ultra-pure 20
water, and drying with a pure air flow, resulting in extremely low levels of contaminants. The pure air added to the chamber is created by the evaporation of liquid N2and liquid O2, at a ratio of 79 : 21. The desired relative humidity (RH) in the chamber is achieved by passing the necessary fraction of the inflow air through a Nafion humidifier, using water which was purified by recirculation through a bank of Millipore Super-Q filters 25
ACPD
15, 33843–33896, 2015Aqueous phase sulphur dioxide
oxidation
C. R. Hoyle et al.
Title Page
Abstract Introduction
Conclusions References
Tables Figures
◭ ◮
◭ ◮
Back Close
Full Screen / Esc
Printer-friendly Version Interactive Discussion
Discussion
P
a
per
|
Discussion
P
a
per
|
Discussion
P
a
per
|
Discussion
P
a
per
|
experiments (1 % NH3in N2). O3is created by irradiating a pure air flow at wavelengths below 200 nm, in an external O3generator, from which it is piped into the chamber. All gases have dedicated lines for injection into the chamber to avoid contamination and reactions occurring in the gas lines. Fittings and gas lines are made from stainless steel to avoid contamination.
5
2.1 Expansion system
By increasing the input flow of air beyond the sample flow drawn offby the instruments, the chamber can be pressurised up to 220 hPa above ambient pressure. This overpres-sure can be released through an exhaust valve, resulting in an adiabatic cooling, and, at sufficiently high initial RH, the activation of aerosol particles to form cloud droplets. 10
At lower temperatures, ice particles may form. The pressure-release valve is computer controlled, and can be programmed to follow a linear decrease in pressure over a given time period, or to follow any other prescribed pressure profile, such as an initial rapid pressure decrease until a cloud is formed, followed by a slower pressure reduction to maintain the cloud as long as possible. A vacuum pump is mounted in the exhaust line, 15
to ensure that the rate of change of pressure does not decrease with the difference be-tween the chamber and ambient pressure. During and after the adiabatic cooling, the air in the chamber is continually heated by the chamber walls, as the temperature con-trol system is maintained at the pre-expansion temperature, causing the evaporation of the cloud after approximately 4–6 min.
20
2.2 Temperature and pressure measurement
The temperature and pressure measurements in the CLOUD chamber are described in detail by Dias et al., 2015 (manuscript in preparation). The temperature inside the chamber was measured with a string of 6 thermocouples (TC, type K) which were mounted horizontally between the chamber wall and the centre of the chamber at dis-25
ACPD
15, 33843–33896, 2015Aqueous phase sulphur dioxide
oxidation
C. R. Hoyle et al.
Title Page
Abstract Introduction
Conclusions References
Tables Figures
◭ ◮
◭ ◮
Back Close
Full Screen / Esc
Printer-friendly Version Interactive Discussion
Discussion
P
a
per
|
Discussion
P
a
per
|
Discussion
P
a
per
|
Discussion
P
a
per
|
thermocouples was located midway between the top and bottom of the chamber. The TC have a precision of below 0.1◦C, and were calibrated by an in-situ measurement with a string of well calibrated Pt100 sensors (one at each TC position). The tempera-ture measured before, during and after an expansion is shown in Fig. 1. During normal operation, there was no systematic horizontal gradient across the chamber. During ex-5
pansions, a small oscillation in the temperature was observed. This is caused by the mixing of air within the chamber, with the variation between the temperature sensors being typically lower than approximately 0.5◦C. In the modelling work here, the tem-perature was taken as the mean of the 3 innermost TCs (TC4–TC6).
The pressure in the chamber was measured by a Vegabar 51 pressure transmitter 10
with a precision of 0.1 bar.
2.3 Trace gas and aerosol measurement configuration
The gas phase concentrations of SO2 and O3 were measured by trace gas moni-tors (Enhanced Trace Level SO2 Analyser, Model 43i-TLE, Thermo Scientific and O3 Analyser, Thermo Environmental Instruments Inc., Model 49C, respectively). A proton 15
transfer reaction time of flight mass spectrometer (PTR-TOF-MS) with a mass resolv-ing power of 4000–5000 (m/∆m, FWHM) and a mass accuracy within 10 ppm (Graus et al., 2010) was present, however the gas phase ammonia was typically below the de-tection limit during the experiments. The aerosol particle number size distributions were simultaneously measured by three different Scanning Mobility Particle Sizer (SMPS) 20
systems, consisting of a Differential Mobility Sizer (DMA) and a Condensation Particle Counter (CPC, TSI model 3010). The first of these was attached to a total sampling line that allowed the measurement of all aerosols in the chamber. The second was attached to a cyclone, with a cut offof 2 µm, which enabled the measurement of the in-terstitial (i.e. non-activated) aerosol during the cloud periods. During the subsaturated 25
ACPD
15, 33843–33896, 2015Aqueous phase sulphur dioxide
oxidation
C. R. Hoyle et al.
Title Page
Abstract Introduction
Conclusions References
Tables Figures
◭ ◮
◭ ◮
Back Close
Full Screen / Esc
Printer-friendly Version Interactive Discussion
Discussion
P
a
per
|
Discussion
P
a
per
|
Discussion
P
a
per
|
Discussion
P
a
per
|
flow rate set for a cutoff of 5 µm, thus sampling only the aerosol contained in cloud droplets. The three SMPS systems scanned the size range between 17 and 415 nm approximately every minute. Unfortunately, the PCVI and cyclone appear to have been influenced by pressure changes during the expansions. It is, therefore, not possible to clearly identify the activated fraction of aerosol from these measurements.
5
The total humidity in the chamber was measured by MBW dew point mirror instru-ments (model MBW973 during CLOUD9 and MBW373LX during CLOUD8) attached to a heated sampling line. During CLOUD9 a tuneable diode laser (TDL) hygrometer, comparable to the APicT instrument as described by Fahey et al. (2014), was used to measure the water vapour content in-situ with 1 Hz time resolution using a single 10
optical path once across the middle plane of the CLOUD chamber. From the diff er-ence between total water and water vapour, the liquid water content (LWC) or ice wa-ter content (IWC) could be calculated. An optical particle sizer (WELAS Promo 2000, Palas GmbH) measured the droplet size distributions during the cloud periods. An in-situ particle backscatter instrument (the SIMONE, Schnaiter et al., 2012) detected the 15
presence of droplets and phase transitions within the chamber. The droplet size dis-tributions were also measured during the cloud periods with the cloud and aerosol spectrometer with polarisation detection (CASPOL), which measures the forward and backward scattering from single particles in the diameter range of 0.6 to 50 µm (Glen and Brooks, 2013).
20
During both CLOUD8 and CLOUD9, the saturation relative humidity (100 % with re-spect to liquid water) was determined from the chamber temperature at the time that the SIMONE first detected an increased forward scattering signal, indicating the begin-ning of droplet growth. As the SIMONE measured in-situ, and was not influenced by transmission effects or temperature changes in the sampling line, it is expected that this 25
ACPD
15, 33843–33896, 2015Aqueous phase sulphur dioxide
oxidation
C. R. Hoyle et al.
Title Page
Abstract Introduction
Conclusions References
Tables Figures
◭ ◮
◭ ◮
Back Close
Full Screen / Esc
Printer-friendly Version Interactive Discussion
Discussion
P
a
per
|
Discussion
P
a
per
|
Discussion
P
a
per
|
Discussion
P
a
per
|
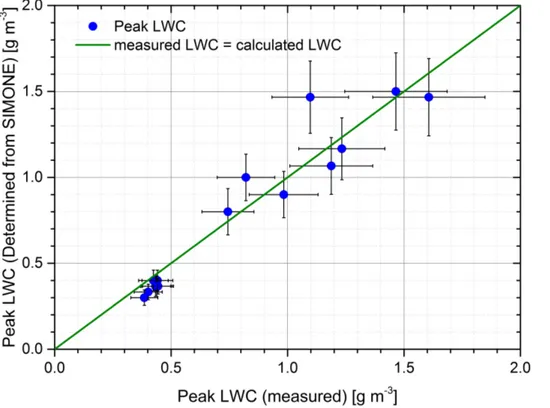
the scattering signal. The total water content of the air in the chamber was assumed to be constant over the time scale of the experiments modelled here. As aerosol growth was only observed during the cloud periods, and the dew point was determined at the beginning of each 4–6 min cloud period, the assumption of constant total water content is not expected to influence the results. This approach was validated during CLOUD9 5
by comparison with the TDL data. In Fig. 2, the SIMONE derived and measured peak condensed water during CLOUD9 expansions is plotted. The SIMONE derived values are calculated from the dew point determined as described above, the measured con-densed water is found by taking the difference of the TDL (which only measures gas phase water) and the MBW (which measures total water after the droplets have been 10
evaporated). From this comparison, it can be seen that the dew point and thus the total condensed water can be accurately determined using the combination of SIMONE and temperature data.
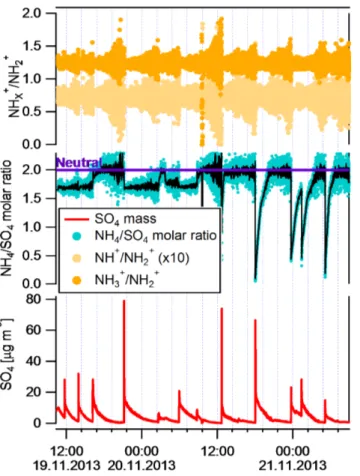
During both CLOUD8 and CLOUD9, aerosol composition (ammonium to sulphate ra-tio) was measured with an Aerodyne high-resolution time-of-flight aerosol mass spec-15
trometer (HR-ToF-AMS, DeCarlo et al., 2006). To dry the sample flow, a Nafion dryer (PermaPure) was attached to the sampling line prior to the HR-ToF-AMS, and a pres-sure controlled inlet (PCI), as described in Bahreini et al. (2008), was used to eliminate the effects of pressure variations in the sampling line on the measured concentrations. The ionic composition of the aerosol formed is derived from HR-ToF-AMS data using 20
the PIKA software package. A critical parameter required in the model is the ammo-nium to sulphate ratio (ASR) in the aerosol phase, which influences the pH of the cloud droplets and consequently SO2 reaction rates. The determination of this ratio heav-ily depends on the relative ionisation efficiencies (RIE) of ammonium and sulphate. Ammonium RIE, equal to 3.9±0.2, was determined during the IE calibration by neb-25
ulising NH4NO3, whereas the sulphate RIE, equal to 1.38±0.07, was determined by
ACPD
15, 33843–33896, 2015Aqueous phase sulphur dioxide
oxidation
C. R. Hoyle et al.
Title Page
Abstract Introduction
Conclusions References
Tables Figures
◭ ◮
◭ ◮
Back Close
Full Screen / Esc
Printer-friendly Version Interactive Discussion
Discussion
P
a
per
|
Discussion
P
a
per
|
Discussion
P
a
per
|
Discussion
P
a
per
|
ions normalised by that of NH+2. The clustering of these ratios around a single value (NH+3/NH+2 =1.23±0.05 and NH+/NH+2 =0.072±0.008), irrespective of NH+4 concen-tration indicate that the interference from O+ and HO+ is negligible in our case.
Measurements of glyoxal (CHOCHO) were performed with the Light Emitting Diode Cavity Enhanced DOAS (LED-CE-DOAS). This instrument is a multispectral sensor 5
that selectively and simultaneously measures glyoxal, oxygen collision complexes (O2 -O2), methyl glyoxal (CH3COCHO), nitrogen dioxide (NO2) and other gases utilizing an Ocean Optics QE65000 spectrometer (Thalman and Volkamer, 2010; Coburn et al., 2014). The detection limit of this instrument during the CLOUD9 experiment was deter-mined to be 15–20 pptv at the native one minute measurement resolution employed for 10
this study. The instrument has been extensively compared to gravitational, UV-vis and IR absorption, phosphorescence and mass spectrometric measurement techniques for alpha-dicarbonyls and NO2(Thalman et al., 2015) and remote-sensing techniques (Volkamer et al., 2015).
2.4 Seed aerosol formation
15
Two kinds of seed aerosol were used in these experiments, pure H2SO4, and partially to fully neutralised ammonium sulphate aerosol. The pure H2SO4aerosol was formed in an external CCN generator, which comprised a temperature controlled stainless steel vessel holding a ceramic crucible filled with concentrated H2SO4. After heating the ves-sel to between 150 and 180◦C, depending on the desired characteristics of the aerosol 20
population, a flow of N2 was passed through the vessel, above the crucible to trans-port the hot H2SO4 vapour into the chamber. In addition, during CLOUD9, a humidi-fied flow of N2 was added to the aerosol injection line immediately downstream of the H2SO4 vessel, to create more reproducible size distributions. As the vapour cooled in the injection line, H2SO4droplets formed. The partially or fully neutralised aerosol was 25
ACPD
15, 33843–33896, 2015Aqueous phase sulphur dioxide
oxidation
C. R. Hoyle et al.
Title Page
Abstract Introduction
Conclusions References
Tables Figures
◭ ◮
◭ ◮
Back Close
Full Screen / Esc
Printer-friendly Version Interactive Discussion
Discussion
P
a
per
|
Discussion
P
a
per
|
Discussion
P
a
per
|
Discussion
P
a
per
|
distribution produced by this method was approximately 65–75 nm, with a full width at half maximum (FWHM) of approximately 50–70 nm.
2.5 Experimental procedure
A typical experiment began by pressurising the chamber to 220 hPa above ambient pressure, and injecting SO2 and O3 so as to reach the desired mixing ratios. Seed 5
particles were then added to the chamber, and observed for approximately 40 min to detect any growth under subsaturated conditions, before the pressure in the chamber was rapidly reduced to form the cloud. After a 15–30 min waiting time, during which the chamber temperature re-stabilised, the pressure was increased again, and fur-ther expansions were performed. This was repeated until the seed aerosol numbers 10
decreased below a few hundred per cubic centimetre. With initial particle number den-sities of approximately 6000–8000 cm−3, two to four cloud cycles could usually be per-formed. The properties of the aerosol, cloud droplets, and gas phase species were continually measured during all stages of the experiment.
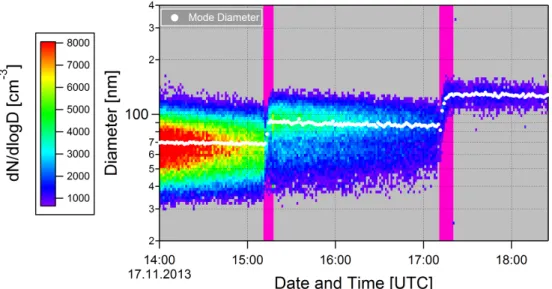
In order to better illustrate the experimental procedure, it is useful to examine some 15
basic measurements. The SMPS measurements of the aerosol size distribution dur-ing one experiment are shown in Fig. 4. At approximately 13:00 UTC, sulphuric acid aerosol was injected into the chamber (not shown). The conditions in the chamber were held constant for approximately two hours, during which time the number of aerosol particles reduced due to dilution. At approximately 15:10 UTC, the first expansion was 20
performed, and a cloud formed (marked in purple in the figure). The resulting aerosol growth can clearly be seen, both in the distribution, and from the mode diameter (line of white dots), which increases from 70 to 90 nm. The chamber was re-pressurised and a second expansion was performed shortly after 17:00 UTC, also resulting in substan-tial aerosol growth. No growth was observed during sub-saturated periods.
25
ACPD
15, 33843–33896, 2015Aqueous phase sulphur dioxide
oxidation
C. R. Hoyle et al.
Title Page
Abstract Introduction
Conclusions References
Tables Figures
◭ ◮
◭ ◮
Back Close
Full Screen / Esc
Printer-friendly Version Interactive Discussion
Discussion
P
a
per
|
Discussion
P
a
per
|
Discussion
P
a
per
|
Discussion
P
a
per
|
was performed with approximately 18–20 ppbv SO2and 120 ppbv O3. At approximately 600 s the expansion begins, and the pressure dropped, leading to an adiabatic cool-ing. The vertical line denotes where the SIMONE first detected the presence of water droplets, indicating that the dew point was approximately 1 K below the chamber tem-perature before the expansion started. During this expansion, the temtem-perature reached 5
approximately 1.5 K below the dew point, and the liquid water content of the air (LWC) reached a total of 0.7 g m−3. In panel d, it can be seen that the total aerosol number concentration (the integral of the total SMPS size distribution) decreased due to the approximately 20 % pressure reduction during the expansion, and due to the sedimen-tation and deposition of cloud droplets containing aerosol. However, before and after 10
the expansion, the measured values remained relatively stable, with a slight decrease due to dilution. In the bottom panel of Fig. 5 the diameter of the 25th and 75th percentile of the particles, as well as the median diameter are plotted as a function of time. The growth in the dry aerosol diameter resulting from aqueous phase chemistry during the cloud is clearly visible. The aerosol growth occurred rapidly as the LWC increases, with 15
growth ending soon after the LWC reached its peak.
3 Model description
A microphysical and chemical box model was constructed to simulate the experiments in the CLOUD chamber. The model was initialised approximately 10 min before each expansion with the dry aerosol size distribution measured by the SMPS attached to 20
the total sampling line. The aerosol sizes measured by the SMPS were not adjusted to account for any remaining water present at the measurement RH (approximately 3 % during CLOUD8 and approximately 20 % during CLOUD9). This will lead to a slight overestimate of the non-water volume of aerosol during CLOUD9, however this effect is similar to the magnitude of the measurement uncertainty of the SMPS instruments 25
ACPD
15, 33843–33896, 2015Aqueous phase sulphur dioxide
oxidation
C. R. Hoyle et al.
Title Page
Abstract Introduction
Conclusions References
Tables Figures
◭ ◮
◭ ◮
Back Close
Full Screen / Esc
Printer-friendly Version Interactive Discussion
Discussion
P
a
per
|
Discussion
P
a
per
|
Discussion
P
a
per
|
Discussion
P
a
per
|
the model was integrated along a time series of data measured during the chamber experiments. Temperature and pressure, as well as the mixing ratios of SO2 and O3 were input at 1 s resolution, and while the actual resolution of the aerosol NH+4 frac-tion derived from the AMS data was approximately 10 s, this was also interpolated to a 1 s resolution for model input. The water vapour mixing ratio for each experiment 5
was set at the beginning of the simulation (calculated from the dew point temperature, as described in Sect. 2.3), and the sum of the gas and liquid phase water was held constant. The gas phase ammonia mixing ratio was determined for the starting time of the simulation and held constant throughout. As the gas phase ammonia mixing ratio was below the detection limit of the PTR-TOF-MS, this mixing ratio was determined 10
using the Extended Aerosol Inorganic Model (E-AIM) (Clegg et al., 1998; Wexler and Clegg, 2002), by summing the total amount of sulphate and ammonium present in the aerosol population, and calculating the corresponding equilibrium gas phase ammonia mixing ratio under the RH and temperature conditions of the chamber. The validity and limitations of this approach will be discussed further in Sect. 4.2.
15
3.1 Aerosol water content and droplet growth
At sub-saturated conditions, the RH in the chamber during the simulated time periods was typically above 90 %. At RH below 93 %, the hydrated aerosol was assumed to be in equilibrium with the gas phase, and the water activity was calculated, at the maximum model time step of 1 s, using E-AIM. This calculation took into account the 20
amount of SO24−and NH+4 in the aerosol, as well as the temperature, while the pressure was held constant at 1 atm.
Once the RH reached or exceeded 93 %, a full kinetic calculation of the water up-take into the aerosol or droplets was performed. The Kelvin effect was accounted for in both the equilibrium and the kinetic calculations. At RH≥93 %, the equilibrium vapour
25
ACPD
15, 33843–33896, 2015Aqueous phase sulphur dioxide
oxidation
C. R. Hoyle et al.
Title Page
Abstract Introduction
Conclusions References
Tables Figures
◭ ◮
◭ ◮
Back Close
Full Screen / Esc
Printer-friendly Version Interactive Discussion
Discussion
P
a
per
|
Discussion
P
a
per
|
Discussion
P
a
per
|
Discussion
P
a
per
|
was created using E-AIM, and provides the equilibrium vapour pressure as a func-tion of temperature, NH+4: SO24− ratio and H2O : SO24− ratio. The lookup table covers the range of H2O : SO24− ratios from 12 to pure water, temperature from 250 to 300 K and NH+4: SO24− ratio from 0 to 2. The vapour pressure determined from the lookup table was then adjusted to account for the Kelvin effect. The equilibrium vapour pres-5
sure over very dilute NH+4/SO24−/H2O solution droplets (assumed to be pure water) was calculated using the approach of Lowe and Ficke (1974), who parameterised the equation of Goffand Gratch (1946).
The physics of water uptake by aerosol and cloud droplets is well discussed in stan-dard atmospheric physics textbooks, however, as this is the first time the model is 10
described, we believe it beneficial to provide as detailed a description as possible. When a droplet is large compared to the mean free path of water in air (continuum regime), the total flux of water to a droplet, and thus the uptake (in moles per second), is given by:
Jc=
4πRpDg(pH2O−pvap)×10−4
RT , (1)
15
where Rp is the droplet radius in cm, Dg the diffusivity of water in air (in cm2s−1),
pH2Othe partial pressure of water vapour (in hPa),Pvapthe vapour pressure of water at
the droplet surface (in hPa, calculated from the product of the equilibrium vapour pres-sure of water at a given temperature (Lowe and Ficke, 1974) and the activity of water in the droplet),Ris the gas constant (8.314 J mol−1K−1), andT is the temperature (K). 20
Dgis calculated as
Dg=0.211×1013.0
P 273.15T 1.94
ACPD
15, 33843–33896, 2015Aqueous phase sulphur dioxide
oxidation
C. R. Hoyle et al.
Title Page
Abstract Introduction
Conclusions References
Tables Figures
◭ ◮
◭ ◮
Back Close
Full Screen / Esc
Printer-friendly Version Interactive Discussion
Discussion
P
a
per
|
Discussion
P
a
per
|
Discussion
P
a
per
|
Discussion
P
a
per
|
whereP is the pressure in hPa. On the other hand, small particles find themselves in the kinetic regime, with the flux described by:
Jk=
πRp2να(pH2O−pvap)×10−4
RT , (3)
whereα is the mass accommodation coefficient for water (assumed to be 1.0). The mean speed of the water molecules (in cm s−1) is given by:
5
ν=
8
×10−7RT
πMH2O 12
, (4)
whereMH2O is the molar mass of water (in g mol−1).
The transition from the kinetic to continuum regime is accounted for in the model by the flux matching approach of Fuchs and Sutugin (1971):
J Jc =
1+Kn
1+1.71Kn+1.33Kn2,
Kn= λ
Rp, λ=
3Dg
ν , (5)
10
whereKnis the Knudsen number (dimensionless) andλis the mean free path (cm). The Kelvin effect is accounted for by multiplyingpvapby a correction factor,C:
C=exp 2MH2Oσ
1×10⁷RT ρRp, (6)
whereσ is the surface tension andρis the density of the H2O/H2SO4solution at the temperature of interest.
15
ACPD
15, 33843–33896, 2015Aqueous phase sulphur dioxide
oxidation
C. R. Hoyle et al.
Title Page
Abstract Introduction
Conclusions References
Tables Figures
◭ ◮
◭ ◮
Back Close
Full Screen / Esc
Printer-friendly Version Interactive Discussion
Discussion
P
a
per
|
Discussion
P
a
per
|
Discussion
P
a
per
|
Discussion
P
a
per
|
The aerosol and the water droplets were assumed to be in thermal equilibrium with the gas phase at all times. The aerosol concentration varies linearly with the pressure in the chamber, with concentrations decreasing by around 20 % during an expansion due only to the pressure change. During some expansions, particularly when the number of seed aerosol was low, the observed change in particle number concentration was 5
larger than the modelled change, indicating that processes other than the pressure change influenced the particle loss. Corrections for both these effects are applied in the analysis.
3.2 Chemistry
The partitioning of SO2and O3 to the cloud droplets, as well as the subsequent aque-10
ous phase chemistry was calculated on a time step 100 times smaller than that for the water partitioning. Performing the analysis described by Schwartz (1988) showed that, under the conditions of the experiments presented here (even at−10◦C), the
par-titioning of SO2to the cloud droplets can be represented with an effective Henry’s law approach, neglecting mass transport limitations. Thus the total amount of S(IV) in the 15
droplet is given by
[S(IV)]=
HSO−
3
+hSO2−
3 i
+[SO2·H2O] (7)
with
HSO−
3
=HSO2K1pSO2
[H+] , (8)
h
SO2−
3 i
=HSO2K1K2pSO2
[H+]2 (9)
20
and
[SO2·H2O]=HSO
ACPD
15, 33843–33896, 2015Aqueous phase sulphur dioxide
oxidation
C. R. Hoyle et al.
Title Page
Abstract Introduction
Conclusions References
Tables Figures
◭ ◮
◭ ◮
Back Close
Full Screen / Esc
Printer-friendly Version Interactive Discussion
Discussion
P
a
per
|
Discussion
P
a
per
|
Discussion
P
a
per
|
Discussion
P
a
per
|
wherepSO2 is the gas phase partial pressure of SO2,K1 andK2 are equilibrium
con-stants (Table 1), andHSO2 is the Henry’s law coefficient for the dissolution of SO2 in water (Table 2). H2SO4completely dissociates to HSO−4 and H+. The equilibrium con-stants given in Table 1 are taken from Seinfeld and Pandis (2006), who, in turn, reported the values recommended by Smith and Martell (1976), based on an evaluation of ex-5
perimental studies conducted between 1910 and 1974. The heat of dissolution forHSO2
is based on measurements between 25 and 50◦
C.
The pseudo first order rate coefficient for the aqueous phase oxidation of S(IV) by O3is
kS(IV)=(k0×[SO2·H2O])+ k1×HSO− 3
+k2× h
SO2−
3 i
, (11)
10
withk0,k1andk2given in Table 3. Ozone, on the other hand, is subject to mass trans-port limitations under the experimental conditions described here, therefore, similarly to Caffrey et al. (2001), we follow the approach of Schwartz (1988), with the change in aqueous phase O3concentration being given by
dCaq
dt = kmt RTpO3−
kmt
HO3RTCaq−QRp, (12)
15
with
kmt=
" Rp2RT
3Dg +
Rp(2πMO3RT)(1/2) 3α
#−1
, (13)
Q=3
cothq
q −
1
q2
, (14)
and
q=Rp s
kS(IV)
Daq . (15)
ACPD
15, 33843–33896, 2015Aqueous phase sulphur dioxide
oxidation
C. R. Hoyle et al.
Title Page
Abstract Introduction
Conclusions References
Tables Figures
◭ ◮
◭ ◮
Back Close
Full Screen / Esc
Printer-friendly Version Interactive Discussion
Discussion
P
a
per
|
Discussion
P
a
per
|
Discussion
P
a
per
|
Discussion
P
a
per
|
Here,pO3 is the partial pressure of O3,HO3 is the Henry’s law coefficient for O3,
mea-sured by Kosak-Channing and Helz (1983) at temperatures between 5 and 30◦C (Ta-ble 2) andCaq is the aqueous phase concentration at the surface of the droplet. The coefficientkmtaccounts for the gas and interfacial mass transport limitations.Rpis the radius of the droplet or aerosol particle,MO3 is the molar mass of O3andαis the mass
5
accommodation coefficient (4.0×10⁻², Müller and Heal, 2002). In Eq. 12, Q, given
by Eq. (14), is a correction factor to account for the lower aqueous phase concentra-tions of O3caused by diffusion limited transport within the droplet.Daq is the aqueous
phase diffusion coefficient of O3, taken as a generally representative value of 1×10⁻⁵
(Schwartz, 1988), and assumed to be temperature independent.Dg is the gas phase 10
diffusion coefficient of O3, where the typical value of 0.1 cm2s−1, for a temperature of 298 K, given by Schwartz (1986) is used as a starting point, and scaled for a particular temperature and pressure as follows. According to Poling et al. (2001), the value of the gas phase diffusion coefficient of a gas A in a second gas B can be calculated as:
DAB= 0.00266 T
3/2
PbarMAB1/2σAB2 ΩD
, (16)
15
wherePbaris the pressure in bar,σAB2 is a characteristic length in Å, andΩDis a dimen-sionless diffusion collision integral. Knowing the value ofDgat a particular temperature and pressure (298 K, 1 bar) permits the calculation of a constant to represent all terms in Eq. (16), exceptT andPbar, enabling scaling to other temperatures and pressures:
Dg(Tf,Pf)=1.94×10 −05T
3/2
f Pf
, (17)
20
WhereTf andPf are the temperature and pressure of interest.
ACPD
15, 33843–33896, 2015Aqueous phase sulphur dioxide
oxidation
C. R. Hoyle et al.
Title Page Abstract Introduction Conclusions References Tables Figures ◭ ◮ ◭ ◮ Back Close
Full Screen / Esc
Printer-friendly Version Interactive Discussion Discussion P a per | Discussion P a per | Discussion P a per | Discussion P a per |
aerosol from the input file were interpolated to the model time. The total NH4mass in each aerosol particle or droplet was calculated relative to the S(VI) mass, and the NH4 and S(VI) concentrations were calculated using the water volume calculated for a par-ticle or droplet in that size bin. Subsequently, the concentration of H+ in each droplet, and thus the concentration of the other ions was calculated by iteratively solving the 5
electroneutrality equation,
H+
+
NH+4
AMS+
NH+4 part= OH− + HSO− 3
+2hSO2−
3 i
+2hSO2−
4 i + HSO− 4 , (18) where
NH+4
AMS and
NH+4
part are the NH
+
4 determined from the AMS mass fraction
and from the partitioning of gas phase NH3 into the cloud droplet, respectively. The latter is given by:
10
NH+4
part=HNH3×pNH3×KNH3×
H+
/KH2O, (19)
withpNH3 being the gas phase partial pressure of NH3, and the remaining constants defined in Tables 1 and 2.
In Eq. 18,
HSO−3
is given by Eq. (8),hSO23−iby Eq. (9),hSO24−iby
h
SO2−
4 i
=K3[S(VI)] [H+]+K
3
(20) 15
and
HSO−4
by HSO− 4 = H+ [S(VI)]
[H+]+K
3
. (21)
Once the concentrations of the ions are known, the production of S(VI) is calculated from
∆S(VI)=QkS(IV)[O3]aqdt. (22)
ACPD
15, 33843–33896, 2015Aqueous phase sulphur dioxide
oxidation
C. R. Hoyle et al.
Title Page
Abstract Introduction
Conclusions References
Tables Figures
◭ ◮
◭ ◮
Back Close
Full Screen / Esc
Printer-friendly Version Interactive Discussion
Discussion
P
a
per
|
Discussion
P
a
per
|
Discussion
P
a
per
|
Discussion
P
a
per
|
The new aqueous phase O3 concentration is calculated using a backward Eulerian approach to solve Eq. (12), so that a relatively long time step can be used without large fluctuations in [O3]aq which could lead to values that are negative, or exceed the maximum concentration determined by Henry’s law.
4 Results
5
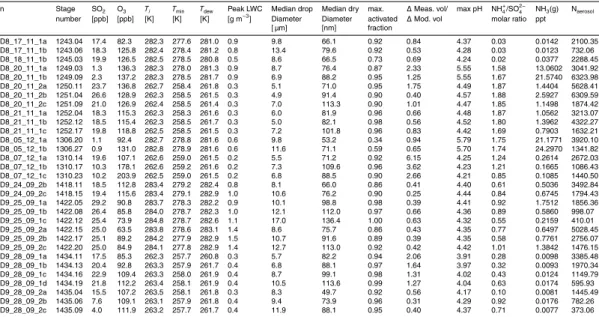
Data from a total of 31 expansions were analysed, 15 at 10◦C, and 16 at −10◦C. Table 4 lists the most important data describing the different experiments and model runs. SO2mixing ratios ranged from 0.9 to 26.4 ppbv, and O3from 63.5 to 137.2 ppbv.
4.1 Aerosol activation and cloud droplets
Peak LWCs of up to 1.5 g m−3were seen during the 10◦C experiments, and the largest 10
size reached by the median droplets in the modelled size distribution was 17 µm, with the smallest being 4.9 µm. Most of the aerosol were activated during the expansions, with modelled activated fractions generally being around 0.9. In one case, however, only 34 % of the aerosol were activated.
The number of modelled cloud droplets (defined as the number of droplets larger 15
than 1 µm in diameter; orange symbols) is compared with the number measured by the WELAS, in Fig. 6, for several of the CLOUD9 experiments. WELAS data from two of the CLOUD9 experiments, and from the CLOUD8 experiments were not available. At aerosol numbers below 1000 cm−3, all aerosol are activated, and the modelled number of droplets matches the number of droplets detected by the WELAS. At higher aerosol 20
ACPD
15, 33843–33896, 2015Aqueous phase sulphur dioxide
oxidation
C. R. Hoyle et al.
Title Page
Abstract Introduction
Conclusions References
Tables Figures
◭ ◮
◭ ◮
Back Close
Full Screen / Esc
Printer-friendly Version Interactive Discussion
Discussion
P
a
per
|
Discussion
P
a
per
|
Discussion
P
a
per
|
Discussion
P
a
per
|
to be totally homogeneous, possibly resulting in slightly differing activated fractions of aerosol in different regions of the chamber in the initial stages of the expansion. Much of the clear relationship between the modelled droplet number and that measured by the WELAS can likely be explained by the fact that both depend strongly on the num-ber of aerosol in the chamnum-ber (black diamonds in Fig. 6), nevertheless it is encouraging 5
that the modelled and measured droplet numbers are well correlated.
4.2 Ammonia in the CLOUD chamber
At this point, it is useful to examine the assumptions made with regard to the gas phase ammonia, and the amount of ammonium in the aerosol and the cloud droplets in greater detail. In Sect. 3, it was stated that the ASR of the aerosol were measured 10
using an AMS, that these ratios were then used to determine the gas phase ammonia in the chamber, using E-AIM, and that the uptake of this ammonia to cloud droplets was calculated assuming that the droplets were in an effective Henry’s law equilibrium with a constant gas phase ammonia concentration. For this approach to be accurate, a number of conditions must be met, each of which are discussed in the subsections 15
below. We find that the pre-expansion determination of the gas phase ammonia mixing ratio is likely to be correct, as is the assumption that the ammonium concentration in the droplets is in equilibrium with the gas phase ammonia. However, the gas phase ammonia mixing ratio during the cloud periods cannot generally be assumed to be constant.
20
4.2.1 Accuracy of AMS measurement of ammonia in hydrated aerosol
Firstly, the ammonium to sulphate ratio in the particles must be accurately measured by the AMS. Some technical aspects of this measurement were already discussed in Sect. 2.3. The NH+4: SO24− ratio used to determine the gas phase ammonia mixing ratio was measured during the subsaturated period immediately preceeding each expan-25
ACPD
15, 33843–33896, 2015Aqueous phase sulphur dioxide
oxidation
C. R. Hoyle et al.
Title Page
Abstract Introduction
Conclusions References
Tables Figures
◭ ◮
◭ ◮
Back Close
Full Screen / Esc
Printer-friendly Version Interactive Discussion
Discussion
P
a
per
|
Discussion
P
a
per
|
Discussion
P
a
per
|
Discussion
P
a
per
|
phase ammonia was carried out with E-AIM, using the AMS determined NH+4: SO2−
4
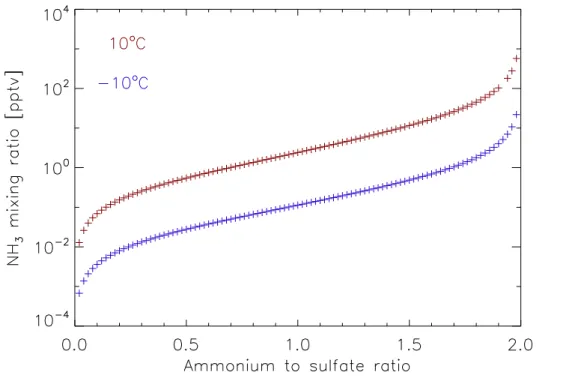
ratio, at a pressure of one atmosphere and the temperature and RH conditions mea-sured in the chamber. Any reduction in NH+4: SO24− ratio due to processes such as the drying of the air on the way to the AMS would lead to a lower calculated gas phase ammonia mixing ratio (Fig. 7). Calculations with E-AIM show that under the assumption 5
of a metastable aqueous phase, without the formation of solids, the NH+4: SO24− ratio can be reduced from 2, to 1.5 during a change in RH from 95 % to 35 %. If solid phases are allowed to form however, the NH+4: SO24− ratio is much less sensitive to changes in RH. It has been observed that ammonium sulphate particles bounce from the AMS vapouriser, therefore we expect that ammonium sulphate is in a solid state and that 10
there are minimal ammonium losses during the drying process.
In a recent study, nebulised mixtures of ammonium sulphate and ammonium nitrate were measured with an AMS (nitrate activity coefficients of 0, 0.3, 0.5, 0.7 and 1). It was found that the AMS reliably measures the predicted ammonium content of the mixtures of these internally mixed ammonium nitrate and ammonium sulphate particles 15
(Xu et al., manuscript in preperation). We are not aware of any analogous study for aerosol containing only varying ratios of ammonium and sulphate, however if ammonia is not lost from the mixtures described above during the measurement process, we do not expect that it will be lost from aerosol formed from pure ammonium and sulphate solution. Therefore it is likely that the AMS determined ammonium to sulphate ratios 20
are correct.
4.2.2 Uptake of ammonia by a droplet
Since it is possible to estimate the gas phase ammonia before the expansion and cloud formation from the AMS measurements with a reasonable degree of accuracy, the next question is whether or not our assumption of an effective Henry’s law equilib-25
ACPD
15, 33843–33896, 2015Aqueous phase sulphur dioxide
oxidation
C. R. Hoyle et al.
Title Page
Abstract Introduction
Conclusions References
Tables Figures
◭ ◮
◭ ◮
Back Close
Full Screen / Esc
Printer-friendly Version Interactive Discussion
Discussion
P
a
per
|
Discussion
P
a
per
|
Discussion
P
a
per
|
Discussion
P
a
per
|
the uptake of ammonia by a 7 µm diameter water droplet was calculated, under the assumption that the droplet initially contained no ammonium, and was exposed to a 22 pptv ammonia gas phase. The development of the droplet ammonium concentra-tion with time is plotted in Fig. 8, for three different solution pH. At the lowest, pH=4, equilibrium is reached after approximately 600 s, which is comparable with the time 5
scale of the clouds formed in the chamber (400–600 s). At higher pH, the timescale becomes shorter very rapidly. As shown in Table 4, for most of the experiments, the pH lay between 4 and 5. We therefore expect that the ammonium concentration in the droplets will be essentially equal to the values predicted by assuming an effective Henry’s law equilibrium with the gas phase.
10
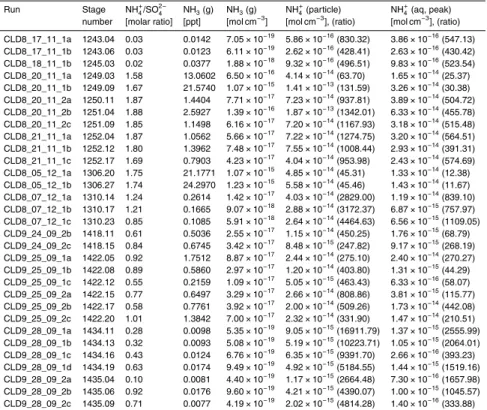
4.2.3 Assumption of constant gas phase ammonia
The assumption that the gas phase ammonia is constant during the cloud formation is more difficult to constrain. As shown in Table 5, under the assumption of a constant gas phase, and droplet equilibrium with the gas phase, the amount of ammonia that was taken up into the cloud droplets suspended in a cubic centimeter of air was between 15
approximately 12 and 2500 times the gas phase amount in that same air volume. The experiments with the highest values of this ratio were the ones performed under es-sentially acidic conditions, such that ammonia was almost absent from the gas phase. The results of these experiments are therefore not sensitive to uncertainties in the gas phase ammonia concentration.
20
For the experiments with near neutral seed aerosol (for example CLD8_20_11_2a), the droplets would have needed to take up around 500 times the gas phase ammonia in order for our assumption of droplet equilibrium with a constant gas phase to hold. The only possible sources of ammonia in the chamber during the cloud formation were the chamber walls, any water in the bottom of the chamber or the particles themselves. The 25
ACPD
15, 33843–33896, 2015Aqueous phase sulphur dioxide
oxidation
C. R. Hoyle et al.
Title Page
Abstract Introduction
Conclusions References
Tables Figures
◭ ◮
◭ ◮
Back Close
Full Screen / Esc
Printer-friendly Version Interactive Discussion
Discussion
P
a
per
|
Discussion
P
a
per
|
Discussion
P
a
per
|
Discussion
P
a
per
|
the expansion, the walls were in equilibrium with the gas phase and the particles (no changes in the NH+4: SO24− ratio of the particles were observed before the expansion, unless further ammonia was injected into the chamber), being coated in a mixture of ammonium, sulphuric acid and water. During the expansion, the walls maintained a constant temperature, while the temperature of the gas in the chamber decreased. 5
If one were to assume an exchange of ammonia molecules between the wall and the gas phase occuring at the kinetic limit, the mass flux from the walls would be large enough to maintain a constant gas phase mixing ratio. Assuming a 22 pptv ammonia gas phase mixing ratio, a temperature of 276 K, a pressure of 1000 hPa and allowing for a 10 % depletion of the gas phase, the flux would be approximately 0.4 µg m−3s−1, 10
where the units of volume refer to one cubic meter of air in the chamber. The required flux, for CLD8_20_11_1b would be 1.4×10⁻³µg m−3s−1, if the aqueous phase ammo-nia amount shown in Table 5 were to be taken up during a 400 s long cloud period.
However, the uptake of gases on chamber walls was investigated by McMurry and Grosjean (1985), who pointed out that when the accomodation coefficient of the gas on 15
the chamber walls is high, transport is rather diffusion-limited and that the kinetic cal-culation only holds for low accomodation coefficients. Indeed, for the CLOUD chamber, previous measurements have shown wall loss rates for sulphuric acid of 1.7×10⁻³s−1,
corresponding to a lifetime of approximately 10 min. Assuming ammonia to behave in a similar way to sulphuric acid, this suggests that the transport between the walls and 20
the gas phase is orders of magnitude too slow to maintain a constant gas phase am-monia mixing ratio during the cloud formation.
A further possible source of ammonia is the un-activated particles. Once the cloud forms, the ammonia vapour pressure over these deliquesced aerosol will be higher than over the droplets, and ammonia may be transfered via the gas phase from the aerosol 25
cal-ACPD
15, 33843–33896, 2015Aqueous phase sulphur dioxide
oxidation
C. R. Hoyle et al.
Title Page
Abstract Introduction
Conclusions References
Tables Figures
◭ ◮
◭ ◮
Back Close
Full Screen / Esc
Printer-friendly Version Interactive Discussion
Discussion
P
a
per
|
Discussion
P
a
per
|
Discussion
P
a
per
|
Discussion
P
a
per
|
culated, such that the ammonia vapour pressure over that aerosol reaches the vapour pressure over a droplet. In this case, only approximately 16 % of the ammonia can be removed from a non-activated aerosol, making it necessary that as little as 30 % of the aerosol activate if the remaining aerosol were to supply the missing ammonia to the droplets. The aerosol in CLD8_20_11_1b had an NH+4: SO24− ratio of 1.67. As shown 5
in Fig. 7, the vapour pressure over the aerosol is highly sensitive to the NH+4: SO24− ratio, particularly as this approaches 2. This means that in other experiments where the NH+4: SO24− ratio was higher, an even smaller fraction of the ammonia in the unac-tivated aerosol can be given up. As shown in Fig. 6, the model likely overestimates the activation, particularly at larger aerosol numbers, however in order to provide enough 10
ammonia, only a minority of the aerosol could have been activated. A visual inspection of the aerosol diameters measured with the SMPS showed that in all experiments, the majority of the aerosol grew during the cloud periods, and must therfore have activated to form cloud droplets. To summarise, the unactivated aerosol likely released some am-monia during the cloud periods, however this would not have been sufficient to supply 15
the missing ammonia to the cloud droplets.
During the analysis of other experiments being carried out in the CLOUD chamber (ozone initiated oxidation of isoprene), high precision measurements of gas phase gy-oxal were performed. During these measurements, it was found that as soon as the pressure decrease associated with an expansion began, the gas phase glyoxal in-20
creased rapidly from around 50 pptv to almost 500 pptv (Fig. 9). Glyoxal is relatively soluble, and this gas phase increase is in spite of the simultaneous uptake by the droplets. It is possible that the pressure change and increased turbulence during the decompression of the chamber lead to a change in the molecular exchange with the walls such that the process is less diffusive and more towards the kinetic limit.
25
ACPD
15, 33843–33896, 2015Aqueous phase sulphur dioxide
oxidation
C. R. Hoyle et al.
Title Page
Abstract Introduction
Conclusions References
Tables Figures
◭ ◮
◭ ◮
Back Close
Full Screen / Esc
Printer-friendly Version Interactive Discussion
Discussion
P
a
per
|
Discussion
P
a
per
|
Discussion
P
a
per
|
Discussion
P
a
per
|
of ammonia was injected into the chamber, which was partly taken up by the initially acidic seed, and partly deposited on the chamber walls. A re-mobilisation of ammonia from the chamber walls similar to that observed for glyoxal would lead to a large amount of ammonia in the gas phase, which could be taken up by the droplets.
In summary, it is not possible to support the assumption of a constant gas phase am-5
monia mixing ratio. It is likely that the droplets take up a large amount of ammonia from the gas phase, due to a rapid mobilisation of ammonia that was previously deposited on the chamber walls. However, it is not possible to quantify the size of this source. It is also likely that a certain amount of ammonia is transfered from the unactivated aerosol to the cloud droplets during the cloud formation.
10
As mentioned above, the gas phase ammonia is very small when the NH+4: SO24− ratio is low (below approximately 1.0). Below, we show that the more acidic experiments are uninfluenced by the uncertainty in gas phase ammonia, as for these experiments it was only present at trace levels. We believe it is still interesting to include the more neutralised experiments in the analysis to investigate the sensitivity of the results to 15
ammonium in the droplets and aerosol. In order to perform the model simulations, we maintain the assumption of a constant gas phase, as a base case, and discuss the implications further below.
4.3 Aerosol growth and the effect of ammonia
In this section, the modelled and measured growth of the dry aerosol volume before 20
and after the expansion is discussed.
The pH of droplets formed during the expansions was seldom above 5, due to the uptake of SO2 and rapid production of SO24− at higher pH, and the resulting re-duction in pH. The only exceptions were experiments such as CLD8_05_12_1a and CLD8_05_12_1b where there were comparatively high gas phase NH3 mixing ratios 25