ACPD
15, 10677–10708, 2015Particulate organic nitrates observed in an oil and natural gas
production region
L. Lee et al.
Title Page
Abstract Introduction
Conclusions References
Tables Figures
◭ ◮
◭ ◮
Back Close
Full Screen / Esc
Printer-friendly Version
Interactive Discussion
Discussion
P
a
per
|
Discussion
P
a
per
|
Discussion
P
a
per
|
Discussion
P
a
per
|
Atmos. Chem. Phys. Discuss., 15, 10677–10708, 2015 www.atmos-chem-phys-discuss.net/15/10677/2015/ doi:10.5194/acpd-15-10677-2015
© Author(s) 2015. CC Attribution 3.0 License.
This discussion paper is/has been under review for the journal Atmospheric Chemistry and Physics (ACP). Please refer to the corresponding final paper in ACP if available.
Particulate organic nitrates observed in
an oil and natural gas production region
during wintertime
L. Lee1, P. J. Wooldridge1, J. deGouw2, S. S. Brown2, T. S. Bates3, P. K. Quinn4,
and R. C. Cohen1,5
1
Department of Chemistry, University of California, Berkeley, CA, USA 2
Chemical Science Division, Earth System Research Laboratory, National Oceanic & Atmospheric Administration, Boulder, CO, USA
3
Joint Institute for the Study of the Atmosphere and Ocean, University of Washington, Seattle, WA, USA
4
Pacific Marine Environment Laboratory, National Oceanic & Atmospheric Administration, Seattle, WA, USA
5
Department of Earth and Planetary Sciences, University of California, Berkeley, CA, USA
Received: 24 February 2015 – Accepted: 10 March 2015 – Published: 13 April 2015
Correspondence to: R. C. Cohen ([email protected])
Published by Copernicus Publications on behalf of the European Geosciences Union.
ACPD
15, 10677–10708, 2015Particulate organic nitrates observed in an oil and natural gas
production region
L. Lee et al.
Title Page
Abstract Introduction
Conclusions References
Tables Figures
◭ ◮
◭ ◮
Back Close
Full Screen / Esc
Printer-friendly Version
Interactive Discussion
Discussion
P
a
per
|
Discussion
P
a
per
|
Discussion
P
a
per
|
Discussion
P
a
per
|
Abstract
Organic nitrates in both gas and condensed (aerosol) phases were measured during the Uintah Basin Winter Ozone Study from January to February in 2012. A high degree of correlation between total aerosol volume at diameters less than 500 nm and the par-ticulate organic nitrate concentration indicates that organic nitrates are a consistent, if
5
not dominant, fraction of fine aerosol mass. In contrast, a similar correlation with sub 2.5 µm aerosol volume is weaker. The C : N atomic ratio inferred from field measure-ments of PM2.5and particulate organic nitrate is 34 : 1. Calculations constrained by the
observations indicate that both condensation of gas phase nitrates and heterogeneous reactions of NO3/N2O5 are responsible for introducing organic nitrate functionality
10
into the aerosol and that the source molecules are alkanes. Extrapolating the results to urban aerosol suggests organic nitrate production from alkanes may be a major secondary organic aerosol source.
1 Introduction
Sub-micron sized aerosol affect the global radiative balance directly as a result of
vari-15
ation in their optical properties and indirectly via their effect on clouds. They modulate atmospheric composition by scavenging gas phase material, including oxidants. The aerosol impact visibility and public health (Hallquist et al., 2009; Went, 1960; Klein-man et al., 1995). Observations have shown that micron sized aerosol typically contain
∼50 % organic material by mass (Zhang et al., 2007), and the sources of these organic
20
aerosol have been the subject of considerable debate (Bahreini et al., 2012; Gentner et al., 2012; Shilling et al., 2013; Worton et al., 2013). Field observations have found organic aerosol in urban areas to correlate with anthropogenic emissions, and that they are formed in the atmosphere through chemical reactions of gaseous precursors (Hallquist et al., 2009). However, It has also been shown that urban organic aerosol
25
ACPD
15, 10677–10708, 2015Particulate organic nitrates observed in an oil and natural gas
production region
L. Lee et al.
Title Page
Abstract Introduction
Conclusions References
Tables Figures
◭ ◮
◭ ◮
Back Close
Full Screen / Esc
Printer-friendly Version
Interactive Discussion
Discussion
P
a
per
|
Discussion
P
a
per
|
Discussion
P
a
per
|
Discussion
P
a
per
|
2004; Zhang et al., 2013), i.e., from a biological source, such as biogenic emissions or biomass burning. It remains challenging to explain secondary organic aerosol (SOA) produced from modern carbon but controlled by anthropogenic emissions (Weber et al., 2007). Nitrogen oxides (NOx) are possible candidates for modulating aerosol formation as they are primarily anthropogenic so that an aerosol formation pathway mediated by
5
NOxmay explain this seemingly counter intuitive phenomenon in terms of radiocarbon
age. One potential tracer for this process is organic nitrates in aerosol.
Recently, methods to identify organic nitrate in ambient aerosol have become avail-able. Observations in chamber studies of the NO+/NO+2 peaks in aerosol mass spec-trometer measurements (Rollins et al., 2009, 2010a; Farmer et al., 2010), by Fourier
10
Transform Infrared Spectroscopy (FTIR) of ambient aerosol (Day et al., 2010; Mylonas et al., 1991; Garnes and Allen, 2002) and by Thermal Dissociation-Laser Induced Flu-orescence (TD-LIF) of ambient aerosol (Rollins et al., 2010b, 2012, 2013) indicate that organic nitrates in ambient aerosol are observable, and that there are mechanisms to produce them in significant yields from common organic precursors. For example, in
15
Bakersfield, California during summer, Rollins et al. (2012) found that aerosol-bound organic nitrate production contributed to as much as 30 % of the aerosol growth rate at night with nitrooxy group representing 8.4 % of the growth mass.
Recent studies of organic matter in ambient aerosol have focused on anthropogenic emissions of gasoline, diesel (Gordon et al., 2013; Jathar et al., 2013; Gentner et al.,
20
2012; Bahreini et al., 2012), motor oil (Worton et al., 2014) and biogenic VOCs (Brown et al., 2009; Paulot et al., 2009; Froyd et al., 2010) as precursors. For long chain aliphat-ics, laboratory experiments and simulations have demonstrated substantial contribution of organic nitrates in the resulting particulate matter (Jordan et al., 2008; Lim and Zie-mann, 2009; Matsunaga and ZieZie-mann, 2010), but there exist few field observations
25
capable of assessing whether these mechanisms are representative of the ambient processes. Here we describe observations of organic nitrate aerosol observed in the Uintah Basin, Utah during winter 2012. The measurement site is heavily influenced by oil and gas drilling operations and has negligible input of biogenic emissions, providing
ACPD
15, 10677–10708, 2015Particulate organic nitrates observed in an oil and natural gas
production region
L. Lee et al.
Title Page
Abstract Introduction
Conclusions References
Tables Figures
◭ ◮
◭ ◮
Back Close
Full Screen / Esc
Printer-friendly Version
Interactive Discussion
Discussion
P
a
per
|
Discussion
P
a
per
|
Discussion
P
a
per
|
Discussion
P
a
per
|
an excellent opportunity to explore the role of organic nitrates formed from aliphatic compounds in the production of ambient aerosol.
2 Methods
Observations of NO2, total organic nitrates and particulate organic nitrates (pΣAN) were made as part of the Uintah Basin Winter Ozone Study (UBWOS) in January and
5
February of 2012. The instruments were installed on a 19 m tower located on an op-erational oil and gas well pad containing a wellhead for water injection with a nearby unpaved access road. The measurement site (40.14370◦N, 109.46718◦W) is approxi-mately 30 miles south of Vernal, the nearest town in Utah. The aerosol measurements that are the focus of this manuscript were made from inlets 9 m above the ground.
10
NO2, total organic nitrates and pΣAN were measured by TD-LIF with coupling to an
inlet denuder as described in Rollins et al. (2010). TD-LIF is described in detail else-where (Day et al., 2002; Thornton et al., 2000). Briefly, in these experiments a CW 408 nm solid state diode laser (Power Technology Inc., LDCU12/7639) was used to ex-cite NO2molecule. The laser light was directed sequentially into 3 multi-pass white cells
15
and total fluorescence due to NO2at wavelengths longer than 700 nm was detected us-ing a red-sensitive photomultiplier tube (Hamamatsu H7421-50) behind dielectric filters that set the transmission window. The cell pressure was maintained at 3 Torr.
Simultaneous detection of organic nitrate species was effected by quantitative con-version of alkyl nitrate (−ONO2) and peroxy nitrate (−OONO2) moiety to NO2molecule
20
through thermal decomposition at 17 ms residence time under 380◦C in a 0.25 inch OD quartz tube. The sampled air contained both gas phase and aerosol phase organic ni-trates which, upon passing through the thermal dissociation (TD) oven, were converted into an excess NO2 signal compared to the ambient NO2 concentration monitored
si-multaneously in an unheated channel. To distinguish the particulate phase
compo-25
ACPD
15, 10677–10708, 2015Particulate organic nitrates observed in an oil and natural gas
production region
L. Lee et al.
Title Page
Abstract Introduction
Conclusions References
Tables Figures
◭ ◮
◭ ◮
Back Close
Full Screen / Esc
Printer-friendly Version
Interactive Discussion
Discussion
P
a
per
|
Discussion
P
a
per
|
Discussion
P
a
per
|
Discussion
P
a
per
|
(Rollins et al., 2010b) as well as NO2so that only aerosol phase component remained. The particle transmission efficiency of the denuder was calculated to be 60 % for 20 nm diameter particles and over 90 % for particles larger than 70 nm diameter, ensuring de-tection of the vast majority of aerosol mass. To reduce intake of dust, a 2.5 µm cyclone was placed on the main inlet with a bypass pump maintaining the necessary total flow
5
rate of 5 L per minute. In addition to these TD-LIF measurements, N2O5(Wagner et al.,
2011), peroxy acetyl nitrate (PAN) (Williams et al., 2000) and ClNO2 (Roberts et al., 2009) were independently measured. Total alkyl nitrate (ΣAN) is defined as the mea-sured TD-LIF signal at 380◦C, corrected for ozone effects (Lee et al., 2014) and with NO2, N2O5, PAN and ClNO2subtracted. The particle organic nitrate observations
re-10
quire no correction as gas phase molecules are scrubbed by the denuder. We expect alkyl nitrates to be the dominant component of the particulate organic nitrate signal ob-served, because the peroxy nitrate concentration as well as the concentration of their precursors are much lower than the corresponding alkyl nitrates.
The TD-LIF instrument was calibrated hourly using locally generated zero air mixed
15
with an NO2standard to give 5 different concentration levels, spanning a range from 0
to 20 ppb. The instrument zero was monitored twice per hour. Concentration data were reported to the NOAA archive (http://esrl.noaa.gov/csd/groups/csd7/measurements/ 2012ubwos/) at a time resolution of 1 min, averaged from 1 Hz raw data. The detec-tion limit for the instrument at 1 min averaging time was 24 ppt for NO2and particulate
20
nitrate and 34 ppt for total organic nitrate, defined as the 1−σ value of the noise. The charcoal denuder was occasionally checked for saturation by introducing the calibration NO2gas mixture before, rather than after, the denuder section in a calibration routine, and no NO2break-through was observed.
Co-located aerosol instrumentations include measurements of the particle size
dis-25
tribution from 10 to 500 nm diameter range using a scanning mobility particle sizer (SMPS, TSI Inc.), from 0.7 to 10 µm diameter range using an aerodynamic parti-cle sizer (APS, TSI Inc.) and an aerosol mass spectrometer (AMS, Aerodyne Inc.). Sub 2.5 µm aerosol filter samples were collected twice daily, one covering daytime
ACPD
15, 10677–10708, 2015Particulate organic nitrates observed in an oil and natural gas
production region
L. Lee et al.
Title Page
Abstract Introduction
Conclusions References
Tables Figures
◭ ◮
◭ ◮
Back Close
Full Screen / Esc
Printer-friendly Version
Interactive Discussion
Discussion
P
a
per
|
Discussion
P
a
per
|
Discussion
P
a
per
|
Discussion
P
a
per
|
and one covering nighttime. Properties derived from these filter samples include total aerosol mass, total organic carbon (OC), total elemental carbon (EC) and cation con-centrations (ion chromatography). Particle-into-liquid sampler (PILS) was co-located with the filter sampler. Meteorological conditions were recorded at the top of the 19 m tower including wind direction, wind speed, temperature, pressure and relative
hu-5
midity. Gas phase measurements used in this analysis include gas chromatography with mass selective detector (GC-MS) and proton transfer mass spectrometry (PTR-MS) for VOC speciation, cavity ring-down spectroscopy (CRDS) for N2O5 and NO3,
chemical ionization mass spectrometry (CIMS) for ClNO2, and gas chromatography
with electron capture detection (GC-ECD) for PAN. (For a comprehensive list, see:
10
http://esrl.noaa.gov/csd/groups/csd7/measurements/2012ubwos/instruments.html.)
3 Observations
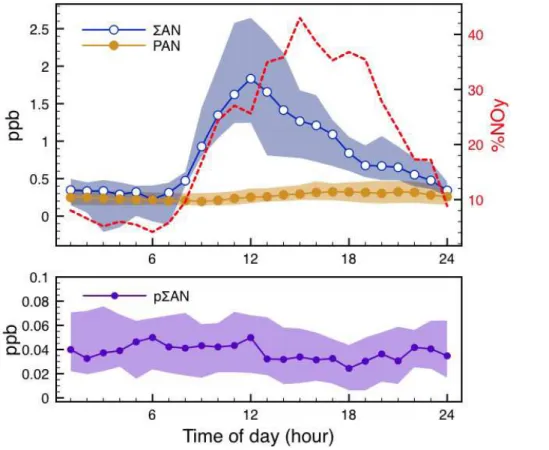
The concentration of total organic nitrates (including the contribution from ClNO2 and N2O5) and particulate nitrates (pΣANs) are shown in Fig. 1. After correcting for PAN,
ClNO2and N2O5,ΣANs account for an afternoon peak of 40 % NOyand exhibit a strong
15
diurnal pattern, reaching a median value of 2.2 ppb at local noon as shown in Fig. 2. At night high concentrations of N2O5and ClNO2(∼0.6 ppb combined) were present and
ΣANs decreased to approximately 300 ppt. PAN was about 250 ppt at night increas-ing to 400 ppt in the late afternoon. A median value of 45 ppt pΣANs was observed with peak value around 150 ppt (Fig. 1). The level of pΣAN varied more slowly than
20
ΣANs, except at times of pristine air intrusion during which its concentration decreased promptly. From a multi-day perspective, pΣANs were observed to accumulate during stagnant periods as did long-lived trace gases including VOCs, NO2andΣANs.
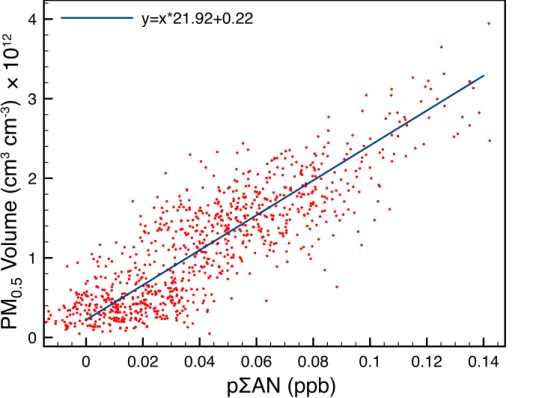
pΣAN was correlated with other aerosol measurements, the strongest of which (R2=
0.72) was with aerosol volume at diameters below 500 nm (Fig. 3). In contrast, the
25
correlation with total aerosol volume up to 2.5 µm particle diameter is weaker (R2=
ACPD
15, 10677–10708, 2015Particulate organic nitrates observed in an oil and natural gas
production region
L. Lee et al.
Title Page
Abstract Introduction
Conclusions References
Tables Figures
◭ ◮
◭ ◮
Back Close
Full Screen / Esc
Printer-friendly Version
Interactive Discussion
Discussion
P
a
per
|
Discussion
P
a
per
|
Discussion
P
a
per
|
Discussion
P
a
per
|
The source of this dust is likely exposed dry soil on the numerous unpaved roads in the surrounding area. Correlations between pΣAN and gas phase species such as propane (R2=0.15) and NO2(R
2
=0.1) are weak.
4 Discussion
4.1 Aerosol composition inferred from observations
5
The inorganic components observed in aerosol at UBWOS consist of mineral dust, salts and elemental carbon. Since pΣAN data represent condensed phase organic nitrooxy groups, the strong correlation of pΣANs concentration with PM0.5 volume is
suggestive of the existence of both a significant organic component and a persistent nitrooxy functionality in this size range. Complementary evidence for this observation is
10
obtained by correlating the concentration of aerosol Ca2+, typically found in minerals, with the total aerosol volume at diameters between 500 nm and 2.5 µm. The resulting high correlation (R2=0.78) is in contrast to the one obtained for Ca2+ with the PM0.5
volume (R2=0.03), again lending support to the assumption that the organic particles dominate the particle size range under 500 nm while inorganic components dominate
15
the size range from 500 nm to 2.5 µm.
To obtain a quantitative estimate of organic/inorganic mass in PM2.5, linear
decom-position of aerosol specific volume was used (Appendix A). The specific volume was calculated as the ratio of PM2.5 aerosol volume measured by SMPS and APS divided
by PM2.5 aerosol mass from impactor filter samples. The use of filter data limits the
20
number of independent estimations to 2 values daily, one during the day and one dur-ing the night. This method assumes that inorganic and organic components have dis-tinctive values in density, and they form external mixture in the aerosol phase. The resulting equation relating the observed PM2.5 specific volume (ev) to aerosol organic
ACPD
15, 10677–10708, 2015Particulate organic nitrates observed in an oil and natural gas
production region
L. Lee et al.
Title Page
Abstract Introduction
Conclusions References
Tables Figures
◭ ◮
◭ ◮
Back Close
Full Screen / Esc
Printer-friendly Version
Interactive Discussion
Discussion
P
a
per
|
Discussion
P
a
per
|
Discussion
P
a
per
|
Discussion
P
a
per
|
nitrate group mass fraction (fONO2) is shown in Eq. (1).
e
v=evdust+ evorg−vedust
×(1+γ)×fONO2 (1)
e
vorg and vedust represent the specific volume of aerosol organic and inorganic
compo-nents, respectively, whileγ is the mass ratio of the non-nitrate-containing organics to the organic nitrate group. Note here that the pΣAN measurement is insensitive to
in-5
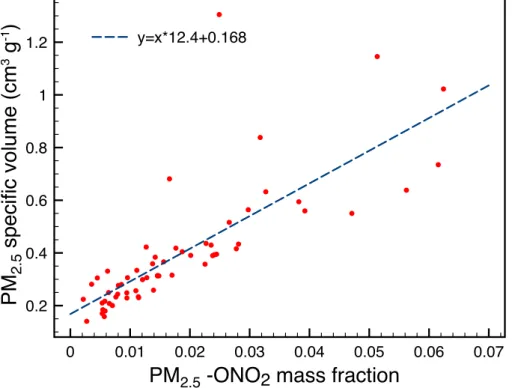
organic nitrate ions and allowed us to use it as an unambiguous tracer for organic components in the aerosol phase. Equation (1) predicts a linear relationship between the aerosol specific volume and organic nitrate mass fraction given that organic nitrates represent a constant fraction in the organic mass, a condition satisfied as demonstrated in Fig. 4.
10
They intercept of a plot of aerosol specific volume vs. organic nitrate mass fraction gives the specific volume of the inorganic component directly. We obtained a value of 0.168 cm3g−1 corresponding to a nominal density of the inorganic component of 5.95 g cm−3, a value similar to iron(III) oxide (d=5.24 g cm−3). Organic molecules with moderate oxygenation have a density (evorg−1) of approximately 0.85 g cm−
3
(for
exam-15
ple: 1-butyl nitrate (d=0.882), tert-butyl nitrate (d=0.867), nonanol (d=0.827) and butanol (d=0.81)). Using this estimate, we obtain a γ value of 11. This constrains the organic mass associated with organic nitrate group in aerosol to approximately 680 a.m.u. This associated mass estimated from the light component of the ambient aerosol typically accounts for 53 % of the observed aerosol volume and 14 % of the
20
aerosol mass.
It is possible to account for the contribution of soluble inorganic salts that are mea-sured by PILS by subtracting out an inorganic salt component defined by the sum of NH+4, NO−3 and SO24− groups and their average density of 1.76 g cm−3. The sum of PILS ions can at times account for up to 50 % of PM2.5 mass. The adjusted aerosol
25
ACPD
15, 10677–10708, 2015Particulate organic nitrates observed in an oil and natural gas
production region
L. Lee et al.
Title Page
Abstract Introduction
Conclusions References
Tables Figures
◭ ◮
◭ ◮
Back Close
Full Screen / Esc
Printer-friendly Version
Interactive Discussion
Discussion
P
a
per
|
Discussion
P
a
per
|
Discussion
P
a
per
|
Discussion
P
a
per
|
0.6 for the correlation of specific volume to organic nitrate mass fraction is identical to the correlation presented above. Aγ value of 9.6 is derived from this analysis.
We can now constrain the molecular formula of particulate organic components us-ing this corrected γ value derived above. Together with aerosol mass spectrometer observations during high aerosol loading periods of an O : C value of 0.2 (S.
Mur-5
phy, private communication, 2013) and a generic chemical formula containing carbon, oxygen, hydrogen and organic nitrate (−ONO2) of the form (CH2)nOm (HONO2) for a fully saturated molecule, we derive an elemental ratio of C : H : O : N=34 : 69 : 10 : 1. Note that any linear combination of organic molecule mixtures giving the same aver-age C : H : O : N ratio can satisfy this constraint, and may consist of both nitrates and
10
non-nitrates.
The range of C : H : O : N ratios consistent with the observations can be estimated from the confidence interval associated with the slope and intercept of the linear re-gression in Fig. 4. At 95 % confidence interval, we estimate the uncertainty of theγ
value to be±17 %, given an organic matter density of 0.85 g cm−3. We point out that the
15
large uncertainty in the y-intercept does not contribute significantly to the uncertainty of the result because the difference in specific volume is dominated by the organic component. Propagating this range gives C : H : O : N ratio between 28 : 57 : 9 : 1 and 40 : 81 : 11 : 1. Note that although the estimated carbon number appears to be high rel-ative to the implied carbon number for organic aerosol generated from the Deepwater
20
Horizon plume (de Gouw et al., 2011), our estimate is relative to the organic nitrate functional group in the aerosol phase. The implication is that not all organics responsi-ble for organic aerosol formation during UBWOS contained organic nitrate groups.
4.2 Daytime production
In the following section we attempt to close the daytime pΣAN budget using gas
25
phase oxidation of aliphatic molecules followed by partitioning of oxidation products into aerosol phase.
ACPD
15, 10677–10708, 2015Particulate organic nitrates observed in an oil and natural gas
production region
L. Lee et al.
Title Page
Abstract Introduction
Conclusions References
Tables Figures
◭ ◮
◭ ◮
Back Close
Full Screen / Esc
Printer-friendly Version
Interactive Discussion
Discussion
P
a
per
|
Discussion
P
a
per
|
Discussion
P
a
per
|
Discussion
P
a
per
|
pΣAN is thought to be exclusively secondary. Consider daytime processes in the alkane-rich environment observed during UBWOS: the oxidation of an organic molecule R starts with a reaction with OH radical. For a simplified schematic (Re-actions 1 and 2) of a single oxidation step in the presence of NO, two generic products are formed with relative yields governed by the organic nitrate yieldα.
5
α R+OH→R(ONO2) (R 1)
(1−α) R+OH→RO. (R 2)
The simple alkyl nitrate R(ONO2) and products formed from the subsequent reactions of alkoxy radical RO. are assumed to partition into the aerosol phase as a function of their respective vapor pressure. If the partitioning follows ideal solution behavior within
10
the existing aerosol organics, the fraction of the organic products expected to end up in the condensed phase is represented asKpin Eq. (2), whereP∗ represents the
sat-uration vapor pressure of the organic molecule,Norg the amount of organic molecules
in the condensed phase in mol m−3andkB as Boltzmann’s constant.
Kp=
1 1+N P∗
orgkBT
(2)
15
The largest alkane reported during UBWOS 2012 was undecane (C11H24). We
extrapo-late the OH reactivity of larger alkanes using a power law, by fitting a linear relationship (R2=0.99) to the observed C9∼C11alkane reactivity in the log space. This approxima-tion combines the decay in gas phase concentraapproxima-tion due to reducapproxima-tion in vapor pressure and the increase in alkane OH reactivity with alkane size to generate a complete set of
20
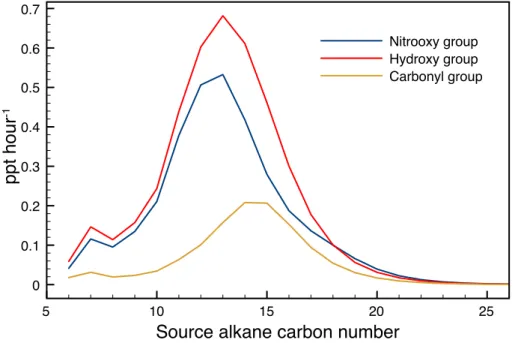
alkane consumption rates due to OH reactions. We then estimate the properties of the OH oxidation products from alkanes using a simplified scheme of 3 species for each carbon number group: an alkyl nitrate, a hydroxy nitrate and a hydroxy carbonyl, with branching ratios ofα, (1−α)α and (1−α)2, respectively as detailed in Appendix B. The absolute contribution of each type of oxidation product to aerosol formation is therefore
ACPD
15, 10677–10708, 2015Particulate organic nitrates observed in an oil and natural gas
production region
L. Lee et al.
Title Page
Abstract Introduction
Conclusions References
Tables Figures
◭ ◮
◭ ◮
Back Close
Full Screen / Esc
Printer-friendly Version
Interactive Discussion
Discussion
P
a
per
|
Discussion
P
a
per
|
Discussion
P
a
per
|
Discussion
P
a
per
|
the individual formation rate weighted byKp. The total aerosol yield attributable to this
mechanism is obtained by summing the yield over all carbon number groups above C6.
We usedαvalues estimated with the method by Carter and Atkinson (Carter and Atkin-son, 1989) updated by Arey et al. (2001) at the appropriate temperature and pressure. The saturation vapor pressureP∗of the reaction products follows the parameterization
5
of SIMPOL.1 (Pankow and Asher, 2008).
Using this procedure, we calculate the particulate nitrate formation rate for the day-time period of 30 January, during which day-time the aerosol loading peaked at 2 µg m−3. Using an approximate daytime OH concentration of 1061 cm−3(Edwards et al., 2013), the total production rate of aerosol phase organic nitrate groups is 3.4 ppt h−1. The
10
condensable molecules responsible for carrying the nitrooxy groups into the aerosol phase have carbon chain lengths in the range of C10 to C17, as shown in Fig. 5. The
representative C : H : O : N ratio of aerosol organics predicted by this alkane-only esti-mation is 18 : 37 : 5 : 1, or a non-nitrate to nitrate mass ratio of 4.5 : 1. This is about half of the value inferred directly from observations (γ=9.6). One possible explanation for
15
the difference is that approximately half of the non-nitrate carbonaceous component originates from oxidation of aromatic compounds (∼10 % of alkanes OH reactivity) or primary sources. Uncertainties in the saturation vapor pressure, and deviation from ideal solution behavior may also contribute.
The result obtained above only utilizes the alkane composition data. Independently,
20
the total production rate of pΣAN can be calculated using time series of the measured pΣAN concentration, by solving the mass balance equation (Eq. 3).
p(pΣAN)=d(pΣAN)
dt +kmix×pΣAN (3)
Briefly, the total production rate of pΣAN (p(pΣAN)) is the rate of change of pΣAN con-centration plus the loss rate. The loss is represented as a first order process with a loss
25
rate constantkmix(1 s− 1
) which can be estimated using the known production rate and concentration of n-propyl nitrate as a tracer (Lee et al., 2014). Turbulent mixing out of the basin was the dominant driver ofkmix. The inferred production rate during the same
ACPD
15, 10677–10708, 2015Particulate organic nitrates observed in an oil and natural gas
production region
L. Lee et al.
Title Page
Abstract Introduction
Conclusions References
Tables Figures
◭ ◮
◭ ◮
Back Close
Full Screen / Esc
Printer-friendly Version
Interactive Discussion
Discussion
P
a
per
|
Discussion
P
a
per
|
Discussion
P
a
per
|
Discussion
P
a
per
|
daytime period as the above analysis is 3.6 ppt h−1, nearly identical to the estimate us-ing alkane composition. It is noted that by assumus-ing the same loss characteristics as n-propyl nitrate, the effect of dry deposition is likely underestimated. Alternatively, the pΣAN formation rate calculated using loss characteristics of HNO3 yields a daytime
production rate that is 21 % higher (4.4 ppt h−1). This is likely an upper limit.
5
4.3 NO3/N2O5chemistry
In addition to daytime source of pΣANs, nighttime chemical production may also be im-portant. The dominant reactions are typically those initiated by NO3and N2O5radicals,
either through gas phase oxidation followed by condensation, or through heteroge-neous reactions on the surface of existing organic aerosol. Due to cold temperatures
10
that make gas phase reactions of NO3less important by shifting the equilibrium towards
N2O5as well as the scarcity of unsaturated hydrocarbons observed, the condensation pathway is likely unimportant. Multiple lab studies on both environmental and synthe-sized aerosol particles (Gross et al., 2009; Zhao et al., 2011a, b; Xiao and Bertram, 2011; Bertram et al., 2009) have demonstrated that the reactive uptake of NO3or N2O5
15
can be significant, and for certain class of organics molecules (e.g. alkenes and alco-hols) can give high yield of organic nitrates as condensed phase products. As opposed to daytime analysis, it is difficult to directly estimate the net nocturnal pΣAN production with Eq. (3) due to lack of concentration variation and difficulty in estimating the loss term. However, we found that inclusion of heterogeneous production is necessary to
20
explain the nighttime concentration of pΣAN and we characterize the heterogeneous reactions in the following modeling section.
4.4 Modelling the aerosol time series
A box model incorporating the above daytime and nighttime mechanisms was used to simulate the organic nitrate content of the aerosol.
ACPD
15, 10677–10708, 2015Particulate organic nitrates observed in an oil and natural gas
production region
L. Lee et al.
Title Page
Abstract Introduction
Conclusions References
Tables Figures
◭ ◮
◭ ◮
Back Close
Full Screen / Esc
Printer-friendly Version
Interactive Discussion
Discussion
P
a
per
|
Discussion
P
a
per
|
Discussion
P
a
per
|
Discussion
P
a
per
|
The observedΣAN is assumed to represent the total concentration of organic nitrates produced due to photochemistry as described in Lee et al. (2014), with an effective saturation vapor pressure as a tuning parameter to determine the effective partitioning based on Eq. (2). The bi-directional exchange is calculated according to gas kinetic theory and detailed balance derived from the saturation vapor pressure accounting for
5
the Kelvin effect.
For the nighttime chemistry, we introduce a new parameter, the retaining coefficient (ζ), defined as the probability of reactive uptake yielding condensed phase organic nitrates given a gas molecule-surface collision. This differs from the reactive uptake coefficient by excluding non-nitrate forming channels. The pΣAN production is
calcu-10
lated from gas molecule-surface collision rate corrected for diffusion transport and then multiplied byζ. The organic nitrates formed through this pathway are assumed to re-main in the condensed phase.
Loss of pΣANs is assumed to follow the loss of aerosols. The most important process is turbulent mixing with a lifetime of∼8 h during daytime periods. The full time series
15
of first order loss rate is calculated using tracer methods (Lee et al., 2014) and applied to the simulation. We used HNO3to estimate the loss rate which gives a more realistic loss profile during the evening when the boundary layer is stable.
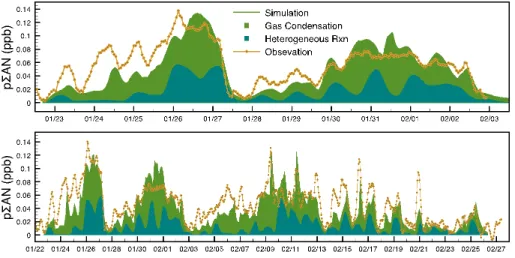
The resulting time series of predicted concentrations are shown in Fig. 6, where the top panel describes the 2 consecutive accumulation periods and the lower panel
ex-20
tends the simulation to all observations. We find an effective saturation vapor pressure of 26 ppb for the ensemble of total organic nitrate species and NO3reactive uptake
co-efficientζNO3 of 0.1 for the full length of simulation. The model is highly correlated with
the observations (slope of 0.98 andR2value of 0.72) over the 2-week period shown in the top panel of Fig. 6. A reduced correlation with a slope of 0.72 and anR2of 0.66 is
25
observed for the full data (bottom panel of Fig. 6). This fitted effective saturation vapor pressure is consistent with one calculated from the VOC speciation (28 ppb ΣANs). The major discrepancies in the extended simulation arise when organic aerosol mass becomes more abundant in the super 0.5 µm size range (up to 36 % of total pΣANs),
ACPD
15, 10677–10708, 2015Particulate organic nitrates observed in an oil and natural gas
production region
L. Lee et al.
Title Page
Abstract Introduction
Conclusions References
Tables Figures
◭ ◮
◭ ◮
Back Close
Full Screen / Esc
Printer-friendly Version
Interactive Discussion
Discussion
P
a
per
|
Discussion
P
a
per
|
Discussion
P
a
per
|
Discussion
P
a
per
|
particularly during the period from 12 to 21 February. It is possible that organics were present as external coatings on the inorganic minerals of large size particles, leading to an enhanced surface to volume ratio relative to a pure particle of the same organic mass. The result is underestimation in predicted organic nitrate content due to discrep-ancies in the aerosol mixing state. Also, the possibilities of secondary chemistry in the
5
presence of inorganic salts cannot be ruled out. The ζNO
3 value of 0.1 should be interpreted as a projection of the overall reactivity onto NO3 reactions, since NO3 and N2O5 interconvert rapidly and both species may
contribute to heterogeneous reactions. Given an observed median NO3/N2O5 ratio
of 0.007, the heterogeneous chemistry may be equally satisfied with an N2O5-based
10
ζN2O5 of 8×10
−4
, or any linear combination of the two channels. However, we point out that due to the enhancement of N2O5 lifetime as a result of the cold
tempera-ture and high NOxconcentrations encountered, the heterogeneous reaction cannot be dominated by NO3 as this requires a value of ζNO3 larger than even aerosols made
of pure unsaturated organic molecules such as solidified oleic acid (γNO3=0.076) and
15
conjugated linoleic acid (γNO
3=0.08) as observed in laboratory studies (Gross et al., 2009). Therefore, N2O5-dominated heterogeneous reactions with hydroxy groups in
the aerosol phase is a more likely source of nighttime pΣAN production, and is within range of reported reactive uptake coefficient measured on surface of glycerol particles (γN2O5=8.14×10
−4
) and wintertime aerosol in Colorado (γN2O5∼0.01) (Wagner et al.,
20
2013). Finally, it is noted that the nocturnal production of pΣANs (6 ppt h−1) does not constitute a significant local sink of NO3(production rate of 150 ppt h−1).
5 Implications
Our particulate organic nitrate measurements during wintertime in the Uintah Basin, Utah represent a unique opportunity to characterize the chemistry of alkane-derived
25
ACPD
15, 10677–10708, 2015Particulate organic nitrates observed in an oil and natural gas
production region
L. Lee et al.
Title Page
Abstract Introduction
Conclusions References
Tables Figures
◭ ◮
◭ ◮
Back Close
Full Screen / Esc
Printer-friendly Version
Interactive Discussion
Discussion
P
a
per
|
Discussion
P
a
per
|
Discussion
P
a
per
|
Discussion
P
a
per
|
of Gentner et al. (2012), both gasoline and diesel fuel sampled at various locations in California were primarily alkanes, with an overall longer chain length in the diesel fuel. Tailpipe emissions of unburnt diesel fuel as well as motor oil (Worton et al., 2014) may represent the predominant source for large alkanes observed in cities (Boynard et al., 2014). For example, VOC enhancement ratios observed in Los Angeles showed a
non-5
decreasing trend from n-nonane to undecane, the largest alkane reported (Borbon et al., 2013). Similar mixing ratios have also been observed in Sacramento, California (Steiner et al., 2008). This is different from the decreasing trend observed in Utah, where the VOC sources are evaporative, but rather consistent with the composition from direct emissions of liquid diesel for which the distribution of C10 to C20 alkanes
10
are relatively flat.
We calculated the potential organic nitrate aerosol formation from alkanes using the liquid fuel composition tabulated in the supporting information of Gentner et al. (2012) and the partitioning method detailed in Sect. 4.2 for OH initiated oxidation. OH reac-tion rates for alkanes larger than dodecane are parameterized (Kwok and Atkinson,
15
1995). For an organic aerosol loading of 2 µg m−3, the organic nitrate aerosol yield is 14 wt.% for diesel fuel and 0.004 wt.% for gasoline, both calculated at 298 K. Since it was estimated by Gentner that both gasoline and diesel vehicles emit similar amount of VOC by weight in the Bakersfield region (Kern county), of the ratio 44 % (gasoline) to 56 % (diesel), the diesel emission dominates the source strength of particulate organic
20
nitrates. We further estimate the potential pΣAN concentrations according to the mass yield calculated above and tailpipe VOC emission of 7 µg m−3 from diesel vehicles, a number we derived based on the SOA production estimation in Gentner et al. The result is 46 ppt pΣAN due to diesel traffic emissions in the Bakersfield region, a value accounting for 77 % of the observed daytime ambient concentration by Rollins et al.
25
(2013), who reported local pΣAN concentration of∼60 ppt during daytime periods of the CalNex-2012 campaign. Contributions from local biogenic precursors as well as fugitive losses from oil and gas productions may account for the remaining particulate
ACPD
15, 10677–10708, 2015Particulate organic nitrates observed in an oil and natural gas
production region
L. Lee et al.
Title Page
Abstract Introduction
Conclusions References
Tables Figures
◭ ◮
◭ ◮
Back Close
Full Screen / Esc
Printer-friendly Version
Interactive Discussion
Discussion
P
a
per
|
Discussion
P
a
per
|
Discussion
P
a
per
|
Discussion
P
a
per
|
nitrates. However, we point out that photochemical aging is required to achieve the yield from our estimation and the above value should be interpreted as an upper limit.
The above example of particulate organic nitrate production around Bakersfield re-gion illustrates the possibility of distinct pathways responsible between daytime and nighttime periods. The saturated, but much heavier alkanes will contribute during the
5
day from OH oxidation and partition more efficiently into the aerosol phase, while the more reactive but generally lighter biogenic emissions may dominate nighttime pro-duction due to NO3 and N2O5 chemistry. This is of particular interest in regions with
representative VOCs consisting of a mixture of anthropogenic and biogenic contribu-tions.
10
6 Conclusion
We present PM2.5 particulate organic nitrate concentration measurements obtained in
wintertime Utah using TD-LIF technique. Of the median 1 µg m−3 organic aerosol esti-mated, we found organic nitrate to be a consistent portion of the organic mass occupy-ing predominately in the sub 0.5 µm particle size ranges of an average C : H : O : N ratio
15
of 34 : 69 : 10 : 1, likely as a mixture of C10to C17organic nitrates and oxygenates. With
the help of a box model, we demonstrate that the particulate organic nitrate concen-tration observed can be reproduced by gas phase condensation and heterogeneous chemistry of N2O5. Both channels contribute almost equally, consistent with the lack
of day/night change observed in condensed phase organic nitrate content. By applying
20
ACPD
15, 10677–10708, 2015Particulate organic nitrates observed in an oil and natural gas
production region
L. Lee et al.
Title Page
Abstract Introduction
Conclusions References
Tables Figures
◭ ◮
◭ ◮
Back Close
Full Screen / Esc
Printer-friendly Version
Interactive Discussion
Discussion
P
a
per
|
Discussion
P
a
per
|
Discussion
P
a
per
|
Discussion
P
a
per
|
Appendix A: Derivation for aerosol specific volume–nitrate concentration relationship
The third panel in Fig. 1 shows the relative importance of total aerosol volume contri-butions from particles above or under 500 nm size. While we have demonstrated the relative domination of organic/inorganic component has a rough boundary at 500 nm,
5
simply treating this as a cut-offpoint will likely lead to non-negligible underestimation of organic component that exists in the over 500 nm size range which contained about half of total PM2.5 aerosol volume. We therefore propose a method that utilizes our
PM2.5pΣAN data as tracers and without assumptions made on the organic content of
the various aerosol size ranges. This method is based on the observation that mineral
10
dust or inorganic salts generally have higher density than organic molecules. Instead of focusing on the metric of density which is not an additive parameter, specific volume (or inverse density in cm3g−1) is used to factor out the inorganic component by linear combination. Under the particular environment of wintertime Uintah Basin, we assume no significant aqueous phase present. As mineral dust and salt are not typically soluble
15
in organic phase, the total volume of the aerosol can be treated as a linear combination of volumes from individual immiscible components, such as the equations presented below:
e
v=X
i
e
vi×fi (A1)
X
i
fi =1 (A2)
20
In Eq. (A1),veis the overall specific volume of the PM2.5 aerosol phase, whilevei and
fi are specific volume and mass fraction of componenti in the aerosol phase,
respec-tively. Mass fractions from all aerosol components should add up to 1 (Eq. A2). We now name 3 components in the aerosol phase to be considered explicitly. First component
fdust represent collectively the inorganic component, including mineral dust and salt.
25
ACPD
15, 10677–10708, 2015Particulate organic nitrates observed in an oil and natural gas
production region
L. Lee et al.
Title Page
Abstract Introduction
Conclusions References
Tables Figures
◭ ◮
◭ ◮
Back Close
Full Screen / Esc
Printer-friendly Version
Interactive Discussion
Discussion
P
a
per
|
Discussion
P
a
per
|
Discussion
P
a
per
|
Discussion
P
a
per
|
The second and third components both represent the organic phase, but was broken down in terms of functionality. We represent the organic nitrate group functionality as
fONO2+Hand the rest of the organic group asfCH2. The presence of oxygenated groups
are treated later in the main text by further breaking down the fCH2 component. For
the time being, this effectively represent the organic molecules as a nominal formula of
5
H(CH2)n(ONO2)m. The explicit inclusion of one extra hydrogen to the−ONO2group is
for valence balance of a fully saturated molecule. The resulting representation forveis therefore:
e
v=evdust×fdust+veONO2×fONO2+H+evCH2×fCH2 (A3)
Since it was observed that the nitrate group is a rather consistent component of the
10
organic aerosols (Fig. 3), we expectfCH2 to vary withfONO2+Hby a constant coefficient γso thatfCH
2=γ×fONO2+H. This gives us Eq. (A4): e
v=evdust×fdust+
e
vONO2+γ×veCH2
×fONO2+H (A4)
By further assuming that the specific volume of the nitrate group is the same as the CH2 fragment in a large organic molecule (subsequently calledevorg) and using the constraint
15
from Eq. (A2) to substitute for fdust, we arrive at Eq. (A5) which we may simplify into
Eq. (A6) (or Eq. (1) in the main text) by rearrangement of terms and replacingfONO
2+H withfONO2, since the mass of a hydrogen is small compared to the mass of a nitrooxy
group.
e
v=evdust×[1−(1+γ)×fONO2+H]+(1+γ)×veorg×fONO2+H (A5)
20
e
v=evdust+ evorg−vedust
×(1+γ)×fONO2 (A6)
We see that Eq. (A6) predicts a linear relationship between PM2.5specific volume and
mass fraction of the nitrooxy group in the aerosol phase, under conditions where the inorganic and organic components have relatively constant specific mass. We demon-strate that this relation is indeed observed during UBWOS 2012 in Fig. 4.
ACPD
15, 10677–10708, 2015Particulate organic nitrates observed in an oil and natural gas
production region
L. Lee et al.
Title Page
Abstract Introduction
Conclusions References
Tables Figures
◭ ◮
◭ ◮
Back Close
Full Screen / Esc
Printer-friendly Version
Interactive Discussion
Discussion
P
a
per
|
Discussion
P
a
per
|
Discussion
P
a
per
|
Discussion
P
a
per
|
Appendix B: Estimation ofΣAN contribution using extrapolated VOC reactivity
To estimate specific contributions of organic nitrates to the aerosol formation, we traced oxidation of long-chain alkanes up to the second generation RO2 products. Consider
a simple alkane R, the dominant OH reaction is abstraction of hydrogen to give the first generation RO2radical which upon reaction with abundant NO during UBWOS
condi-5
tion leads to alkyl nitrate compound R(ONO2) and alkoxy radical RO of relative yield αand (1−α). For R with carbon chain length over 6, the isomerization dominates the fate of RO by hydrogen abstraction within the same molecule through a 6-membered ring transition state (rate constant typically >104s−1). The result is a hydroxy peroxy radical upon reaction with O2 (second generation RO2). The same NO reaction
pro-10
ceeds to give a second generation hydroxy nitrate R(OH) (ONO2) and a hydroxy alkoxy
radical, which may promptly react (>105s−1) with the hydrogen on the hydroxy group carbon to give a hydroxy carbonyl R(=O) (OH) which is assumed to represent the rest of the non-nitrate functionality under our simplification. It is also assumed that the or-ganic nitrate yield are not affected by the presence of non-neighboring OH group to
15
give the simplified branching ratios shown in Reactions (R B1) to (R B3). We then cal-culate the vapor pressure of each molecule surrogate using group contribution method SIMPOL.1, of a given carbon chain length in the R group at 273 K.
α R+OH→R(ONO2) (R B1)
(1−α)×α R+OH→R(OH)(ONO2) (R B2)
20
(1−α)2 R+OH→R(=O)(OH) (R B3)
In order to obtain a converging estimation with respect to the long-carbon chain end of the VOC spectrum, it is necessary to extrapolate the contribution of heavy VOCs beyond the measurement which terminates at undecane. Using a linear fit in the log space of the grouped VOC reactivity with specific carbon number, we obtained an
esti-25
mation shown in Eq. (B1) for the 30 January accumulation period wherekxis the total
ACPD
15, 10677–10708, 2015Particulate organic nitrates observed in an oil and natural gas
production region
L. Lee et al.
Title Page
Abstract Introduction
Conclusions References
Tables Figures
◭ ◮
◭ ◮
Back Close
Full Screen / Esc
Printer-friendly Version
Interactive Discussion
Discussion
P
a
per
|
Discussion
P
a
per
|
Discussion
P
a
per
|
Discussion
P
a
per
|
reactivity in unit of s−1of alkanes with carbon numbern.
ln(kx)=−0.5893×n+3.9223 (B1)
Sn{R(OH)(ONO2)}=kx×[OH]×(1−α)×α×Kp (B2)
The total aerosol source of each molecule type within each carbon number class is then calculated in the same way shown for the hydroxy nitrates of sizen(Eq. B2). NoteKp
5
is the fraction of the species in the aerosol phase, calculated using Eq. (2) in the main text. The total nitrate groups incorporated into the aerosol phase is the calculated by summing over all carbon groups of alkyl nitrates and hydroxy nitrates. Other functional groups is calculated similarity with application of appropriate weightings. For example, the total CH2group contribution is calculated according to Eq. (B3).
10
X
n
n× Sn{R(ONO2)}+Sn{R(OH)(ONO2)}+Sn{R(=O)(OH)}
(B3)
Acknowledgements. The Berkeley authors acknowledge the NOAA office of global programs NA13OAR4310067 and NSF AGS-1120076 for their support of this research. The authors also acknowledge the help of C. Warneke for preparation of the manuscript.
References
15
Arey, J., Aschmann, S. M., Kwok, E. S. C., and Atkinson, R.: Alkyl nitrate, hydroxyalkyl ni-trate, and hydroxycarbonyl formation from the NOx-air photooxidations of C-5-C-8 n-alkanes, J. Phys. Chem. A, 105, 1020–1027, doi:10.1021/jp003292z, 2001.
Bahreini, R., Middlebrook, A. M., de Gouw, J. A., Warneke, C., Trainer, M., Brock, C. A., Stark, H., Brown, S. S., Dube, W. P., Gilman, J. B., Hall, K., Holloway, J. S., Kuster, W. C.,
Per-20
ACPD
15, 10677–10708, 2015Particulate organic nitrates observed in an oil and natural gas
production region
L. Lee et al.
Title Page
Abstract Introduction
Conclusions References
Tables Figures
◭ ◮
◭ ◮
Back Close
Full Screen / Esc
Printer-friendly Version
Interactive Discussion
Discussion
P
a
per
|
Discussion
P
a
per
|
Discussion
P
a
per
|
Discussion
P
a
per
|
Bertram, T. H., Thornton, J. A., Riedel, T. P., Middlebrook, A. M., Bahreini, R., Bates, T. S., Quinn, P. K., and Coffman, D. J.: Direct observations of N2O5reactivity on ambient aerosol particles, Geophys. Res. Lett., 36, 5, doi:10.1029/2009gl040248, 2009.
Borbon, A., Gilman, J. B., Kuster, W. C., Grand, N., Chevaillier, S., Colomb, A., Dolgorouky, C., Gros, V., Lopez, M., Sarda-Esteve, R., Holloway, J., Stutz, J., Petetin, H., McKeen, S.,
Beek-5
mann, M., Warneke, C., Parrish, D. D., and de Gouw, J. A.: Emission ratios of anthro-pogenic volatile organic compounds in northern mid-latitude megacities: observations vs. emission inventories in Los Angeles and Paris, J. Geophys. Res.-Atmos., 118, 2041–2057, doi:10.1002/jgrd.50059, 2013.
Boynard, A., Borbon, A., Leonardis, T., Barletta, B., Meinardi, S., Blake, D. R., and Locoge, N.:
10
Spatial and seasonal variability of measured anthropogenic non-methane hydrocarbons in urban atmospheres: implication on emission ratios, Atmos. Environ., 82, 258–267, doi:10.1016/j.atmosenv.2013.09.039, 2014.
Brown, S. S., deGouw, J. A., Warneke, C., Ryerson, T. B., Dubé, W. P., Atlas, E., Weber, R. J., Peltier, R. E., Neuman, J. A., Roberts, J. M., Swanson, A., Flocke, F., McKeen, S. A.,
15
Brioude, J., Sommariva, R., Trainer, M., Fehsenfeld, F. C., and Ravishankara, A. R.: Noc-turnal isoprene oxidation over the Northeast United States in summer and its impact on reactive nitrogen partitioning and secondary organic aerosol, Atmos. Chem. Phys., 9, 3027– 3042, doi:10.5194/acp-9-3027-2009, 2009.
Carter, W. P. L. and Atkinson, R.: Alkyl nitrate formation from the atmospheric
pho-20
tooxidation of alkanes – a revised estimation method, J. Atmos. Chem., 8, 165–173, doi:10.1007/bf00053721, 1989.
Day, D. A., Wooldridge, P. J., Dillon, M. B., Thornton, J. A., and Cohen, R. C.: A thermal dissociation laser-induced fluorescence instrument for in situ detection of NO(2), peroxy nitrates, alkyl nitrates, and HNO(3), J. Geophys. Res.-Atmos., 107, ACH 4-1-ACH 4-14,
25
doi:10.1029/2001jd000779, 2002.
Day, D. A., Liu, S., Russell, L. M., and Ziemann, P. J.: Organonitrate group concentrations in submicron particles with high nitrate and organic fractions in coastal southern California, Atmos. Environ., 44, 1970–1979, doi:10.1016/j.atmosenv.2010.02.045, 2010.
de Gouw, J. A., Middlebrook, A. M., Warneke, C., Ahmadov, R., Atlas, E. L., Bahreini, R.,
30
Blake, D. R., Brock, C. A., Brioude, J., Fahey, D. W., Fehsenfeld, F. C., Holloway, J. S., Le Henaff, M., Lueb, R. A., McKeen, S. A., Meagher, J. F., Murphy, D. M., Paris, C., Parrish, D. D., Perring, A. E., Pollack, I. B., Ravishankara, A. R., Robinson, A. L.,
ACPD
15, 10677–10708, 2015Particulate organic nitrates observed in an oil and natural gas
production region
L. Lee et al.
Title Page
Abstract Introduction
Conclusions References
Tables Figures
◭ ◮
◭ ◮
Back Close
Full Screen / Esc
Printer-friendly Version
Interactive Discussion
Discussion
P
a
per
|
Discussion
P
a
per
|
Discussion
P
a
per
|
Discussion
P
a
per
|
erson, T. B., Schwarz, J. P., Spackman, J. R., Srinivasan, A., and Watts, L. A.: Organic aerosol formation downwind from the Deepwater Horizon oil spill, Science, 331, 1295–1299, doi:10.1126/science.1200320, 2011.
Edwards, P. M., Young, C. J., Aikin, K., deGouw, J., Dubé, W. P., Geiger, F., Gilman, J., Helmig, D., Holloway, J. S., Kercher, J., Lerner, B., Martin, R., McLaren, R., Parrish, D. D.,
5
Peischl, J., Roberts, J. M., Ryerson, T. B., Thornton, J., Warneke, C., Williams, E. J., and Brown, S. S.: Ozone photochemistry in an oil and natural gas extraction region during win-ter: simulations of a snow-free season in the Uintah Basin, Utah, Atmos. Chem. Phys., 13, 8955–8971, doi:10.5194/acp-13-8955-2013, 2013.
Farmer, D. K., Matsunaga, A., Docherty, K. S., Surratt, J. D., Seinfeld, J. H., Ziemann, P. J., and
10
Jimenez, J. L.: Response of an aerosol mass spectrometer to organonitrates and organosul-fates and implications for atmospheric chemistry, P. Natl. Acad. Sci. USA, 107, 6670–6675, doi:10.1073/pnas.0912340107, 2010.
Froyd, K. D., Murphy, S. M., Murphy, D. M., de Gouw, J. A., Eddingsaas, N. C., and Wennberg, P. O.: Contribution of isoprene-derived organosulfates to free tropospheric
15
aerosol mass, P. Natl. Acad. Sci. USA, 107, 21360–21365, doi:10.1073/pnas.1012561107, 2010.
Garnes, L. A. and Allen, D. T.: Size distributions of organonitrates in ambient aerosol collected in Houston, Texas, Aerosol Sci. Technol., 36, 983–992, doi:10.1080/02786820290092186, 2002.
20
Gentner, D. R., Isaacman, G., Worton, D. R., Chan, A. W. H., Dallmann, T. R., Davis, L., Liu, S., Day, D. A., Russell, L. M., Wilson, K. R., Weber, R., Guha, A., Harley, R. A., and Gold-stein, A. H.: Elucidating secondary organic aerosol from diesel and gasoline vehicles through detailed characterization of organic carbon emissions, P. Natl. Acad. Sci. USA, 109, 18318– 18323, doi:10.1073/pnas.1212272109, 2012.
25
Goldstein, A. H. and Galbally, I. E.: Known and unexplored organic constituents in the Earth’s atmosphere, Environ. Sci. Technol., 41, 1514–1521, doi:10.1021/es072476p, 2007.
Gordon, T. D., Tkacik, D. S., Presto, A. A., Zhang, M., Jathar, S. H., Nguyen, N. T., Massetti, J., Tin, T., Cicero-Fernandez, P., Maddox, C., Rieger, P., Chattopadhyay, S., Maldonado, H., Maricq, M. M., and Robinson, A. L.: Primary gas- and particle-phase emissions and
sec-30
ACPD
15, 10677–10708, 2015Particulate organic nitrates observed in an oil and natural gas
production region
L. Lee et al.
Title Page
Abstract Introduction
Conclusions References
Tables Figures
◭ ◮
◭ ◮
Back Close
Full Screen / Esc
Printer-friendly Version
Interactive Discussion
Discussion
P
a
per
|
Discussion
P
a
per
|
Discussion
P
a
per
|
Discussion
P
a
per
|
Gross, S., Iannone, R., Xiao, S., and Bertram, A. K.: Reactive uptake studies of NO(3) and N(2)O(5) on alkenoic acid, alkanoate, and polyalcohol substrates to probe nighttime aerosol chemistry, Phys. Chem. Chem. Phys., 11, 7792–7803, doi:10.1039/b904741g, 2009. Hallquist, M., Wenger, J. C., Baltensperger, U., Rudich, Y., Simpson, D., Claeys, M.,
Dom-men, J., Donahue, N. M., George, C., Goldstein, A. H., Hamilton, J. F., Herrmann, H., Hoff
-5
mann, T., Iinuma, Y., Jang, M., Jenkin, M. E., Jimenez, J. L., Kiendler-Scharr, A., Maen-haut, W., McFiggans, G., Mentel, Th. F., Monod, A., Prévôt, A. S. H., Seinfeld, J. H., Sur-ratt, J. D., Szmigielski, R., and Wildt, J.: The formation, properties and impact of sec-ondary organic aerosol: current and emerging issues, Atmos. Chem. Phys., 9, 5155–5236, doi:10.5194/acp-9-5155-2009, 2009.
10
Jathar, S. H., Miracolo, M. A., Tkacik, D. S., Donahue, N. M., Adams, P. J., and Robinson, A. L.: Secondary organic aerosol formation from photo-oxidation of unburned fuel: experimental results and implications for aerosol formation from combustion emissions, Environ. Sci. Tech-nol., 47, 12886–12893, doi:10.1021/es403445q, 2013.
Jordan, C. E., Ziemann, P. J., Griffin, R. J., Lim, Y. B., Atkinson, R., and Arey, J.: Modeling
15
SOA formation from OH reactions with C-8-C-17 n-alkanes, Atmos. Environ., 42, 8015–8026, doi:10.1016/j.atmosenv.2008.06.017, 2008.
Kleinman, M. T., Bhalla, D. K., Mautz, W. J., and Phalen, R. F.: Cellular and immunological injury with PM10inhalation, Inhal. Toxicol., 7, 589–602, doi:10.3109/08958379509014467, 1995. Kwok, E. S. C. and Atkinson, R.: Estimation of hydroxyl radical reaction-rate constants for
gas-20
phase organic-compounds using a structure–reactivity relationship – an update, Atmos. En-viron., 29, 1685–1695, doi:10.1016/1352-2310(95)00069-b, 1995.
Lee, L., Wooldridge, P., Nah, T., Wilson, K., and Cohen, R.: Observation of rates and products in the reaction of NO3with submicron squalane and squalene aerosol, Phys. Chem. Chem. Phys., 15, 882–892, doi:10.1039/c2cp42500a, 2013.
25
Lee, L., Wooldridge, P. J., Gilman, J. B., Warneke, C., de Gouw, J., and Cohen, R. C.: Low temperatures enhance organic nitrate formation: evidence from observations in the 2012 Uintah Basin Winter Ozone Study, Atmos. Chem. Phys., 14, 12441–12454, doi:10.5194/acp-14-12441-2014, 2014.
Lewis, C. W., Klouda, G. A., and Ellenson, W. D.: Radiocarbon measurement of the biogenic
30
contribution to summertime PM-2.5 ambient aerosol in Nashville, TN, Atmos. Environ., 38, 6053–6061, doi:10.1016/j.atmosenv.2004.06.011, 2004.
ACPD
15, 10677–10708, 2015Particulate organic nitrates observed in an oil and natural gas
production region
L. Lee et al.
Title Page
Abstract Introduction
Conclusions References
Tables Figures
◭ ◮
◭ ◮
Back Close
Full Screen / Esc
Printer-friendly Version
Interactive Discussion
Discussion
P
a
per
|
Discussion
P
a
per
|
Discussion
P
a
per
|
Discussion
P
a
per
|
Lim, Y. B. and Ziemann, P. J.: Chemistry of secondary organic aerosol formation from OH radical-initiated reactions of linear, branched, and cyclic alkanes in the presence of NOx, Aerosol Sci. Technol., 43, 604–619, doi:10.1080/02786820902802567, 2009.
Matsunaga, A. and Ziemann, P. J.: Yields of beta-hydroxynitrates, dihydroxynitrates, and trihy-droxynitrates formed from OH radical-initiated reactions of 2-methyl-1-alkenes, P. Natl. Acad.
5
Sci. USA, 107, 6664–6669, doi:10.1073/pnas.0910585107, 2010.
Mylonas, D. T., Allen, D. T., Ehrman, S. H., and Pratsinis, S. E.: The sources and size dis-tributions of organonitrates in Los-Angeles aerosol, Atmos. Environ. A, 25, 2855–2861, doi:10.1016/0960-1686(91)90211-o, 1991.
Pankow, J. F. and Asher, W. E.: SIMPOL.1: a simple group contribution method for predicting
10
vapor pressures and enthalpies of vaporization of multifunctional organic compounds, Atmos. Chem. Phys., 8, 2773–2796, doi:10.5194/acp-8-2773-2008, 2008.
Paulot, F., Crounse, J. D., Kjaergaard, H. G., Kuerten, A., St Clair, J. M., Seinfeld, J. H., and Wennberg, P. O.: Unexpected epoxide formation in the gas-phase photooxidation of isoprene, Science, 325, 730–733, doi:10.1126/science.1172910, 2009.
15
Roberts, J. M., Osthoff, H. D., Brown, S. S., Ravishankara, A. R., Coffman, D., Quinn, P., and Bates, T.: Laboratory studies of products of N2O5uptake on Cl−containing substrates, Geo-phys. Res. Lett., 36, L20808, doi:10.1029/2009gl040448, 2009.
Rollins, A. W., Kiendler-Scharr, A., Fry, J. L., Brauers, T., Brown, S. S., Dorn, H.-P., Dubé, W. P., Fuchs, H., Mensah, A., Mentel, T. F., Rohrer, F., Tillmann, R., Wegener, R., Wooldridge, P. J.,
20
and Cohen, R. C.: Isoprene oxidation by nitrate radical: alkyl nitrate and secondary organic aerosol yields, Atmos. Chem. Phys., 9, 6685–6703, doi:10.5194/acp-9-6685-2009, 2009. Rollins, A. W., Fry, J. L., Hunter, J. F., Kroll, J. H., Worsnop, D. R., Singaram, S. W., and
Cohen, R. C.: Elemental analysis of aerosol organic nitrates with electron ionization high-resolution mass spectrometry, Atmos. Meas. Tech., 3, 301–310,
doi:10.5194/amt-3-301-25
2010, 2010a.
Rollins, A. W., Smith, J. D., Wilson, K. R., and Cohen, R. C.: Real time in situ detec-tion of organic nitrates in atmospheric aerosols, Environ. Sci. Technol., 44, 5540–5545, doi:10.1021/es100926x, 2010b.
Rollins, A. W., Browne, E. C., Min, K. E., Pusede, S. E., Wooldridge, P. J., Gentner, D. R.,
30
ACPD
15, 10677–10708, 2015Particulate organic nitrates observed in an oil and natural gas
production region
L. Lee et al.
Title Page
Abstract Introduction
Conclusions References
Tables Figures
◭ ◮
◭ ◮
Back Close
Full Screen / Esc
Printer-friendly Version
Interactive Discussion
Discussion
P
a
per
|
Discussion
P
a
per
|
Discussion
P
a
per
|
Discussion
P
a
per
|
Rollins, A. W., Pusede, S., Wooldridge, P., Min, K. E., Gentner, D. R., Goldstein, A. H., Liu, S., Day, D. A., Russell, L. M., Rubitschun, C. L., Surratt, J. D., and Cohen, R. C.: Gas/particle partitioning of total alkyl nitrates observed with TD-LIF in Bakersfield, J. Geophys. Res.-Atmos., 118, 6651–6662, doi:10.1002/jgrd.50522, 2013.
Shilling, J. E., Zaveri, R. A., Fast, J. D., Kleinman, L., Alexander, M. L., Canagaratna, M. R.,
Fort-5
ner, E., Hubbe, J. M., Jayne, J. T., Sedlacek, A., Setyan, A., Springston, S., Worsnop, D. R., and Zhang, Q.: Enhanced SOA formation from mixed anthropogenic and biogenic emissions during the CARES campaign, Atmos. Chem. Phys., 13, 2091–2113, doi:10.5194/acp-13-2091-2013, 2013.
Steiner, A. L., Cohen, R. C., Harley, R. A., Tonse, S., Millet, D. B., Schade, G. W., and
10
Goldstein, A. H.: VOC reactivity in central California: comparing an air quality model to ground-based measurements, Atmos. Chem. Phys., 8, 351–368, doi:10.5194/acp-8-351-2008, 2008.
Szidat, S., Jenk, T. M., Gaggeler, H. W., Synal, H. A., Fisseha, R., Baltensperger, U., Kalberer, M., Samburova, V., Reimann, S., Kasper-Giebl, A., and Hajdas, I.:
Ra-15
diocarbon (C14)-deduced biogenic and anthropogenic contributions to organic carbon (OC) of urban aerosols from Zurich, Switzerland, Atmos. Environ., 38, 4035–4044, doi:10.1016/j.atmosenv.2004.03.066, 2004.
Thornton, J. A., Wooldridge, P. J., and Cohen, R. C.: Atmospheric NO2: in situ laser-induced fluorescence detection at parts per trillion mixing ratios, Anal. Chem., 72, 528–539,
20
doi:10.1021/ac9908905, 2000.
Wagner, N. L., Dubé, W. P., Washenfelder, R. A., Young, C. J., Pollack, I. B., Ryerson, T. B., and Brown, S. S.: Diode laser-based cavity ring-down instrument for NO3,N2O5, NO, NO2and O3from aircraft, Atmos. Meas. Tech., 4, 1227–1240, doi:10.5194/amt-4-1227-2011, 2011. Weber, R. J., Sullivan, A. P., Peltier, R. E., Russell, A., Yan, B., Zheng, M., de Gouw, J.,
25
Warneke, C., Brock, C., Holloway, J. S., Atlas, E. L., and Edgerton, E.: A study of secondary organic aerosol formation in the anthropogenic-influenced southeastern United States, J. Geophys. Res.-Atmos., 112, 13, doi:10.1029/2007jd008408, 2007.
Went, F. W.: Blue hazes in the atmosphere, Nature, 187, 641–643, doi:10.1038/187641a0, 1960.
30
Williams, J., Roberts, J. M., Bertman, S. B., Stroud, C. A., Fehsenfeld, F. C., Baumann, K., Buhr, M. P., Knapp, K., Murphy, P. C., Nowick, M., and Williams, E. J.: A method for the