TCD
7, 5711–5734, 2013Microwave emissivity variability of snow-covered sea ice
S. Willmes et al.
Title Page
Abstract Introduction
Conclusions References
Tables Figures
◭ ◮
◭ ◮
Back Close
Full Screen / Esc
Printer-friendly Version Interactive Discussion
Discussion
P
a
per
|
D
iscussion
P
a
per
|
Discussion
P
a
per
|
Discuss
ion
P
a
per
|
The Cryosphere Discuss., 7, 5711–5734, 2013 www.the-cryosphere-discuss.net/7/5711/2013/ doi:10.5194/tcd-7-5711-2013
© Author(s) 2013. CC Attribution 3.0 License.
Open Access
The Cryosphere
Discussions
This discussion paper is/has been under review for the journal The Cryosphere (TC). Please refer to the corresponding final paper in TC if available.
The microwave emissivity variability of
snow covered first-year sea ice from late
winter to early summer: a model study
S. Willmes1, M. Nicolaus2, and C. Haas3 1
University of Trier, Environmental Meteorology, 54286 Trier, Germany
2
Sea Ice Physics, Helmholtz-Zentrum für Polar- und Meeresforschung, 27570 Bremerhaven, Germany
3
Earth and Space Science and Engineering, York University, Toronto, Canada
Received: 14 October 2013 – Accepted: 17 November 2013 – Published: 3 December 2013
Correspondence to: S. Willmes ([email protected])
TCD
7, 5711–5734, 2013Microwave emissivity variability of snow-covered sea ice
S. Willmes et al.
Title Page
Abstract Introduction
Conclusions References
Tables Figures
◭ ◮
◭ ◮
Back Close
Full Screen / Esc
Printer-friendly Version Interactive Discussion
Discussion
P
a
per
|
D
iscussion
P
a
per
|
Discussion
P
a
per
|
Discuss
ion
P
a
per
|
Abstract
Satellite observations of microwave brightness temperatures between 19 GHz and 85 GHz are the main data source for operational sea-ice monitoring. However, the sea ice microwave emissivity is subject to pronounced seasonal variations and shows sig-nificant hemispheric contrasts that mainly arise from differences in the rate and strength
5
of snow metamorphism and melt. We use the thermodynamic snow model SNTHERM and the microwave emission model MEMLS to identify the contribution of regional pat-terns in atmospheric energy fluxes to surface emissivity variations on Arctic and Antarc-tic sea ice between 2000 and 2009. The obtained emissivity data reveal a pronounced seasonal cycle with a large regional variability. The emissivity variability increases from
10
winter to early summer and is more pronounced in the Antarctic. In the pre-melt period (January–May, July–November) the variations in surface microwave emissivity due to diurnal, regional and inter-annual variability of atmospheric forcing reach up to 3.4 %, 4.3 %, and 9.7 % for 19 GHz, 37 GHz and 85 GHz channels, respectively. Small but sig-nificant emissivity trends can be observed in the Weddell Sea during November and
15
December as well as in Fram Strait during February. The obtained emissivity data lend themselves for an assessment of sea-ice concentration and snow-depth algorithm ac-curacies.
1 Introduction
The temporal and spatial variability of sea ice and its physical properties are
opera-20
tionally observed with satellite passive microwave radiometers since more than 30 yr (e.g. Eppler et al., 1992; Gloersen et al., 1992; Bjørgo et al., 1997). As one of the most important parameters in an operational global monitoring of the polar oceans sea-ice concentration is derived daily in the Arctic and Southern Oceans (e.g., Comiso et al., 1997; Comiso and Nishio, 2008; Cavalieri et al., 1996; Spreen et al., 2008). A retrieval
25
con-TCD
7, 5711–5734, 2013Microwave emissivity variability of snow-covered sea ice
S. Willmes et al.
Title Page
Abstract Introduction
Conclusions References
Tables Figures
◭ ◮
◭ ◮
Back Close
Full Screen / Esc
Printer-friendly Version Interactive Discussion
Discussion
P
a
per
|
D
iscussion
P
a
per
|
Discussion
P
a
per
|
Discuss
ion
P
a
per
|
trast of sea ice and the open ocean at microwave frequencies from 6 GHz to 90 GHz (e.g. Comiso, 1986; Gloersen et al., 1992; Cavalieri et al., 1997; Lubin et al., 1997; Svendsen et al., 1987). A more detailed retrieval of sea-ice and snow properties, e.g. thickness, roughness, age (e.g. Markus et al., 2006; Haas, 2001) from satellite mi-crowave data is subject to regional, seasonal and hemispheric peculiarities and most
5
often strictly dependent on the availability of coincident field measurements. Any re-trieval technique for sea-ice characteristics based on passive microwave data relies on emissivity proxies that are derived from the microwave brightness temperature data at different channels and polarizations (e.g. Comiso et al., 1997, 2003; Spreen et al., 2008). From a comparison with field data or other ground-truth references tie points
10
or transfer functions are deducted to allow for an inversion from microwave measure-ments to sea-ice concentration or surface properties like snow thickness (Markus and Cavalieri, 1998; Markus et al., 2006). Critical to this inversion are, however, seasonal and regional variations in the surface microwave emissivity that are caused by diff er-ences in atmospheric forcing and associated snow processes (Meier and Notz, 2010).
15
As shown by Andersen et al. (2007) variations in sea-ice concentration retrievals over high-concentration Arctic sea ice are affected by anomalous snow emissivities. Their study concludes that long-term trends in surface and atmospheric properties influence computed trends in sea-ice extent and area through their undetermined impact on mi-crowave emissivities.
20
As far as hemispheric contrasts are concerned the seasonal progression of snow de-cay differs significantly between the Arctic and the Antarctic (Andreas and Ackley, 1982; Nicolaus et al., 2006). The stage of advanced melt (Livingstone et al., 1997) that is characterized by persistent snowmelt during summer is dominant in the Arctic (Comiso and Kwok, 1996; Garrity, 1992) while diurnal freeze-thaw cycles prevail on Antarctic
25
TCD
7, 5711–5734, 2013Microwave emissivity variability of snow-covered sea ice
S. Willmes et al.
Title Page
Abstract Introduction
Conclusions References
Tables Figures
◭ ◮
◭ ◮
Back Close
Full Screen / Esc
Printer-friendly Version Interactive Discussion
Discussion
P
a
per
|
D
iscussion
P
a
per
|
Discussion
P
a
per
|
Discuss
ion
P
a
per
|
snow causes a low sea-ice concentration bias has been identified and described by e.g. Cavalieri et al. (1990), Comiso et al. (1997) and effects of snow layering during late summer on sea-ice concentration retrieval were evaluated by Markus and Dokken (2002).
In this paper we investigate the variability of the microwave emissivity of
snow-5
covered first-year ice (FYI) from a combined thermodynamic/microwave model ap-proach. We examine the processes involved with atmospherically driven snow meta-morphism and their effect on the microwave properties of snow-covered sea ice in the Arctic and Antarctic. We do not take into account a pre-conditioning of the snow cover, nor do we try to simulate snow accumulation, flooding and the effect of basal heat
10
fluxes. Our approach is based on an idealized initial snow cover that is exposed to typical atmospheric forcing in either hemisphere. We want to identify the contribution of regional patterns in atmospheric energy fluxes to surface emissivity variations on Arctic and Antarctic sea ice and the resulting hemispheric contrasts in the seasonal microwave brightness temperature (Tb) evolution. We use the one-dimensional snow
15
model SNTHERM (Jordan, 1991; Nicolaus et al., 2006) and the Microwave Emission Model for Layered Snowpacks (MEMLS, Wiesmann and Mätzler, 1999), adapted to snow on sea ice by Tonboe et al. (2006). With the results presented here we want to provide a dataset of the seasonal variability and regional specifications of the mi-crowave emissivity variability of FYI in the 19 to 85 GHz frequency range. This dataset
20
lends itself for an assessment and improvement of potential accuracies of sea-ice and snow retrieval algorithms that are based on any form of emissivity patterns.
2 Data and methods
Physical snow properties of a layered snow pack on sea ice are simulated by the one-dimensional energy- and mass-balance model SNTHERM. The model was created by
25
TCD
7, 5711–5734, 2013Microwave emissivity variability of snow-covered sea ice
S. Willmes et al.
Title Page
Abstract Introduction
Conclusions References
Tables Figures
◭ ◮
◭ ◮
Back Close
Full Screen / Esc
Printer-friendly Version Interactive Discussion
Discussion
P
a
per
|
D
iscussion
P
a
per
|
Discussion
P
a
per
|
Discuss
ion
P
a
per
|
similar experiments, starting each simulation with a new initialization in winter (Arctic: January, Antarctic: July). We chose SNTHERM since it allows for high-resolution (mm-scale) simulations of the seasonal evolution of a snow pack on sea ice as a function of atmospheric forcing and initial stratigraphy. Representing all snow layers by distinct control volumes in a moving vertical grid has the advantage of treating natural
strati-5
graphic units within the snow. SNTHERM was forced with six-hourly data of the 2 m air temperature, relative humidity, 10 m wind speed, incoming shortwave radiation and downward longwave radiation from the European Center for Medium Range Weather Forecast (ECMWF) ERA interim data at 0.75◦resolution (Dee et al., 2011).
The Microwave Emission Model for Layered Snowpacks (MEMLS, Wiesmann and
10
Mätzler, 1999; Mätzler and Wiesmann, 1999) is used to compute microwave brightness temperatures from vertical snow profiles. We use a sea ice version of MEMLS (Tonboe et al., 2006; Tonboe, 2010) to account for the effect of sea-ice dielectric properties on microwave brightness temperatures. The model calculates Tb at frequencies between 5 GHz and 200 GHz for vertical and horizontal polarizations. Here we use Tb values at
15
frequencies of 19 GHz, 37 GHz and 85 GHz (hereafter referred to as 19 V, 19H, 37 V, 37H, 85H and 85 V), to compare results with the sensors used in operational satellite microwave monitoring, i.e. the Special Sensor Microwave Imager (SSM/I) radiometer and (with similar frequencies) the Advanced Microwave Scanning Radiometer (AMSR). All simulations are at 50◦incidence angle, as typical for conically scanning radiometers. 20
SNTHERM and MEMLS are used in a combined model study to infer the temporal evolution of sea-ice microwave brightness temperatures for typical atmospheric forcing conditions in the Arctic and Antarctic. Since we focus on the surface forcing, we neglect the basal (ocean) heat flux and sea-ice growth. Instead, we perform our experiments with 60 cm of sea ice with a density of 910 kg m−3 that is covered with an initial snow
25
TCD
7, 5711–5734, 2013Microwave emissivity variability of snow-covered sea ice
S. Willmes et al.
Title Page
Abstract Introduction
Conclusions References
Tables Figures
◭ ◮
◭ ◮
Back Close
Full Screen / Esc
Printer-friendly Version Interactive Discussion
Discussion
P
a
per
|
D
iscussion
P
a
per
|
Discussion
P
a
per
|
Discuss
ion
P
a
per
|
Although regional differences in snow depth and snow stratigraphies are docu-mented (e.g. Warren et al., 1999; Massom et al., 2001; Nicolaus et al., 2009) we set this model experiment up with the same initialization profile in all considered regions. This approach enables us to identify the net effect of atmospheric forcing on regional changes in the microwave emissivity, without strong impacts of the initial (winter) snow
5
properties. Our simulations are not able to reproduce flooding and snow-ice forma-tion, snowfall is also not considered. With this setup, however, we are able to identify the isolated contribution of regional patterns in atmospheric energy fluxes to surface emissivity variations.
The temperature in the lowest ice layer is assumed to be at the freezing point of
10
−1.8◦C while the initial snow surface temperature is set to the ERA interim air
temper-ature for each position and year. Linear tempertemper-ature profiles are assumed in sea ice and snow with the temperature at the snow/ice interface representing one third of the total temperature gradient from the sea-ice bottom to the snow surface.
We created forcing data for SNTHERM from six-hourly ERA interim reanalysis for
15
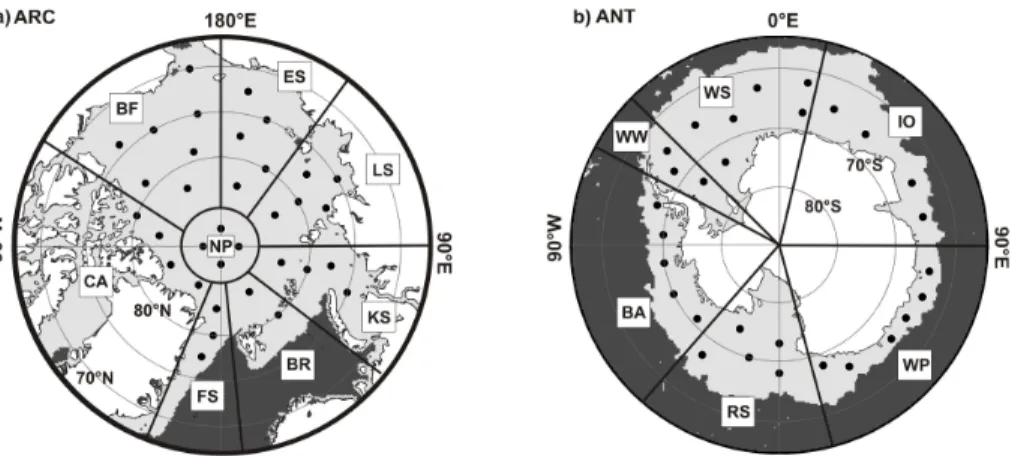
10 yr (2000 to 2009), at 34 positions for 8 different regions in the Arctic (January to June) and at 29 positions for 6 regions in the Antarctic (July to December, Fig. 1) where sea ice is regularly present at the start of simulations and remains on average at least until May (Arctic) or November (Antarctic).
The interface between the snow and the emission model is provided by the
verti-20
cal profiles of snow temperature, density, grain size and wetness. The optical grain diameterdo provided by SNTHERM was recalculated into the exponential correlation
lengthpexfor usage in MEMLS according to Eq. (1), whereρsandρiare snow and ice
densities in kg m−3, respectively (Mätzler, 2002).
pex=F·do·
1−ρs·ρ−i1
(1)
25
TCD
7, 5711–5734, 2013Microwave emissivity variability of snow-covered sea ice
S. Willmes et al.
Title Page
Abstract Introduction
Conclusions References
Tables Figures
◭ ◮
◭ ◮
Back Close
Full Screen / Esc
Printer-friendly Version Interactive Discussion
Discussion
P
a
per
|
D
iscussion
P
a
per
|
Discussion
P
a
per
|
Discuss
ion
P
a
per
|
of a correlation length correction scheme for microwave modeling has recently been demonstrated by Langlois et al. (2012).
In many algorithms, microwave brightness temperatures are used in form of either a polarization ratio (PR, Eq. 1) or a gradient ratio (GR, Eq. 2) using different microwave polarizations and frequencies.
5
PR=(19 V−19 H)·(19 V+19 H)−1 (2)
GR=(37 V−19 V)·(37 V+19 V)−1 (3)
With these two parameters the observation of emissivity variations is enabled by elim-inating the contribution of the effective temperature variability. Here, we use PR and
10
GR, together with the microwave emissivities at different polarizations and frequencies to investigate their seasonal changes in context with the prevailing atmospheric forcing in different regions.
For a comparison with satellite data we use the DMSP SSM/I-SSMIS Daily Polar Gridded Brightness Temperatures dataset (Maslanik and Stroeve, 2004) provided by
15
the US National Snow and Ice Data Center (NSIDC). Sea Ice Concentrations from Nimbus-7 SMMR and DMSP SSM/I-SSMIS Passive Microwave Data product (Cavalieri et al., 1996) were used to create a subset of satellite microwave brightness tempera-tures at high sea-ice concentrations only.
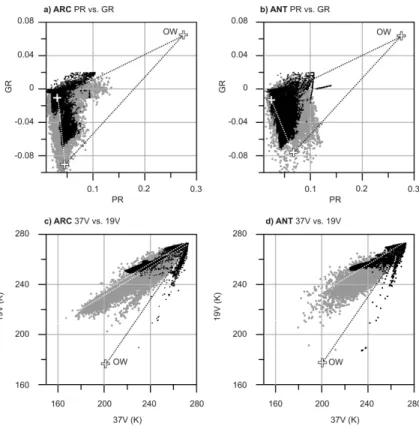
3 Results 20
The simulated brightness temperatures are shown in feature spaces of PR/GR (Fig. 2a and b) and of 37 V/19 V (Fig. 2c and d) for the Arctic and Antarctic, respec-tively. Data extracted from daily polar gridded satellite Tb (Maslanik and Stroeve, 2004) are shown by grey areas for all regions where the sea-ice concentration exceeds 90 %. The lines of 100 % sea-ice concentrations for the NasaTeam (Cavalieri et al., 1984,
25
TCD
7, 5711–5734, 2013Microwave emissivity variability of snow-covered sea ice
S. Willmes et al.
Title Page
Abstract Introduction
Conclusions References
Tables Figures
◭ ◮
◭ ◮
Back Close
Full Screen / Esc
Printer-friendly Version Interactive Discussion
Discussion
P
a
per
|
D
iscussion
P
a
per
|
Discussion
P
a
per
|
Discuss
ion
P
a
per
|
simulated data align well close to the 100 % sea-ice concentration lines revealing at the same time a distinct variability that is more pronounced in the Antarctic within both feature spaces. Especially during the last month of our simulation period (Arctic: June, Antarctic: December), the beginning effect of surface melt causes the position of the simulated snow profile to move towards the open water tie point. This is expressed by
5
elongated clusters pointing towards lower sea-ice concentrations mainly for the Arctic simulations.
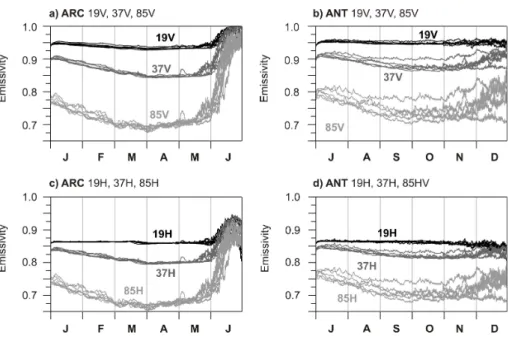
The microwave emissivities at 19, 37 and 85 GHz are characterized by a pronounced seasonal variability within the simulated period (Fig. 3). The seasonal cycle for all pre-sented frequencies and both polarizations is stronger in the Arctic with a substantial
10
increase occurring in the month of June (Fig. 3a and c). This emissivity increase is attributed to the onset of the advanced melt stage (Livingstone et al., 1997; Drobot and Anderson, 2001; Markus et al., 2009; Belchansky et al., 2004), when the presence of meltwater within the snow becomes persistent throughout the day. In the Antarctic (Fig. 3b and d) the regional differences in emissivities are more distinct than in the
15
Arctic. The advanced melt stage is found with much lower probability than in the Arctic (Willmes et al., 2006, 2009). The observed tendency towards higher emissivities in the Antarctic at the beginning of summer is rather an effect of averaging single profiles where temporally limited thaw events causing very high emissivities for the duration of melt are occurring at different points in time. The different melt process in the two
hemi-20
spheres are described by a study of Nicolaus et al. (2006). They show that the impact of melting and evaporation the snow cover decrease is very different between Arctic and Antarctic, e.g. the ratio of evaporated snow mass to melted snow mass per unit area amounts to approximately 4.2 in the Antarctic and only 0.75 in the Arctic, which certainly also impacts the evolution of microwave emissivities.
25
vari-TCD
7, 5711–5734, 2013Microwave emissivity variability of snow-covered sea ice
S. Willmes et al.
Title Page
Abstract Introduction
Conclusions References
Tables Figures
◭ ◮
◭ ◮
Back Close
Full Screen / Esc
Printer-friendly Version Interactive Discussion
Discussion
P
a
per
|
D
iscussion
P
a
per
|
Discussion
P
a
per
|
Discuss
ion
P
a
per
|
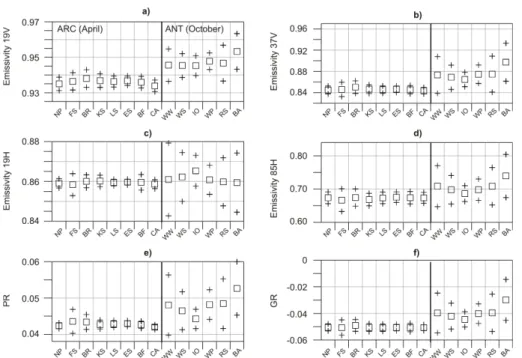
ations. In general, the Antarctic regions are affected by a larger range of emissivity values with a tendency towards higher mean emissivities than in the Arctic. The hemi-spheric contrast is even more pronounced in the PR and GR variabilities (Fig. 4e and f). While both, PR and GR variabilities are small in the Arctic, the Southern Ocean (ex-cept IO) shows significantly larger mean values and regional standard deviations in
5
both parameters.
This finding also holds for the other months of the pre-summer period (data not shown). Within hemispheres, the regional variability is weaker in the Arctic than in the Southern Ocean. The NP, FS, BR and KS regions reveal a stronger range of emissiv-ities than the other Arctic regions. At least for FS, BR and KS, the early occurrence
10
of short freeze-thaw events could explain this observation. In the Antarctic, the largest emissivity ranges are found in the Weddell Sea (WW, WS), Ross Sea (RS) and Belling-shausen/Amundsen Sea (BA). When melt processes start (June, December), the emis-sivity range per region is largest, since the high emissivities at times when melt started already are contrasting those when and where it did not. An exception is found in the
15
IO and WS regions where the emissivity variability stays close to the pre-melt period also in December (not shown).
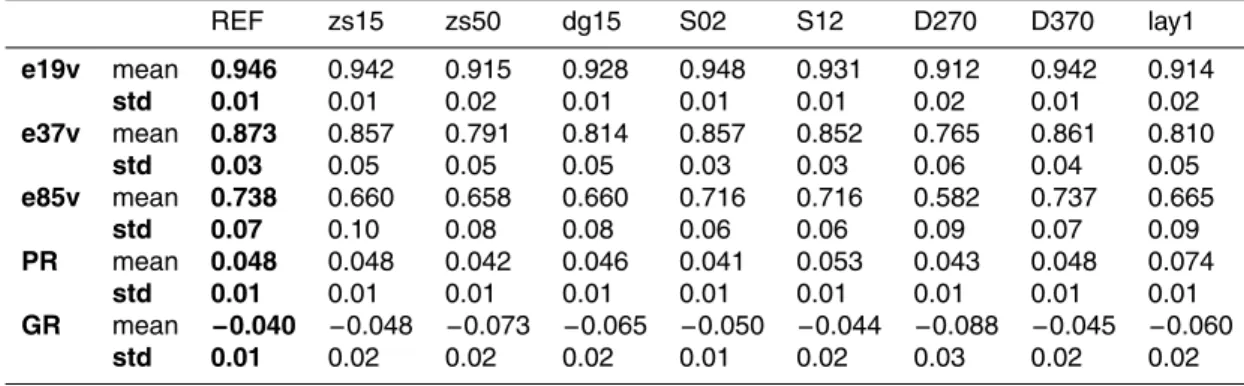
We here explicitly focus on the description of the regional and temporal variabil-ity of microwave emissivvariabil-ity (in terms of its standard deviation), rather than its mean. This is motivated by the fact that the mean emissivity is subject to an initialization
20
of SNTHERM simulations. We performed test runs with both models by varying the assumed sea ice salinity of 7 ppt (in MEMLS) by±5 ppt (S02, S12) as well as the
ini-tial snow profile (for SNTHERM) in grain size (+0.5 mm, dg15), thickness (15 cm and 50 cm, zs15, zs50) and density (±50 kg m−3, D270, D370); wetness is always zero at
start. Additionally, one test run was performed, where a thin ice layer was included
25
pe-TCD
7, 5711–5734, 2013Microwave emissivity variability of snow-covered sea ice
S. Willmes et al.
Title Page
Abstract Introduction
Conclusions References
Tables Figures
◭ ◮
◭ ◮
Back Close
Full Screen / Esc
Printer-friendly Version Interactive Discussion
Discussion
P
a
per
|
D
iscussion
P
a
per
|
Discussion
P
a
per
|
Discuss
ion
P
a
per
|
riod than 19 GHz, which is an effect of their limited penetration depth and the resulting larger impact of changes in the snow cover.
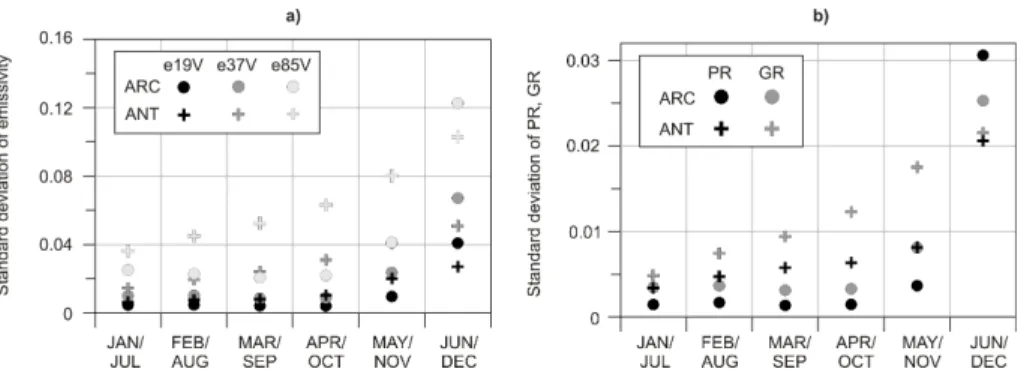
The average seasonal evolution of the microwave emissivity as well as of PR and GR in both hemispheres is subsumed in Fig. 5. The diurnal and regional emissivity variability increases from late winter to early summer for all frequencies in both
hemi-5
spheres while it is in general larger in the Antarctic throughout the season (Fig. 5a, crosses). The Arctic experiences the largest increase in emissivity variability from the months of May to June, when persistent melt initiates in some regions. The hemispheric contrast increases with frequency. Similar observations hold for the monthly values of PR and GR (Fig. 5b). Especially the GR variability during the pre-melt period is more
10
pronounced in the Antarctic. In comparison to Fig. 4 the presented values point out that the regional emissivity variability can deviate substantially from the average hemi-spheric variability. For example, the standard deviation of 37 V during October is 0.038 in the BA region and 0.018 in the WP region (compare Fig. 4b), while it is 0.029 when the entire Antarctic is considered. This finding is critical for the formulation of tie points
15
that are valid for an entire hemisphere and suggests to take regional specifications into account.
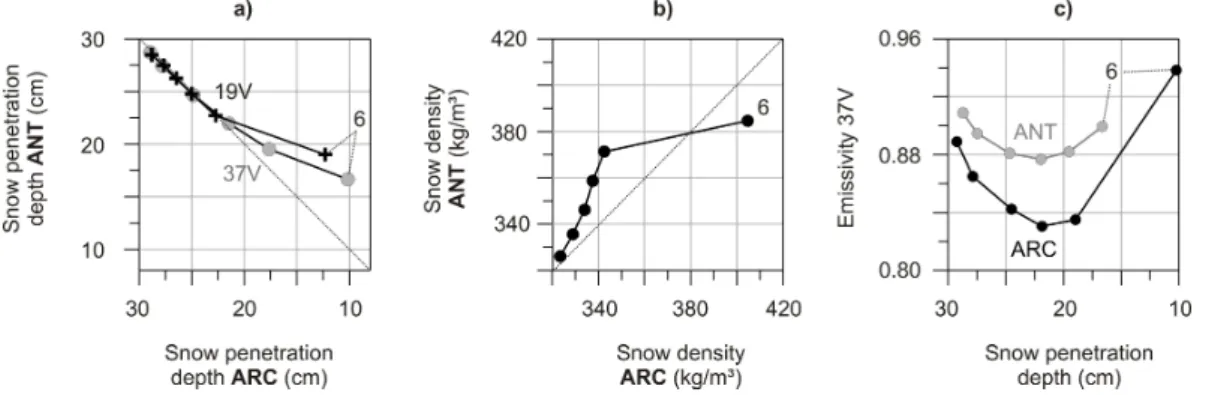
Some snow characteristics pointing towards an explanation of hemispheric diff er-ences in seasonal emissivity variability are indicated in Fig. 6. The mean monthly mi-crowave snow penetration depth is significantly lower in the Arctic during month 6 (5
20
and 6) for 19 V (37 V). Penetration into the ice is here considered 30 cm (equals maxi-mum snow thickness) penetration and hence no higher values are obtained. The rate of decrease in penetration depth is smaller for 19 V. This points out the stronger sen-sitivity of Tb values at 37 GHz to atmospheric variability and associated changes in the vertical snow profile. In the pre-melt period, the bulk snow density increases on
25
TCD
7, 5711–5734, 2013Microwave emissivity variability of snow-covered sea ice
S. Willmes et al.
Title Page
Abstract Introduction
Conclusions References
Tables Figures
◭ ◮
◭ ◮
Back Close
Full Screen / Esc
Printer-friendly Version Interactive Discussion
Discussion
P
a
per
|
D
iscussion
P
a
per
|
Discussion
P
a
per
|
Discuss
ion
P
a
per
|
that the processes that cause the penetration depth to cease throughout the season have a larger impact on the mean 37 V emissivity in the Arctic than in the Antarctic. As shown above, however, this does not hold for the emissivity variability, which is larger in the Antarctic.
Trends in emissivity were derived for both hemispheres and for all regions separately.
5
Our data revealed that significant trends (α=0.05) are found almost exclusively in the Weddell Sea (WS) region for all channels (except 19 H) in the months of November and December. Although being very small (0.01, 0.04 and 0.08 per decade in the month of December for 19 V, 37 V and 85 V, respectively) the 10 yr time series gives indication for a tendency towards larger emissivities that might be associated with increased melt
10
rates or earlier melt onset. Apart from the WS, very small but significant trends are only found for the FS region in February (19 V: 0.005 decade−1
, 37 V: 0.007 decade−1
) and for BF in June (85H: 0.04 decade−1).
4 Discussion and conclusions
It is well known that the accuracy of sea-ice concentration algorithms is estimated to
15
be on average not better than±5 % (Meier and Notz, 2010; Meier, 2005). With the data
presented here, algorithm accuracies for high-concentration sea ice can be determined with regional and seasonal reference. Sources of amibuigity for sea-ice concentration and snow depth retrieval are manifold and variations in emissivity just represent one problem next to spatial inhomogenity of surfaces, the presence of thin ice (Kwok et al.,
20
1997) and atmospheric disturbances (e.g. Cavalieri et al., 1995; Markus and Dokken, 2002; Spreen et al., 2008). We consider the presented emissivity variability represen-tative for the atmospherically induced variability found over high-concentration sea ice. Even if an algorithm implements monthly tie points to account for seasonal variations and weather effects (Markus and Cavalieri, 2000; Gloersen and Cavalieri, 1986), this
25
TCD
7, 5711–5734, 2013Microwave emissivity variability of snow-covered sea ice
S. Willmes et al.
Title Page
Abstract Introduction
Conclusions References
Tables Figures
◭ ◮
◭ ◮
Back Close
Full Screen / Esc
Printer-friendly Version Interactive Discussion
Discussion
P
a
per
|
D
iscussion
P
a
per
|
Discussion
P
a
per
|
Discuss
ion
P
a
per
|
Atmospheric effects could probably smooth the emissivity variability we present here. Nevertheless we consider our results as a seasonal background variability that needs to be taken into account even when weather filters are applied. An assessment of the contribution of different sources for varying brightness temperatures over high-concentration sea ice goes however beyond the scope of this paper. We did not include
5
the effect of flooding and snow ice formation and hence, the contribution of salty slush and gap layers that probably play an important role for microwave brightness temper-atures found over Antarctic sea ice as well (Massom et al., 2001; Haas et al., 2001; Nicolaus et al., 2009). We suggest the spatio-temporal emissivity impact of these pro-cesses to be quantified separately such that an assessment of combined ambiguities
10
and their regional characteristics is enabled.
A monthly and regionally determined microwave emissivity variability as presented in this study can help in determining optimized tie points for the definition of transfer functions from raw brightness temperature measurements to sea-ice surface proper-ties. In addition, the potential for an improved snow depth retrieval can be investigated
15
from the combined snow and microwave data.
The thermodynamic snow model SNTHERM and the microwave emission model for layered snowpacks (MEMLS) were used to identify the contribution of regional patterns in atmospheric energy fluxes to surface emissivity variations on Arctic and Antarctic sea ice between 2000 and 2009.
20
The microwave emissivities at 19, 37 and 85 GHz are characterized by a pronounced seasonal variability within the simulated period. The combined regional, diurnal and inter-annual emissivity variability increases from winter to early summer and Antarctic regions are affected by a larger range of emissivity values with a tendency towards higher mean emissivities than in the Arctic. In the pre-melt period, the variations in
25
TCD
7, 5711–5734, 2013Microwave emissivity variability of snow-covered sea ice
S. Willmes et al.
Title Page
Abstract Introduction
Conclusions References
Tables Figures
◭ ◮
◭ ◮
Back Close
Full Screen / Esc
Printer-friendly Version Interactive Discussion
Discussion
P
a
per
|
D
iscussion
P
a
per
|
Discussion
P
a
per
|
Discuss
ion
P
a
per
|
Significant emissivity trends are found in the Weddell Sea (WS) region for all chan-nels (except 19H) in November and December, which might be associated with in-creased melt rates or earlier melt onset.
The obtained emissivity data characterize the background emissivity variability of snow-covered first-year sea ice due to atmospheric forcing and lend themselves for
5
an assessment and improvement of sea-ice concentration and snow-depth algorithm accuracies.
Acknowledgements. This work was supported by the Deutsche Forschungsgemeinschaft (DFG) in the framework of the priority programme “Antarctic Research with comparative inves-tigations in Arctic ice areas” by a grant to WI 33114/-1 and WI 3314/-2. We are very grateful to 10
Rasmus T. Tonboe from the Danish Meteorological Institute who kindly provided his sea ice ver-sion of MEMLS. Sea-ice brightness temperatures and sea ice concentrations were provided by the US National Snow and Ice Data Center (NSIDC). The European Center for Medium Range Weather Forecast (ECMWF) offered ERA interim data free of charge. Leif Toudal Pedersen, Rasmus Tonboe and Günther Heinemann provided very valuable comments on this research. 15
References
Andersen, S., Tonboe, R., Kaleschke, L., Heygster, G., and Pedersen, L. T.: Intercomparison of passive micorwave sea ice concentration retrievals over the high-concentration Arctic sea ice, J. Geophys. Res., 112, C08004, doi:10.1029/2006JC003543, 2007.
Andreas, E. L. and Ackley, S. F.: On the differences in ablation seasons of Arctic and Antarctic 20
sea ice, J. Atmos. Sci., 389, 440–447, 1982.
Andreas, E. L., Jordan, R. E., and Makshtas, A. P.: Simulations of snow, ice and near-surface atmospheric processes on ice station Weddell, J. Hydrometeorol., 5, 611–624, 2004. Belchansky, G., Douglas, D. C., Mordvintsev, I., and Platonov, N.: Estimating the time of melt
onset and freeze onset over Arctic sea ice area using active and passive microwave data, 25
Remote Sens. Environ., 92, 21–39, 2004.
TCD
7, 5711–5734, 2013Microwave emissivity variability of snow-covered sea ice
S. Willmes et al.
Title Page
Abstract Introduction
Conclusions References
Tables Figures
◭ ◮
◭ ◮
Back Close
Full Screen / Esc
Printer-friendly Version Interactive Discussion
Discussion
P
a
per
|
D
iscussion
P
a
per
|
Discussion
P
a
per
|
Discuss
ion
P
a
per
|
Cavalieri, D. J.: A microwave technique for mapping thin ice, J. Geophys. Res., 99, 12561– 12572, 1994.
Cavalieri, D. J., Gloersen, P., and Campbell, W. J.: Determination of sea-ice parameters with the NIMBUS 7 scanning multichannel microwave radiometer, J. Geophys. Res., 89, 5355–5369, 1984.
5
Cavalieri, D. J., Burns, B. A., and Onstott, R. G.: Investigation of the effects of summer melt on the calculation of sea ice concentration using active and passive microwave data, J. Geo-phys. Res., 95, 5359–5369, 1990.
Cavalieri, D. J., St. Germain, K. M., and Swift, C. T.: Reduction of weather effects in the calcu-lation of sea-ice concentration with the DMSP SSM/I, J. Glaciol., 41, 455–464, 1995. 10
Cavalieri, D. J., Parkinson, C. L., Gloersen, P., and Zwally, H. J.: Sea Ice Concentrations from Nimbus-7 SMMR and DMSP SSM/I-SSMIS Passive Microwave Data, [2002–2009], National Snow and Ice Data Center, Boulder, Colorado USA, Digital media, updated yearly, 1996. Cavalieri, D. J., Parkinson, C. L., Gloersen, P., and Zwally, H. J.: Arctic and Antarctic Sea Ice
Concentrations from Multichannel Passive-microwave Satellite Data Sets: October 1978 to 15
December 1996, User’s Guide, NASA Technical Memorandum 104647, 17 pp., 1997. Comiso, J. C.: Characteristics of Arctic winter sea ice from satellite multispectral microwave
observations, J. Geophys. Res., 91, 975–994, 1986.
Comiso, J. C. and Kwok, R.: Surface and radiative characteristics of the summer Arctic sea ice cover from multisensory satellite observations, J. Geophys. Res., 101, 28397–28416, 1996. 20
Comiso, J. C. and Nishio, F.: Trends in the sea ice cover using enhanced and compatible AMSR-E, SSM/I, and SMMR data, J. Geophys. Res., 113, C02S07, doi:10.1029/2007JC004257, 2008.
Comiso, J. C., Cavalieri, D. J., Parkinson, C. L., and Gloersen, P.: Passive microwave algorithms for sea ice concentration: a comparison of two techniques, Remote Sens. Environ., 60, 357– 25
384, 1997.
Comiso, J. C., Cavalieri, D. J., and Markus, T.: Sea ice concentration, ice tempera-ture, and snow depth using AMSR-E data, IEEE T. Geosci. Remote, 41, 243–252, doi:10.1109/TGRS.2002.808317, 2003.
Dee, D. P. and 35 others: The ERA-Interim reanalysis: configuration and performance of the 30
TCD
7, 5711–5734, 2013Microwave emissivity variability of snow-covered sea ice
S. Willmes et al.
Title Page
Abstract Introduction
Conclusions References
Tables Figures
◭ ◮
◭ ◮
Back Close
Full Screen / Esc
Printer-friendly Version Interactive Discussion
Discussion
P
a
per
|
D
iscussion
P
a
per
|
Discussion
P
a
per
|
Discuss
ion
P
a
per
|
Drobot, S. D. and Anderson, M. R.: An improved method for determining snowmelt onset dates over Arctic sea ice using SMMR and SSM/I data, J. Geophys. Res., 106, 24033–24049, 2001.
Eppler, D., Farmer, L., Lohanick, A., Anderson, M., Cavalieri, D., Comiso, J., Gloersen, P., Gar-rity, C., Grenfell, T., Hallikainen, M., Maslanik, J., Mätzler, C., Melloh, R., Rubinstein, I., and 5
Swift, C.: Passive microwave signatures of sea ice, in: Microwave Remote Sensing of Sea Ice, edited by: Carsey, F. D., no. 68 in Geophysical Monograph, American Geophysical Union, 1992.
Garrity, C.: Characterization of snow on floating ice and case studies of brightness tempera-ture changes durig the onset of melt, in: Microwave Remote Sensing of Sea Ice, edited by: 10
Carsey, F. D., no. 68 in Geophysical Monograph, American Geophysical Union, 1992. Gloersen, P. and Cavalieri, D. J.: Reduction of weather effects in the calculation of sea ice
concentration from microwave radiances, J. Geophys. Res., 91, 3913–3919, 1986.
Gloersen, P., Campbell, W. J., Cavalieri, D. J., Comiso, J. C., Parkinson, C. L., and Zwally, H. J.: Arctic and Antarctic Sea Ice, 1978–1987: Satellite passive-microwave observations and anal-15
ysis, NASA Special Publications, 511, 290 pp., 1992.
Haas, C.: The seasonal cycle of ERS scatterometer signatures over perennial Antarctic sea ice and associated surface ice properties and processes, Ann. Glaciol., 33, 69–73, 2001. Haas, C., Thomas, D. N., and Bareiss, J.: Surface properties and processes of perennial
Antarc-tic sea ice in summer, J. Glaciol., 47, 613–625, 2001. 20
Jordan, R. E.: A one-dimensional temperature model for a snow cover, Special Report 91–16, US Army Corps of Eng. Cold Regions Research and Engineering Laboratory, Hanover, NH, 1991.
Jordan, R. E., Andreas, E. L., and Makshtas, A. P.: Heat budget of snow-covered sea ice at North Pole 4, J. Geophys. Res., 104, 7785–7806, 1999.
25
Kwok, R., Comiso, J. C., Martin, S., and Drucker, R.: Ross Sea polynyas: response of ice concentration retrievals to large areas of thin ice, J. Geophys. Res., 112, C12012, doi:10.1029/2006JC003967, 2007.
Langlois, A., Royer, A., Derksen, C., Montpetit, B., Dupoint, F., and Gota, K.: Coupling the snow thermodynamic model SNOWPACK with the microwave emission model of layered 30
TCD
7, 5711–5734, 2013Microwave emissivity variability of snow-covered sea ice
S. Willmes et al.
Title Page
Abstract Introduction
Conclusions References
Tables Figures
◭ ◮
◭ ◮
Back Close
Full Screen / Esc
Printer-friendly Version Interactive Discussion
Discussion
P
a
per
|
D
iscussion
P
a
per
|
Discussion
P
a
per
|
Discuss
ion
P
a
per
|
Livingstone, C. E., Onstott, R. G., Arsenault, L. D., Gray, A. L., and Singh, K. P.: Microwave sea-ice signatures near the onset of melt, IEEE T. Geosci. Rem., 25, 174–187, 1997. Lubin, D., Garrity, C., Ramseier, R. O., and Whritner, R. H.: Total sea ice concentration retrieval
from the SSM/I 85.5 GHz channels during the Arctic summer, Remote Sens. Environ., 62, 63–76, 1997.
5
Mätzler, C.: Relation between grain-size and correlation length of snow, J. Glaciol., 48, 461– 466, 2002.
Mätzler, C. and Wiesmann, A.: Extension of the microwave emission model of layered snow-packs to coarse-grained snow, Remote Sens. Environ., 70, 317–325, 1999
Markus, T. and Cavalieri, D. J.: Snow depth distribution over sea ice in the Southern Ocean 10
from satellite passive microwave data, Antarctic sea ice: physical processes, interactions, and variability, Antarct. Res. Ser., 74, 19–39, 1998.
Markus, T. and Cavalieri, D. J.: An enhancement of the NASA Team sea ice algorithm, IEEE T. Geosci. Rem., 38, 1387–1398, 2002.
Markus, T. and Dokken, S.: Evaluation of late summer passive microwave Arctic sea ice re-15
trievals, IEEE T. Geosci. Rem., 40, 348–356, 2000.
Markus, T., Powell, D. C., and Wang, J. R.: Sensitivity of passive microwave snow depth re-trievals to weather effects and snow evolution, IEEE T. Geosci. Rem., 44, 68–77, 2006. Markus, T., Stroeve, J. C., and Miller, J.: Recent changes in Arctic sea ice melt onset, freezeup,
and melt season length, J. Geophys. Res., 114, C12024, doi:10.1029/2009JC005436, 2009. 20
Maslanik, J. and Stroeve, J. C.: DMSP SSM/I-SSMIS Daily Polar Gridded Brightness Tem-peratures, Version 4, 2000–2009, NASA DAAC at the National Snow and Ice Data Center, Boulder, Colorado, USA, 2004, updated 2012.
Massom, R. A., Eicken, H., Haas, C., Jeffris, M. O., Drinkwater, M. R., Sturm, M., Worby, A. P., Wu, X., Lytle, V. I., Ushio, S., Morris, K., Reid, P. A., Warren, S. G., and Allison, I.: Snow on 25
Antarctic ice, Rev. Geophys., 39, 413–445, 2001.
Meier, W. and Notz, D.: A note on the accuracy and reliability of satellite-derived passive mi-crowave estimates of sea-ice extent, Climate and Cryosphere Sea Ice Working Group Con-sensus Document, World Climate Research Program, 2010.
Meier, W. N.: Comparison of passive microwave ice concentration algorithm retrievals with 30
TCD
7, 5711–5734, 2013Microwave emissivity variability of snow-covered sea ice
S. Willmes et al.
Title Page
Abstract Introduction
Conclusions References
Tables Figures
◭ ◮
◭ ◮
Back Close
Full Screen / Esc
Printer-friendly Version Interactive Discussion
Discussion
P
a
per
|
D
iscussion
P
a
per
|
Discussion
P
a
per
|
Discuss
ion
P
a
per
|
Nicolaus, M., Haas, C., Bareiss, J., and Willmes, S.: A model study of differences of snow thinning on Arctic and Antarctic first-year sea ice during spring and summery, Ann. Glaciol., 44, 147–153, 2006.
Nicolaus, M., Haas, C., and Willmes, S.: Evolution of first-year and second-year snow proper-ties on sea ice in the Weddell Sea during spring-summer transition, J. Geophys. Res., 114, 5
D17109, doi:10.1029/2008JD011227, 2009.
Spreen, G., Kaleschke, L., and Heygster, G.: Sea ice remote sensing using AMSR-E 89 GHz channels, J. Geophys. Res., 113, C02S03, doi:10.1029/2005JC003384, 2008.
Svendsen, E., Mätzler, C., and Grenfell, T. C.: A model for retrieving total sea ice concentration from a spaceborne dual-polarized passive microwave instrument operating near 90 GHz, 10
Int. J. Rem. Sens., 8, 1479–1487, 1987.
Tonboe, R. T.: The simulated sea ice thermal microwave emission at window and sounding frequencies, Tellus A, 62, 333–344, 2010.
Tonboe, R. T., Heygster, G., Pedersen, L. T., and Andersen, S.: Sea ice emission modelling, in: Thermal Microwave Radiation: Applications for Remote Sensing, edited by: Mätzler, C., IET 15
Electromagnetic Wave Series, 52, London, UK, 382–400, 2006.
Warren, S. G., Rigor, I. G., Untersteiner, N., Radionov, V. F., Bryazgin, N. N., Aleksandrov, V., and Colony, R.: Snow depth on Arctic sea ice, J. Climate, 12, 1814–1829, 1999.
Wiesmann, A. and Mätzler, C.: Microwave emission model of layered snowpacks, Remote Sens. Environ., 70, 307–316, 1999.
20
Willmes, S., Bareiss, J., Haas, C., and Nicolaus, M.: The importance of diurnal processes for the seasonal cycle of sea-ice microwave brightness temperatures during eraly summer in the Weddell Sea, Antarctica, Ann. Glaciol., 44, 297–302, 2006.
Willmes, S., Haas, C., Bareiss, J., and Nicolaus, M.: Satellite microwave observations of the interannual variability of snowmelt on sea ice in the Southern Ocean, J. Geophys. Res., 114, 25
TCD
7, 5711–5734, 2013Microwave emissivity variability of snow-covered sea ice
S. Willmes et al.
Title Page
Abstract Introduction
Conclusions References
Tables Figures
◭ ◮
◭ ◮
Back Close
Full Screen / Esc
Printer-friendly Version Interactive Discussion
Discussion
P
a
per
|
D
iscussion
P
a
per
|
Discussion
P
a
per
|
Discuss
ion
P
a
per
|
Table 1.Mean and standard deviation of emissivities at 19, 37 and 85 GHz (vertical
polariza-tion) for different SNTHERM initialization and MEMLS parameterization for region WS during October, derived from 4-times daily values, 2000–2009. REF: initialization profile used within this study, zs15: 15 cm snow depth, zs50: 50 cm snow depth, dg15: 1.5 mm grain size, S02: sea-ice salinity 2 ppt, S12: sea-ice salinity 12 ppt, D270: snow density 270 kg m−3, D370: snow density 370 kg m−3, lay1: an ice layer with 910 kg m−3density is included in the middle of the profile right from the start.
REF zs15 zs50 dg15 S02 S12 D270 D370 lay1
e19v mean 0.946 0.942 0.915 0.928 0.948 0.931 0.912 0.942 0.914
std 0.01 0.01 0.02 0.01 0.01 0.01 0.02 0.01 0.02
e37v mean 0.873 0.857 0.791 0.814 0.857 0.852 0.765 0.861 0.810
std 0.03 0.05 0.05 0.05 0.03 0.03 0.06 0.04 0.05
e85v mean 0.738 0.660 0.658 0.660 0.716 0.716 0.582 0.737 0.665
std 0.07 0.10 0.08 0.08 0.06 0.06 0.09 0.07 0.09
PR mean 0.048 0.048 0.042 0.046 0.041 0.053 0.043 0.048 0.074
std 0.01 0.01 0.01 0.01 0.01 0.01 0.01 0.01 0.01
GR mean −0.040 −0.048 −0.073 −0.065 −0.050 −0.044 −0.088 −0.045 −0.060
TCD
7, 5711–5734, 2013Microwave emissivity variability of snow-covered sea ice
S. Willmes et al.
Title Page
Abstract Introduction
Conclusions References
Tables Figures
◭ ◮
◭ ◮
Back Close
Full Screen / Esc
Printer-friendly Version Interactive Discussion
Discussion
P
a
per
|
D
iscussion
P
a
per
|
Discussion
P
a
per
|
Discuss
ion
P
a
per
|
Fig. 1.Maps of the Arctic(a)and Antarctic(b)showing the location of the regions referred to
TCD
7, 5711–5734, 2013Microwave emissivity variability of snow-covered sea ice
S. Willmes et al.
Title Page
Abstract Introduction
Conclusions References
Tables Figures
◭ ◮
◭ ◮
Back Close
Full Screen / Esc
Printer-friendly Version Interactive Discussion
Discussion
P
a
per
|
D
iscussion
P
a
per
|
Discussion
P
a
per
|
Discuss
ion
P
a
per
|
Fig. 2.Simulated brightness temperatures (black) in PR/GR feature space for the Arctic (a,
TCD
7, 5711–5734, 2013Microwave emissivity variability of snow-covered sea ice
S. Willmes et al.
Title Page
Abstract Introduction
Conclusions References
Tables Figures
◭ ◮
◭ ◮
Back Close
Full Screen / Esc
Printer-friendly Version Interactive Discussion
Discussion
P
a
per
|
D
iscussion
P
a
per
|
Discussion
P
a
per
|
Discuss
ion
P
a
per
|
Fig. 3.The seasonal evolution of 19 GHz, 37 GHz and 85 GHz emissivities at vertical (aandb)
TCD
7, 5711–5734, 2013Microwave emissivity variability of snow-covered sea ice
S. Willmes et al.
Title Page
Abstract Introduction
Conclusions References
Tables Figures
◭ ◮
◭ ◮
Back Close
Full Screen / Esc
Printer-friendly Version Interactive Discussion
Discussion
P
a
per
|
D
iscussion
P
a
per
|
Discussion
P
a
per
|
Discuss
ion
P
a
per
|
Fig. 4. Mean (squares) and standard deviation (crosses) of emissivity values indicating the
daily, spatial and interannual variability of emissivity values in the 4th month of simulation (ARC: April, ANT: October) for emissivities at (a) 19 V, (b) 37 V, (c) 19 H, (d) 85 H as well as (e)
TCD
7, 5711–5734, 2013Microwave emissivity variability of snow-covered sea ice
S. Willmes et al.
Title Page
Abstract Introduction
Conclusions References
Tables Figures
◭ ◮
◭ ◮
Back Close
Full Screen / Esc
Printer-friendly Version Interactive Discussion
Discussion
P
a
per
|
D
iscussion
P
a
per
|
Discussion
P
a
per
|
Discuss
ion
P
a
per
|
Fig. 5.Seasonal evolution of monthly standard deviations of (a)emissivities at 19 (black), 37
TCD
7, 5711–5734, 2013Microwave emissivity variability of snow-covered sea ice
S. Willmes et al.
Title Page
Abstract Introduction
Conclusions References
Tables Figures
◭ ◮
◭ ◮
Back Close
Full Screen / Esc
Printer-friendly Version Interactive Discussion
Discussion
P
a
per
|
D
iscussion
P
a
per
|
Discussion
P
a
per
|
Discuss
ion
P
a
per
|
Fig. 6. (a)Monthly average snow penetration depth, Arctic vs. Antarctic for 19 V (black) and