www.hydrol-earth-syst-sci.net/16/4543/2012/ doi:10.5194/hess-16-4543-2012
© Author(s) 2012. CC Attribution 3.0 License.
Earth System
Sciences
Ice volume distribution and implications on runoff projections in a
glacierized catchment
J. Gabbi1, D. Farinotti1, A. Bauder1, and H. Maurer2
1Laboratory of Hydraulics, Hydrology and Glaciology (VAW), ETH Zurich, Gloriastrasse 37/39, 8092 Zurich, Switzerland 2Institute of Geophysics, ETH Zurich, Sonneggstrasse 5, 8092 Zurich, Switzerland
Correspondence to:J. Gabbi ([email protected])
Received: 15 May 2012 – Published in Hydrol. Earth Syst. Sci. Discuss.: 13 June 2012 Revised: 29 October 2012 – Accepted: 6 November 2012 – Published: 3 December 2012
Abstract. A dense network of helicopter-based
ground-penetrating radar (GPR) measurements was used to deter-mine the ice-thickness distribution in the Mauvoisin region. The comprehensive set of ice-thickness measurements was combined with an ice-thickness estimation approach for an accurate determination of the bedrock. A total ice volume of 3.69±0.31 km3and a maximum ice thickness of 290 m were found. The ice-thickness values were then employed as input for a combined glacio-hydrological model forced by most re-cent regional climate scenarios. This model provided glacier evolution and runoff projections for the period 2010–2100. Runoff projections of the measured initial ice volume distri-bution show an increase in annual runoff of 4 % in the next two decades, followed by a persistent runoff decrease until 2100. Finally, we checked the influence of the ice-thickness distribution on runoff projections. Our analyses revealed that reliable estimates of the ice volume are essential for mod-elling future glacier and runoff evolution. Wrong estimations of the total ice volume might even lead to deviations of the predicted general runoff trend.
1 Introduction
The demand for renewable energy is rising, especially when considering the declining confidence in nuclear power and the ascending greenhouse gas emissions (Bundesamt f¨ur En-ergie, 2011a). Particularly in alpine regions with sufficient amounts of precipitation, hydropower is one of the most efficient and appropriate energy sources (Bundesamt f¨ur Energie, 2011b). In many high-mountain basins the water supply to hydropower reservoirs primarily consists of melt
providing considerable amounts of water even in summer, when precipitation events are rare (Verbunt et al., 2003; Hock et al., 2005). Glaciers act as large freshwater reservoirs accu-mulating snow during the cold season and releasing the wa-ter accumulated as snow and ice during summer. This leads to sustainable differences in the runoff regime of glacier-ized basins compared to non-glacierglacier-ized ones (e.g. Chen and Ohmura, 1990). However, the projected climate change and the associated glacier retreat entail the potential risk of se-rious diminution of the glacial induced water supply (Braun et al., 2000; Huss et al., 2008b; Farinotti et al., 2012).
In recent years, different studies examined the impact of climate change on runoff projections for high-alpine basins (Braun et al., 2000; Verbunt et al., 2003; Horton et al., 2006; Schaefli et al., 2007; Huss et al., 2008b; Farinotti et al., 2012; Uhlmann et al., 2012). Highly glacierized catchments re-quire appropriate modelling of glacial processes including mass balance modelling (Klok and Oerlemans, 2002; Pel-licciotti et al., 2005; Huss et al., 2008b) and adaptation of the glacier surface geometry (Vieli et al., 1997; Schneeberger et al., 2003; Huss et al., 2010; Jouvet et al., 2011). The initial ice volume distribution forms the basis for the determination of the glacier and runoff evolution of glacierized catchments. In order to deal with difficulties arising from the scarce or no data availability of the glacier bed, ice-thickness estimation approaches (e.g. Farinotti et al., 2009b; Fischer, 2009; Paul and Linsbauer, 2012) have been developed.
(GPR) measurements served as data basis for the determina-tion of the ice-thickness distribudetermina-tion. The ice-thickness mea-surements were combined with an ice-thickness estimation approach in order to determine the glacier bed topography in the study area as accurately as possible (Sect. 3). Integrat-ing the newly acquired knowledge about the ice volume dis-tribution, the Glacier Evolution and Runoff Model (GERM, Huss et al., 2008b; Farinotti et al., 2012) forced by most re-cent climate scenarios (Bosshard et al., 2011) was applied to derive glacier evolution and runoff projections until 2100 for the region (Sect. 4). The model approach and the sensi-tivity of the model parameters have been tested in the study of Farinotti et al. (2012). In the scope of this study, the im-pact of uncertain ice-thickness estimations, due to a lack of ice-thickness measurements or the usage of inappropriate ice-thickness estimation methods, on runoff projections was analysed (Sect. 5). Uniform ice-thickness distribution, com-monly used in macro-scale hydrological models, and more sophisticated results obtained from an ice-thickness estima-tion method (Farinotti et al., 2009b) deriving the distribuestima-tion according to the surface topography were considered. Fur-thermore, the effect of over- or underestimation of the total ice volume was investigated. The main part of the article is divided in three separate sections about (1) the ice-thickness distribution, (2) the glacio-hydrological modelling, and (3) the ice volume sensitivity analysis whereby each section con-tains the corresponding methods and results.
2 Study site and data
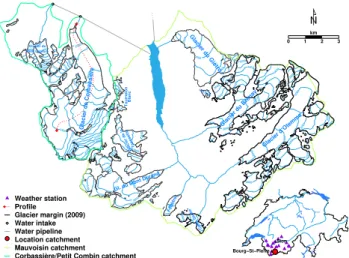
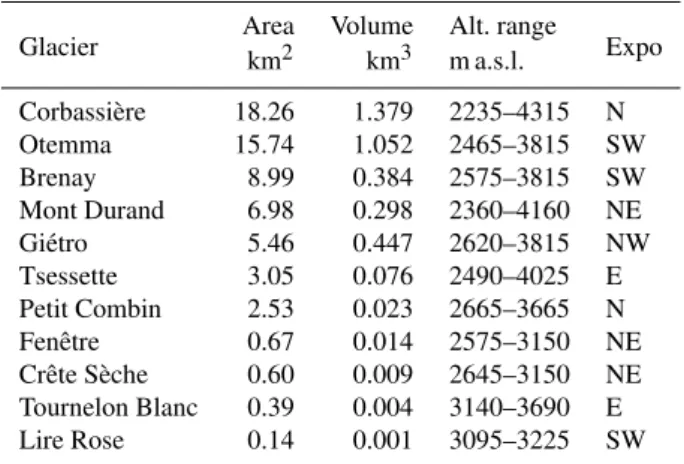
The Mauvoisin area is situated in the south-western part of the Valais Alps, Switzerland (Fig. 1). The catchment extends over an area of 150 km2, with 63 km2 covered by glaciers in 2009, accommodating five larger glaciers (5–18 km2) and several smaller glaciers (<5 km2). Due to the northwest ori-entation of the valley axis, the glaciers show exposures from southwest via north to east. They range in altitude from 2200 to 4300 m a.s.l. (Table 1).
The climate in the Mauvoisin region is characterized by mean precipitation amounts of about 1600 mm a−1 and a mean annual temperature of−3.5◦
C.
The transient modelling of glacier and runoff evolution in the past and future requires a wide range of different data sets. Past temperature and precipitation time series as well as projections for the future climate are used to force the model (see Sect. 4.1.1). Direct mass balance measurements, decadal ice volume changes derived from topographic maps and areal photographs as well as runoff measurements are used for model calibration (Table 2). Due to long-term ef-forts, annual mass balance measurements are available since 1966 for Glacier du Gi´etro and since 1996 for Glacier de Corbassi`ere (Bauder, 2003; Bauder et al., 2007). Digital el-evation models (DEMs) of the glacier surface are available for the years 1934, 1983 and 2009 for all glaciers in the
5.85
×
105 5.90×10⁵ 5.95×10⁵ 6.00×10⁵ 3000 3400 2800 3400 2600 3000 3200 3400 2800 3000 3000 3000 3000 3200 3000 2800 3000 3000 3000 3200 3400 2800 3200 3400 3600 3400 3600 3400 3200 3000 3200 3000 2600 2800 2600 3400 3600 3400 3300 3300 3500 3300 3100 2900 2500 3500 3500 3300 3100 3100 2900 2700 3100 3700 3700 3900 4100
0 1 2 3
km
Glacier de Corbassière
Glacier d‘Otemma Glacier du Brenay Glacier du Giétro
Gl. du Mont Durand
Glacier de la Tsessette
Fenêtre Glacier du Petit Combin Crête Sèche TournelonBlanc Lire Rose Weather station Profile Glacier margin (2009) Water intake Water pipeline Location catchment Mauvoisin catchment
Corbassière/Petit Combin catchment
Sion
Bourg−St−Pierre
Fig. 1.Overview of the Mauvoisin region. The inset on the bottom
right shows the location of the catchment within Switzerland and the weather stations used in this study. The red dashed line refers to the profile of Fig. 11.
catchment. Additional DEMs of the years 1997/1998 and 2003 exist for Glacier de Corbassi`ere and Glacier du Gi´etro. DEMs of the year 1934 are based on topographic maps, whereas the others are derived by photogrammetrical anal-ysis of areal photographs. An overview on the used data sets is shown in Table 2.
Hydrometric data are available from the hydropower com-pany Mauvoisin since 1982. The data include water level variations of the Mauvoisin reservoir, its outflow and the in-put of the water conducting pipelines on the left- and right-hand side (Fig. 1). Inflow and lake level measurements have monthly resolution for the period 1982 to 2000 and daily res-olution since 2000. According to the available runoff data, we divided the basin into two sub-catchments: theMauvoisin catchment, which corresponds to the natural catchment of the reservoir, and theCorbassi`ere/Petit Combin catchment, which represents the area in the west including Glacier de Corbassi`ere and Glacier du Petit Combin (Fig. 1). The runoff time series of the Mauvoisin catchment were generated by subtracting the inflow from the two pipelines and the outflow of the reservoir from the lake level changes.
3 Ice-thickness distribution
3.1 GPR measurements
Table 1.Area, ice volume, altitudinal range and main exposition of the glaciers in the Mauvoisin region. Data refer to 2009.
Glacier Area Volume Alt. range Expo
km2 km3 m a.s.l.
Corbassi`ere 18.26 1.379 2235–4315 N
Otemma 15.74 1.052 2465–3815 SW
Brenay 8.99 0.384 2575–3815 SW
Mont Durand 6.98 0.298 2360–4160 NE
Gi´etro 5.46 0.447 2620–3815 NW
Tsessette 3.05 0.076 2490–4025 E
Petit Combin 2.53 0.023 2665–3665 N
Fenˆetre 0.67 0.014 2575–3150 NE
Crˆete S`eche 0.60 0.009 2645–3150 NE
Tournelon Blanc 0.39 0.004 3140–3690 E
Lire Rose 0.14 0.001 3095–3225 SW
Germany). They employed an acquisition unit operating in a gated stepped mode using frequencies between 50 and 150 MHz (Radar Systemtechnik GmbH, 2012). Additionally, ground-based GPR measurements from previous field cam-paigns of the years 1988/1998 and 1997 on Glacier de Cor-bassi`ere and Glacier du Gi´etro, respectively, were included (Fig. 2, VAW 1998).
3.1.1 GPR processing
Visualization of the bedrock topography in the GPR sec-tions required several processing steps to be applied. The helicopter-borne GPR data were acquired more or less con-tinuously during the flights. In a first step, the positions of the GPR signals of the different traces were projected on straight profiles which is required for the further processing of the GPR data. In order to remove the inherent system ring-ing of GPR acquisition systems, a sring-ingular value decompo-sition based on multichannel filters has been performed. In a next step, a bandpass filter was applied, which removed sig-nal portions outside of the frequency band radiated by the GPR transmitter antenna. Then, the reflected signals from the glacier surface had to be identified in the GPR sections, which allowed static corrections to be applied. A further criti-cal processing step included application of gain functions for enhancing small amplitudes at later times in the radargrams (e.g. bedrock reflections). The signal-to-noise ratio was fur-ther improved by defining discrete bins along the profiles and stacking the traces contained in each bin. Finally, a Kirch-hoff migration was applied for removing artefacts produced by point scatterers (e.g. large boulders) and to correctly posi-tion the reflectors in the individual secposi-tions. Figure 3 shows a finally processed section across the Glacier d’Otemma. The bedrock reflection is clearly visible and reaches its maximum depth of about 250 m at a horizontal distance of 550 m.
Fig. 2.Ice-thickness distribution in the Mauvoisin region derived
by all available ice-thickness measurements. Glacier outlines refer to 2009. The grey lines show the recorded helicopter-based GPR profiles, the green lines the finally evaluated profiles and the red lines the ground-based GPR profiles from previous field campaigns. The red dot refers to the GPR section shown in Fig. 3.
3.1.2 Uncertainties of GPR measurements
Uncertainties of the ice-thickness measurements originate from different sources of error. The main uncertainty arises due to blurry reflection horizons. Always the upper boundary of the reflection band was picked. By the identification of the bed reflections, care was taken to ensure that no sharp edges of the bed topography result. The uncertainty of this source of error can be assigned to±5 m on average. In isolated ar-eas uncertainties of up to±15 m can occur due to blurry re-flection. Another source of error are uncertainties about the propagation velocity of the electromagnetic wave. The veloc-ity is well known, and therefore the effect on the uncertainty of the ice thickness is negligible small. Further uncertain-ties are introduced by the projection of the GPR signals on two-dimensional profile sections. The uncertainties associ-ated with this kind of error are spatially highly variable and are difficult to quantify. Hence, this error was not included in the uncertainty analysis. According to these considerations, an overall uncertainty of±5 m was determined for the GPR measurements.
3050
3000
2800
2750
A
ltitude (m asl)
Distance [m]
100 200 300 400 500 600 700 800 900 1000 1100
2900 2950
2850
Fig. 3.Processed GPR section across Glacier d’Otemma. Its
posi-tion is indicated in Fig. 2.
Table 2.Availability of different data sets used for this study: mass
balance measurements (MB), DEMs, and the length of GPR pro-files. Numbers in brackets indicate the fraction of ground-based GPR profiles from the total length of helicopter- and ground-based GPR profiles for each glacier.
MB DEMs GPR
Corbassi`ere 1996–2009 1934, 1985, 1997, 34 (9) km
2003, 2009
Gi´etro 1966–2009 1934, 1983, 1998, 17 (6) km
2003, 2009
Brenay – 1934, 1983, 2009 8 km
Otemma – 1934, 1983, 2009 15 km
M. Durand – 1934, 1983, 2009 8 km
small gl. – 1934, 1983, 2009 –
3.2 Ice-thickness estimation
Since the GPR profiles covered only a relatively small por-tion of the glacierized area, an extrapolapor-tion procedure was required for obtaining estimates over the entire area of inter-est. The literature describes different ice-thickness estima-tion approaches of various complexity (e.g. Farinotti et al., 2009b; Fischer, 2009; Paul and Linsbauer, 2012). All of them combine ice flow mechanics with the information about the surface topography for estimating the depth of the glacier bed.
In this study we applied the ice-thickness estimation method (ITEM) of Farinotti et al. (2009b). ITEM derives the ice-thickness distribution by calculating the ice flow and en-suring mass continuity. Two gradients for the so-called ap-parent mass balance (i.e. the difference between the actual mass balance and the rate of ice-thickness change), one for the ablation and one for the accumulation zone, have to be assumed. The ice thickness is derived from inverting Glen’s flow law (Glen, 1955). A correction factorc accounts for the valley shape, basal sliding and uncertainties in the cho-sen flow parameters. This factor has to be calibrated by ice-thickness measurements in order to maximize agreement be-tween GPR measurements and calculated bedrock or has to be estimated from other glaciers.
0 200 400 600
Distance (m) 2300
2350 2400 2450
Altitude (m asl) helicopter based
ground based
0 200 400 600
Distance (m) 2400
2450 2500 2550
Altitude (m asl) helicopter based
ground based
0 200 400 600 800 1000
Distance (m) 2450
2500 2550 2600 2650
Altitude (m asl) helicopter based
ground based
0 200 400 600 800 1000
Distance (m) 2450
2500 2550 2600 2650
Altitude (m asl) helicopter based
ground based
Fig. 4.Comparison of ground-based and helicopter-based GPR
pro-files. Four GPR profiles of the lower part of Glacier de Corbassi`ere were selected.
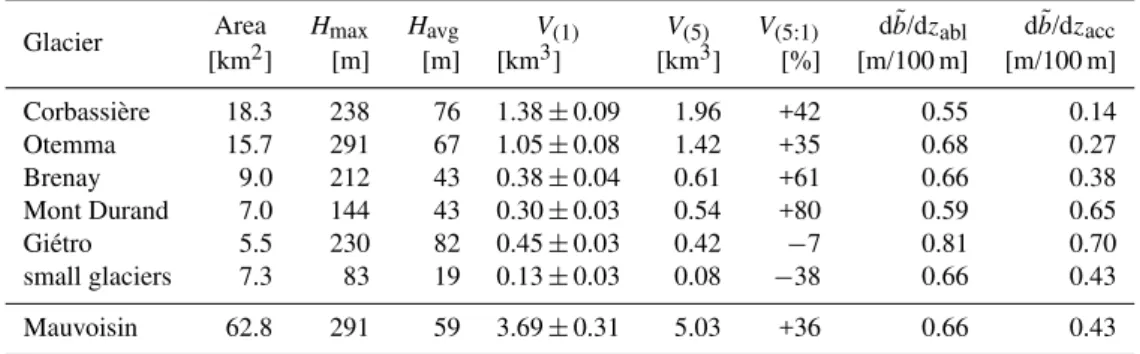
We have used our GPR measurements to identify suitable correction factors for each profile. In between the profiles, the correction factors were linearly interpolated. On glaciers, where no GPR data were available, a mean correction fac-tor was used. Gradients of the apparent mass balance were derived by the results of the mass balance model and the ob-served ice-thickness changes (Table 3).
Table 3.Area, maximal (Hmax) and mean (Havg) ice thickness, ice volume of (1) (V(1)) and standard deviation, ice volume of (5) (V(5)), the
relative ice volume difference betweenV(1)andV(5)(V(5:1)), and the calibrated apparent mass balance gradients for the ablation (db˜/dzabl)
and accumulation zone (db˜/dzacc) of the Mauvoisin region.
Glacier Area Hmax Havg V(1) V(5) V(5:1) db˜/dzabl db˜/dzacc
[km2] [m] [m] [km3] [km3] [%] [m/100 m] [m/100 m]
Corbassi`ere 18.3 238 76 1.38±0.09 1.96 +42 0.55 0.14
Otemma 15.7 291 67 1.05±0.08 1.42 +35 0.68 0.27
Brenay 9.0 212 43 0.38±0.04 0.61 +61 0.66 0.38
Mont Durand 7.0 144 43 0.30±0.03 0.54 +80 0.59 0.65
Gi´etro 5.5 230 82 0.45±0.03 0.42 −7 0.81 0.70
small glaciers 7.3 83 19 0.13±0.03 0.08 −38 0.66 0.43
Mauvoisin 62.8 291 59 3.69±0.31 5.03 +36 0.66 0.43
3.3 Results
Based on all available ice-thickness measurements, a total ice volume of 3.69±0.31 km3was determined for the Mau-voisin region for the year 2009 (Table 3). Glacier de Cor-bassi`ere is the largest glacier in the area with an ice vol-ume of 1.38±0.09 km3. Glacier d’Otemma shows a slightly smaller ice volume of 1.05±0.08 km3. The three other larger glaciers, Glacier du Brenay, Glacier du Mont Durand, and Glacier du Gi´etro, have clearly lower ice volumes rang-ing between 0.30±0.03 and 0.45±0.03 km3. All smaller glaciers together account for 0.13±0.03 km3corresponding to approximately 4 % of the total ice volume. The largest ice thickness (291 m) was found on Glacier d’Otemma (Ta-ble 3, Fig. 2). The maximum ice thickness of Glacier de Cor-bassi`ere is 238 m. Glacier du Brenay and Glacier du Gi´etro have maximal ice thicknesses of around 220 m. In compar-ison, Glacier du Mont Durand shows a lower maximal ice thickness of 144 m.
4 Glacier evolution and runoff modelling
4.1 Glacio-hydrological model
For glacier and runoff projections, the glacio-hydrological model GERM was applied (Huss et al., 2008b; Farinotti et al., 2012). The model is fully distributed and consists of five different modules dealing with accumulation and ab-lation processes, glacier evolution, evaporation and runoff routing. The model was run on a daily basis for the time pe-riod 1900 to 2100 with a spatial resolution of 50 m and 25 m for the Mauvoisin and the Corbassi`ere/Petit Combin ment, respectively. Model and applications to alpine catch-ments are described by Huss et al. (2008b) and Farinotti et al. (2012) in more detail.
The mass balance model is based on a temperature-index melt model according to the approach by Hock (1999). It calculates the melt on a linear relationship between ablation and air temperature and includes the effect of potential solar
radiation, thus accounting for the variability in slope, aspect and topographic shading. The local melt rateMis calculated in daily resolution by
M=
(FM+rice/snowI )T : T >0◦C
0 : T ≤0◦C (1)
whereFM is the melt factor, rice/snow the radiation factors
for ice and snow, respectively,Ithe potential solar radiation, andT the mean daily air temperature. Below 0◦C no melting occurs. The accumulation model interpolates the amount of precipitation at the reference location to any location in the catchment on the basis of a calibrated precipitation gradient dP/dzand a precipitation correction factorcprec. Linear
tran-sition within a temperature range of 0.5–2.5◦C is used in or-der to distinguish between snow and rainfall. Further, a spa-tially dependent snow distribution factor, which is constant over time, is implemented and accounts for snow transport processes through wind or gravity (e.g. avalanches).
Glacier surface is updated according to the so-called dh-parameterisation(Huss et al., 2010). This method relies on the fact that ice thickness changes across a longitudinal pro-file of a glacier show a typical pattern which is approximately constant over time (J´ohannesson et al., 1989). In the param-eterisation, the annual ice volume change computed by the mass balance model is distributed over the glacier surface according to a predefined pattern. Thereby, the pattern is ob-tained analysing historic glacier changes in the region of in-terest.
directly to runoff. The total runoff is computed by adding the discharge of the slow, the fast and the direct runoff from the snow reservoir. The water loss of the interception reservoir is only controlled by evaporation. The individual reservoirs act as so-calledlinear reservoirswhere the runoff volume is proportional to the actual filling level of the reservoir. The model distinguishes between five different surface types: ice, snow, rock, low (meadow) and high vegetation (forest). The size of the reservoirs and the corresponding retention con-stant are dependent on the surface type. For further details on the GERM model, refer to Farinotti et al. (2012).
4.1.1 Model forcing
The model is forced with continuous temperature and pre-cipitation time series (1900–2100) with daily evolution. In order to reconstruct the past climate conditions (1900–2009) in the Mauvoisin area, regional temperature and precipita-tion data from weather staprecipita-tions in the vicinity of the study site are taken into account. Monthly temperature values be-tween 1900 and 2009 were obtained by inverse-distance weighting of the homogenized climate time series of 12 dif-ferent weather stations maintained by MeteoSwiss (Begert et al., 2005). In order to get temperature time series with daily resolution, daily fluctuations of the weather station in Sion were superimposed on the monthly values. Temperature lapse rates were computed by using data of weather stations closer than 50 km to the study area (Fig. 1). The homoge-nized temperature time series were shifted to the mean alti-tude of the investigated catchment by using the temperature lapse rate. For precipitation, the time series of the weather station of Bourg-St-Pierre were chosen due to the vicinity to the study site and the long record reaching back to 1900. These daily precipitation time series were scaled in order to match the monthly precipitation values given by the PRISM data set (Schwarb et al., 2001). The data set provides mean monthly precipitation sums for the Swiss Alps on a grid with 2 km resolution and the period 1971–1990. Precipita-tion lapse rate is determined during the calibraPrecipita-tion procedure by using the mass balance data. Temperature and precipita-tion lapse rate were kept constant over time. For further in-formation about the generation of the climate time series of the past, see Huss et al. (2008a).
Future climate time series (2010–2100) of the Mauvoisin region are based on scenarios developed in the framework of the European ENSEMBLES project (van der Linden and Mitchell, 2009). Regional climate scenarios of 10 dif-ferent model chains (combination between general circula-tion models and regional climate models) based on emis-sion scenario SRES A1B (IPCC, 2000) were used. The data were obtained from the Center for Climate Systems Mod-eling (C2SM) providing daily temperature and precipitation changes for two periods in the future (2021–2050; 2070– 2099) in comparison to a period in the past (1980–2009) (CH2011, 2011; Bosshard et al., 2011).
In order to meet the model requirements of continuous cli-mate time series, the changes in temperature and precipita-tion between the different periods are assigned to the middle of each period and are linearly interpolated in between. An interannual variability is introduced by superimposing daily fluctuations of the past on the interpolated time series. We followed the approach of Farinotti et al. (2012) and gener-ated 10 different meteorological time series for each of the ten considered model chains. This results in 100 different time series of daily temperature and precipitation by which the model can be forced and allows to estimate a possible bandwidth for the climate evolution.
According to the climate projections provided by C2SM, the temperature in the Mauvoisin region (weather station at 1840 m a.s.l.) will increase by about 1.2±0.44◦C on average until 2021–2050 and by about 3.4±0.63◦C until 2070–2099 compared to the reference period. Mean precipitation will increase by about 1.4±2.4 % until the first period, but de-creases by about−2.8±3.8 % until the second period. These average changes in temperature and precipitation are not uni-formly distributed over the year. Temperature is projected to increase most during summer and precipitation most in spring and autumn.
4.1.2 Calibration
The calibration of the model parameters was performed by an automated multi-layer iterative procedure as described in Huss et al. (2008b) and Farinotti et al. (2012). In addi-tion to hydrometric data, glacier volume changes and direct mass balance measurements were incorporated in the cali-bration procedure, which strongly reduce the uncertainties of the model parameters (Jost et al., 2012; Stahl et al., 2008). Optimum calibration is essential in order to ensure reliable glacier and runoff projections. Inappropriate parameter esti-mation or changes in parameter values in the future may lead to deviations from the predicted glacier and runoff evolution (see Discussion).
In a first step, the parameters of the melt and the ac-cumulation module (FM, rice/snow, cprec, dP/dz) were
Table 4.Overview of the calibrated parameter sets of the melt, accumulation and runoff model shown for the two subcatchments Mauvoisin (Mauv) and Corbassi`ere/Petit Combin (Corb). The retention constants for the fast reservoir and the maximal capacity of the slow and the fast reservoir depend on the surface type (ice, snow, rock, low and high vegetation, open water).
Parameter Explanation Unit Mauv Corb
Melt model:
FM Melt factor [10−4m h−1◦C−1] 1.169 1.016
rice Radiation factor for ice [10−6m3W−1◦C−1] 0.780 0.677
rsnow Radiation factor for snow [10−6m3W−1◦C−1] 0.390 0.231
dT/dz Temperature gradient [◦C m−1] −0.0053 −0.0053
Accumulation model:
dP/dz Precipitation lapse rate [%m−1] 0.15 0.05
Cprec Precipitation correction factor [–] 30.0 −10.0
Runoff model:
kfast Retention constant fast reservoir [d] 2–30 2–30
kslow Retention constant slow reservoir [d] 50 50
ksnow Retention constant snow reservoir [d] 5 5
Vslow,max Max. capacity slow reservoir [mm] 200–5000 200–5000
Vint,max Max. capacity interception reservoir [mm] 0–2.5 0–2.5
1983–2009 and vice versa. The Nash-Sutcliffe criterion of the monthly runoff values is 0.93 and 0.94 for the Mauvoisin and the Corbassi`ere/Petit Combin catchment, respectively, and of the daily runoff values 0.86 and 0.87, respectively. The bias between the modelled and the measured annual runoff is on average +1.2 mio m3a−1(+0.6 % or +10.5 mm a−1) and
−0.5 mio m3a−1 (−0.9 % or −14.5 mm a−1) for the Mau-voisin and the Corbassi`ere/Petit Combin catchment, respec-tively. The parameters of the evaporation module are adopted from Huss et al. (2008b) and Farinotti et al. (2012).
4.2 Results
4.2.1 Glacier evolution
Since the beginning of the 20th century, the glaciers in the Mauvoisin region have been in retreat. Between 1900 and 2009 the initial ice volume has decreased by 43 %, from 6.49 km3to 3.69 km3. Almost half of this ice volume loss oc-curred during the past 30 yr. Hence, the retreat rate has nearly doubled since the beginning of the 1980s (Fig. 5). Similar mass balance rates could be also observed between 1943 and 1954. Only a short period of mass gain was observed be-tween 1978 and 1983, when the ice volume increased by about 192 mio m3 corresponding to an increase of 3.6 % in total ice mass.
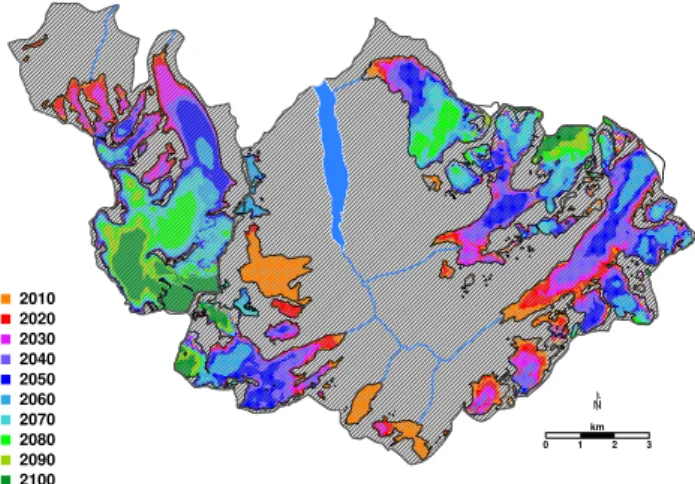
According to the applied model, all glaciers in the Mau-voisin region will severely retreat in the future indepdent of their size. By the end of the 21st century, the en-tire area will be nearly ice-free. Only some ice patches above 3500 m a.s.l., with a total ice volume of 0.11 km3 (0.08↔0.24 km3), are expected to remain. Small glaciers will vanish completely.
The amount of retreat of the glaciers in the Mauvoisin re-gion is mainly controlled by the elevation of their accumu-lation area (Fig. 6). Small glaciers or parts of them below 3000 m a.s.l. are expected to disappear by 2020 as in case of Glacier de Fenˆetre, Glacier de la Tsessette and, to some extent, also Glacier de Crˆete S`eche. Small glaciers situated at higher altitudes, such as Glacier de Tournelon Blanc, will persist longer.
Model results revealed that larger glaciers, especially those with large ice volumes and high-altitude accumulation areas, will retreat considerably more slowly than the smaller ones. Within the next few decades, the larger glaciers will be af-fected mainly by thinning. Only at a later stage (after 2050), the glaciers are expected to show significant areal wastage. Glacier d’Otemma shows a particularly fast retreat in con-trast to the other larger glaciers in the area as indicated by our model. Already around 2070 Glacier d’Otemma will have al-most entirely vanished except of some tiny ice patches in the uppermost part. The reason for the rapid retreat of the Glacier d’Otemma despite the large initial ice volume can be associated with its main basin restricted to altitudes below 3100 m a.s.l. In comparison, in 2070 Glacier de Corbassi`ere will cover almost half of its initial area because of consider-able ice masses situated at altitudes above 4000 m a.s.l.
4.2.2 Hydrology
1900 1950 2000 2050 2100 0
2 4 6
Volume (km
3) dV = 2.8 km
3
dV = 3.6 km
3
Ice volume 1900
Ice volume 2009
Fig. 5.Ice volume evolution in the Mauvoisin region between 1900
and 2100. The hatched zone represents the 95 % confidence interval for the past given by the ice volume uncertainty and for the future given by the 100 different model runs. Black triangles and corre-sponding dotted lines show years in which a DEM is available.
approximately 260 mio m3a−1. In between, the annual runoff volume dropped back to values of less than 220 mio m3a−1. These fluctuations can be correlated with the glacier evolu-tion as well as with changes in temperature and precipita-tion (Fig. 7). In the next two decades, annual runoff is pro-jected to increase to approximately 275 mio m3a−1 (+4 %). Afterwards, a continuous decline is expected until the end of the 21st century. Compared to the maximal runoff volume of 275 mio m3a−1, the annual runoff will drop about 25 % to 207 mio m3a−1until 2100. In comparison to a previous study addressing nine selected catchments in the Swiss Alps (Farinotti et al., 2012), in future runoff evolution in the Mau-voisin catchment shows a similar evolution as other strongly glacierized catchments.
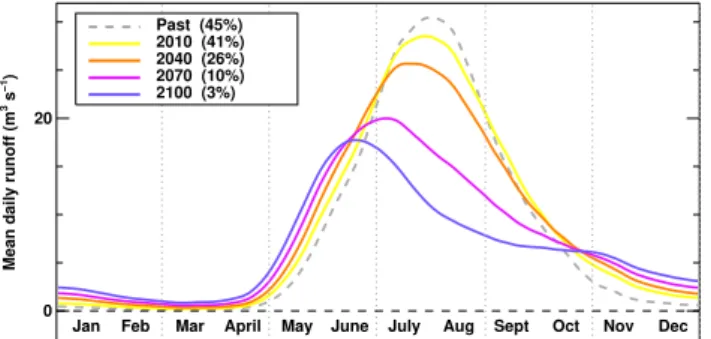
The changing climate and the associated glacier wastage will not only affect the amount of annual runoff, but also the individual runoff components, leading to significant changes in the runoff regime. At present, the runoff regime is dom-inated by ice- and snowmelt and shows a peak discharge in the months July and August (Fig. 8). Modelled runoff pro-jections indicate that, in the future, the mean daily runoff in summer will strongly diminish, whereas during winter daily runoff will slightly enhance due to higher air temperatures. Currently, a maximum mean daily runoff of 28 m3s−1is at-tained at the end of July, which will decrease to 18 m3s−1 until the year 2100. Beside the reduction of daily runoff, also a shift of peak runoff is expected. According to the model, maximal runoff values will occur 1.5 months earlier at the end of the 21st century compared to the reference period. This shift of the peak discharge from end of July to mid-June results from the decrease of the runoff volumes in the months July to September by about 44 % compared to the refer-ence period. Furthermore, the runoff projections indicate that daily runoff increases slightly earlier in spring compared to the present situation due to the earlier onset of the snowmelt season. The time offset between the beginning of the melt season in the reference period and in 2100 is around three weeks. Similar changes in the runoff regimes of high-alpine
0 1 2 3
km 2010
2020 2030 2040 2050 2060 2070 2080 2090 2100
Fig. 6.Projected glacier retreat in the Mauvoisin region until the end
of the 21st century. Glacier area is shown in 10-yr steps. Hatched zones framed by grey thick lines represent the outlines of the two subcatchments Mauvoisin and Corbassi`ere/Petit Combin.
basins in the future have been reported by other studies (Hor-ton et al., 2006; Uhlmann et al., 2012).
The reason for these changes in the runoff regime becomes evident by considering the evolution of the different sources of water input to the runoff model with progressing climate change (Fig. 9). The model employed distinguishes between liquid precipitation, snowmelt, and ice melt. Firn is counted to ice melt. Between the sum of the three water input com-ponents (Fig. 9) and the runoff regime (Fig. 8) is a slight difference originating from runoff routing. During the refer-ence period (1980–2009), snowmelt is the main component and accounts for 60 % of the water input. At present, snow runoff contribution starts to increase mid-May and reaches a maximum at the beginning of July. The ice melt increases later in the season (at the beginning of June), and its maxi-mum occurs around the end of July. Model projections show that maximum snowmelt is shifted to the beginning of June and that the ice melt is reduced and its maximum shifted to mid-August by the end of the 21st century. Hence, the shift of the snowmelt peak and the reduction of the ice melt lead to reduced runoff volumes in July and August as shown by the runoff regime evolution.
1900 1950 2000 2050 2100 200
400
Runoff / Precipitation (mio m
3a −1)
−4 −2 0 2
Air temperature (
oC) annual runoff
precipitation
temperature glacierization
1900 1950 2000 2050 2100
200 400
0 20 40 60 80 100
Glacierization (%)
Fig. 7.Evolution of annual runoff, precipitation, air temperature and
glacierization in the Mauvoisin catchment. Bold lines represent run-ning means, the thin grey line the effective evolution of the annual runoff. The blue hatched zone shows the 95 % confidence interval of the annual runoff determined from multiple model runs. The grey dotted lines indicate the 95 % confidence interval of the effective annual runoff evolution in the past based on the bias between mod-elled and measured annual runoff. The grey shaded area refers to the percentage of the ice covered area in the catchment.
0 200
0 20
Jan Feb Mar April May June July Aug Sept Oct Nov Dec
Mean daily runoff (m
3 s −1)
Past (45%) 2010 (41%) 2040 (26%) 2070 (10%) 2100 (3%)
Fig. 8.Evolution of the runoff regime in the Mauvoisin region for
the reference period and four time snapshots in the future averaged
over±5 yr. Numbers in brackets refer to the percentage of glacier
cover.
5 Ice volume sensitivity analysis
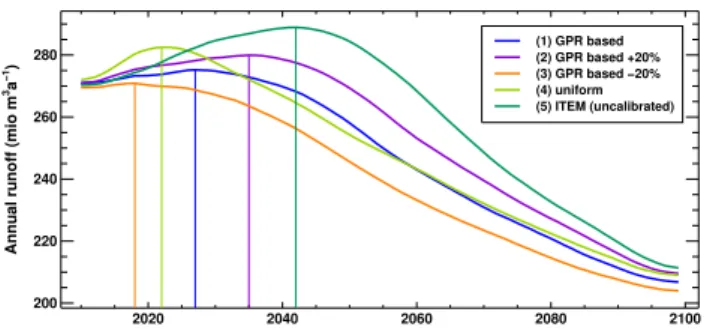
Extensive helicopter-borne GPR measurements allowed the ice-thickness distribution in the Mauvoisin area to be deter-mined accurately. If such data sets are not available, simpli-fied models need to be employed. By means of a sensitivity analysis, we have quantified the influence of the initial ice-thickness distribution on glacier and runoff projections.
For that purpose, we considered five different ice-thickness distributions (Fig. 10).
1. Approach as described in Sect. 3.2., case (1) refers to the reference ice-thickness distribution based on the mea-surements.
2. Ice-thickness distribution has the same pattern as (1) but scaled by +20 %. This case shows the influence of over-estimated total ice volumes on runoff projections. 3. Ice-thickness distribution has the same pattern as (1)
scaled by −20 %. Case (3) emphasizes the impact of underestimation of the total ice volume on the runoff evolution.
0 200
0 5 10 15 20
Jan Feb Mar April May June July Aug Sept Oct Nov Dec
Runoff (m
3 s −1)
Ice melt Snow melt Liquid precipitation
2010 (a)
0 200
0 5 10 15 20
Jan Feb Mar April May June July Aug Sept Oct Nov Dec
Runoff (m
3 s −1)
Ice melt Snow melt Liquid precipitation
2040 (b)
0 200
0 5 10 15 20
Jan Feb Mar April May June July Aug Sept Oct Nov Dec
Runoff (m
3 s −1)
Ice melt Snow melt Liquid precipitation
2070 (c)
0 200
0 5 10 15 20
Jan Feb Mar April May June July Aug Sept Oct Nov Dec
Runoff (m
3 s −1)
Ice melt Snow melt Liquid precipitation
2100 (d)
Fig. 9.Evolution of the three components of the water input to the
runoff routing model for the years 2010(a), 2040(b), 2070(c), and
2100(d). The values are averaged over±5 yr.
4. Ice-thickness distribution is uniform with a mean ice thickness calculated by the ice volume based on (1) for each glacier. This distribution is the most simple case and is used in most macro-scale hydrological models where ice volume is crudely processed (Fig. 10c). 5. Ice-thickness distribution is calculated by the ITEM
a. Ice volume: radar
Ice thickness [m]
0 125 250
0 Difference [m]
−100 0 100
b. Ice volume: ITEM
d. Difference: radar − ITEM
c. Ice volume: uniform
e. Difference: radar − uniform
Fig. 10.The different ice-thickness distributions:(a)the GPR-based ice volume distribution,(b)the ice-thickness distribution derived by
ITEM, and(c)the uniform ice-thickness distribution.(d)and(e)refer to the ice-thickness difference to the reference distribution determined
by measurements.
Table 5.Summary of the main results of this study. The evolution of the ice volume, the glacierized area, the annual runoff and the different
components of water input to the runoff routing model (ice melt, snowmelt, and liquid precipitation) is shown for the period 1920–2100 in
30-yr steps. Values are averaged over±5 yr.
Quantity Unit 1920 1950 1980 2010 2040 2070 2100
Ice volume km3 6.2 5.3 4.3 2.4 1.8 0.6 0.1
Glacier area km2 75.9 72.7 71.7 61.6 38.6 15.5 4.2
Annual runoff 106m3a−1 207 258 223 260 270 231 206
Ice melt 106m3a−1 19 15 6 19 13 11 5
Snow melt 106m3a−1 103 126 121 119 118 112 105
Liquid precipitation 106m3a−1 51 66 61 85 96 103 109
When assuming a constant correction factorc=0.53 (5), ITEM overestimates the total ice volume of the Mauvoisin region by about 36 % (Table 3). Especially for Glacier du Brenay and Glacier du Mont Durand, the ice volume is over-estimated by 61 and 80 %, respectively. Glacier du Gi´etro shows in case ofc=0.53 an exceptional small deviation of only−7 %. Glacier de Corbassi`ere and Glacier d’Otemma show mainly in the lower area large ice-thickness deviations between the GPR- and the ITEM-based bed topography of up to 130 m (Figs. 10 and 11). Glacier du Brenay and Glacier du Mont Durand show deviations in the ice thickness of the same order, but the largest deviations are located more in the center than on the lower part of the glacier.
5.1 Impact of initial ice volume distribution on runoff
0 2000 4000 6000 Profile length (m)
2200 2400 2600 2800 3000 3200
Altitude (m asl)
Glacier surface Glacier bed (GPR) Glacier bed (ITEM) GPR measurements
0 2000 4000 6000
2200 2400 2600 2800 3000 3200
Fig. 11.Longitudinal profile along the central flow line of Glacier
de Corbassi`ere (see Fig. 1). The thin black line refers to the glacier bed derived from the GPR measurements, the thin grey line to the bed computed by the ITEM and the blue line to the glacier surface. The red crosses mark the GPR-based ice-thickness measurements.
decreases until the end of the 21st century with general lower runoff volumes compared to GPR-derived results. Neglecting a spatial ice volume distribution by assuming uniform ice-thickness distribution (4) leads to an overestimation of the runoff in the next two decades due to too large ice masses in low altitude. Maximal annual runoff will occur around 2020 with a peak discharge of 283 mio m3a−1 (3 %). In a later stage, the runoff of the uniform ice volume distribution aligns to the GPR-derived runoff curve. The application of ITEM with the uncalibrated and fixed parameter set (5) over-estimates the ice volume in the Mauvoisin region about 36 % which results in a similar runoff evolution as in case of the ice volume overestimated by 20 % (2). But, in case (5) the an-nual runoff shows a sharper increase of 12 % between 2010 and 2040. A maximum peak runoff of 287 mio m3a−1is ex-pected in this case.
6 Discussion
The ice volume sensitivity study emphasizes the importance of an accurate ice volume determination for glacier and runoff projections. The incorporation of ice-thickness mea-surements in the ice volume calculation is crucial in order to receive reliable ice volumes and ice-thickness distributions. Inaccurate estimations of the total ice volume will cause de-viations from the predicted general runoff trend. In case of the Mauvoisin region, it could be shown that an overesti-mated ice volume reveals a sharp runoff increase in the the next few decades, whereas estimations supported by mea-surements show almost no further increase in annual runoff. The ice-thickness distribution affects the runoff evolution as well, but not as pronounced as in case of an overestimated ice volume. A uniform ice volume distribution entails particu-larly in the next few decades an overestimation of runoff and is therefore less suitable for short- and mid-term projections.
2020 2040 2060 2080 2100
200 220 240 260 280
Annual runoff (mio m
3a −1)
(1) GPR based (2) GPR based +20% (3) GPR based −20% (4) uniform (5) ITEM (uncalibrated)
Fig. 12. Runoff projections based on the different initial
ice-thickness distributions. The numbers in brackets refer to the dif-ferent initial ice volume distributions presented in Section 5.
After major ice volume has melted, it only differs slightly from the GPR-derived runoff evolution. In absence of ice-thickness measurements, a mean parameter set has to be as-sumed carrying the potential of over- or underestimation of the true ice volume. In case mass balance measurements are available, mass balance gradients can be adjusted leading to improvements in the ice volume estimation. Due to the high sensitivity of the ice volume estimation on the correction fac-tor (Farinotti et al., 2009b), the use of an appropriate cor-rection factor is of much higher importance compared to the mass balance gradients. Knowledge about the local ice thick-ness enables the calibration of the correction factor resulting in a significantly increased accuracy of the ice volume es-timation. New approaches are required for better assessing correction factors for individual glaciers if no ice-thickness measurements are available. Our results suggest that the in-corporation of GPR-based ice-thickness measurements is of high importance in order to provide reliable runoff projec-tions especially for the next 30–40 yr when profound changes are expected.
Despite the high density of ice-thickness measurements and the application of an ice-thickness estimation method, the true bed topography is not fully known. Uncertain-ties arise due to uncertainUncertain-ties of the ice-thickness measure-ments and due to the interpolation method. Taking these two sources of error into account, an overall uncertainty of
±8 % was determined for the total ice volume. This
uncer-tainty leads to the same alterations of the runoff projections as shown by the results of the sensitivity analysis for under-and overestimated ice volume (20 %), but less pronounced.
is up to 30 % underestimated by the AAR approach, which is clearly below the performance of all tested ice volume distri-butions.
The reliability and usefulness of the glacier evolution and runoff projections are also affected by uncertainties in the future climate evolution. The climate scenarios applied are based on the most recent climate study and incorporate dif-ferent combinations of regional and general circulation mod-els. However, only emission scenario SRES A1B (IPCC, 2007) was considered. Deviations from the chosen emission scenario might entail a different glacier evolution and conse-quently changes in the projected future runoff regime.
Uncertainties arise also from the chosen model approach. The prediction of the glacier evolution is determined on the basis of a temperature-index melt model in combination with an accumulation model. Due to the low data requirement of this approach, it is well suited for distributed modelling of entire catchments and available for future climate scenarios. However, temperature-index melt models act just as simpli-fied approaches of the true surface energy balance and react only to changes in the temperature and precipitation field. Other factors, such as variations in incoming or outgoing radiation or changes in the wind field, are not incorporated and may lead to different results. In the 1940s, a rise in the global radiation led to higher melting rates compared with today’s climate conditions despite of lower air temperatures (Huss et al., 2009). Such variations of solar radiation are not captured by temperature-index melt models retaining a con-stant parameter set and might yield discrepancies between projected and real glacier evolution.
Furthermore, uncertainties about the model parameters have the potential to cause deviations from glacier and runoff projections. The study of Farinotti et al. (2012) reveals that runoff projections are particularly sensitive to changes in the temperature gradient and melt parameter values. The study shows that a reduction of the temperature lapse rate by 10 % yields a decrease of the mean annual runoff between 2010 and 2100 of about 25 % and that an increase of the melt pa-rameters of 10 % leads to an increase of the mean annual runoff of 11 to 20 % in the same period. The temperature distribution has a big impact on runoff projections, because it controls the snow and ice melt and additionally also the phase of precipitation. Under- or overestimation of the total ice vol-umes leads to deviations in the mean glacier melt of the same order. In case of the ITEM-derived glacier bed topography, the total ice volume is overestimated by 36 % leading to a reduction of the mean glacier-induced runoff between 2010 and 2100 of about 31 %. This corresponds to a mean annual runoff reduction of about 4 % in the period 2010 to 2100, which is less than the effect of the temperature gradient and the melt parameters, because the ice volume affects the ice melt component only. But the discrepancy between the two runoff evolutions is higher for individual years, as around 2050, where the annual runoff based on the ITEM-derived ice volume distribution is overestimated by about 10 %. For
glacierized catchments the incorporation of glacier-specific data for the calibration procedure is crucial in order to reduce the uncertainty of the model parameters and to provide reli-able projections (Stahl et al., 2008; Jost et al., 2012). For this reason we are confident that the calibrated parameters are, despite the simple calibration method, appropriate for mod-elling the glacier and runoff evolution. Further improvements in the parameter estimation might be achieved by applying a more sophisticated optimization algorithm, but uncertainty about the validity and potential variations of the parameters in the future will remain.
Enlargement of the debris-covered area of a glacier might yield attenuation of the glacier retreat in future. Glacier d’Otemma and Glacier du Brenay show already an ex-tended debris cover in the ablation zones. During the last decades, especially small glaciers in the Mauvoisin area have shown a strong increase in debris cover. Similar observations have been reported from other mountain regions (Kellerer-Pirklbauer, 2008; Popovnin and Rozova, 2002; Stokes et al., 2009). In contrast, an increase in dust cover reduces the albedo and leads to an intensification of the melt process (Oerlemans et al., 2009). Insufficient understanding of the processes yielding changes in debris or dust cover and lack of data inhibit the implementation of debris cover evolution in melt models (Reid and Brock, 2010).
Moreover, the glacier evolution also involves uncertain-ties arising from the accumulation model. The spatial dis-tribution of precipitation and the distinction between liquid and solid precipitation are complex. Variable redistribution of snow by wind and avalanches further increases the com-plexity of the accumulation pattern (Lehning et al., 2008). The applied model includes a simplified snow redistribution approach but assumes constant snow redistribution patterns in time. Further effort is required to increase the accuracy in modelling the snow distribution on glaciers (Dadic et al., 2010).
Projections of the annual runoff volume and the runoff regime were compared to the results of the study by Schaefli et al. (2007) which investigated the influence of the climate change on the hydropower production in the Mauvoisin re-gion by a more simplified approach. Our results show higher annual runoff volumes by the end of the 21st century com-pared to Schaefli et al. (2007). Changes in the daily runoff regime as the reduction of the peak discharge and the shift to-ward earlier in season are ascertained by both studies. How-ever, a direct comparison is not possible, because (1) dif-ferent climate scenarios were used, and (2) the investigated catchments differ in their extent.
7 Conclusions
volume in the Mauvoisin area. A total ice volume of 3.69±
0.31 km3was calculated by including all available measure-ments, and a maximal ice thickness of 291 m was found. The derived ice volume distribution served as input for a combined glacio-hydrological model (Huss et al., 2008b; Farinotti et al., 2012), by which glacier and runoff projec-tions were determined. By means of a sensitivity analysis, we could demonstrate that an under- or overestimation of the total ice volume may lead to severe distortions of the runoff projections and potentially even to deviations from the projected general runoff trend. Particularly for projections for the next 20 to 30 yr, an accurate ice volume determina-tion and an appropriate ice-thickness distribudetermina-tion is crucial. The study emphasizes the importance of the incorporation or GPR measurements in order to get reliable ice-thickness dis-tributions. Including ice-thickness measurements clearly in-creases the accuracy of the ice volume estimation and, hence, the runoff projections.
According to our model, the annual runoff will rise about 4 % to a maximum of 275 mio m3a−1 until around 2030 and will drop in the subsequent period to 207 mio m3a−1 by 2100. The runoff regime is expected to change from an ice melt- to a snowmelt-dominated regime. Maximum mean daily runoff will decrease from 28 m3s−1to 18 m3s−1from 2010 to 2100 and will occur 1.5 month earlier by 2100 than in the reference period.
Application of helicopter-based radar measurements on further alpine catchments will lead to a more profound knowledge about the ice volume and the ice-thickness dis-tribution in the Alps. According to an improved knowl-edge about the ice volume distribution, glacio-hydrological projections will become more accurate. Progress in model approaches (e.g. knowledge of the long-term behaviour of model parameters) and the development of improved climate scenarios may further reduce the uncertainty about the future evolution.
Acknowledgements. Our particular thanks go to theForces Motri-ces de Mauvoisin SAwhich has enabled and supported different data acquisitions in the Mauvoisin region. They have also provided long-term measurement series of the inflow to the reservoir.
Fur-ther, we thank theCenter for Climate Systems Modeling (C2SM)
which provided regional climate scenarios of FUGE project. Constructive comments of two anonymous reviewers helped to improve the manuscript. Finally, we would like to acknowl-edge Bruno Nendela and Hermann B¨osch for topographic and photogrammetrical analysis. This study is a contribution to NRP 61.
Edited by: M. Weiler
References
Bauder, A.: Automatic surveying for hazard prevention on Glacier de Gi´etro, in: Milestones in Physical Glaciology From the Pio-neers to a Modern Science, Vol. 180, 1–3, Mitteilung der Ver-suchsanstalt f¨ur Wasserbau Hydrologie und Glaziologie, ETH Z¨urich, International Glaciological Symposium held in honor of Prof. Dr. Hans R¨othlisberger on the occasion of his 80th birthday, 14 February 2003.
Bauder, A., Funk, M., and Huss, M.: Ice volume changes of selected glaciers in the Swiss Alps since the end of the 19th century, Ann. Glaciol., 46, 145–149, 2007.
Begert, M., Schlegel, T., and Krichhofer, W.: Homogeneous temper-ature and precipitation series of Switzerland from 1864 to 2000, Int. J. Climatol., 25, 65–80, 2005.
Bosshard, T., Kotlarski, S., Ewen, T., and Sch¨ar, C.: Spectral rep-resentation of the annual cycle in the climate change signal, Hy-drol. Earth Syst. Sci., 15, 2777–2788, doi:10.5194/hess-15-2777-2011, 2011.
Braun, L. N., Weber, M., and Schulz, M.: Consequences of climate change for runoff from Alpine regions, Ann. Glaciol., 31, 19–25, 2000.
Bundesamt f¨ur Energie: Engergieperspektiven f¨ur die Schweiz bis 2050, Departement f¨ur Umwelt, Verkehr, Energie und Kommu-nikation, Bundesamt f¨ur Energie BFE, Switzerland, available at: http://www.bfe.admin.ch (last access: 26 November 2012), 2011a.
Bundesamt f¨ur Energie: Wasserkraft, Departement f¨ur Umwelt, Verkehr, Energie und Kommunikation, Bundesamt f¨ur Energie BFE, Switzerland, available at: http://www.bfe.admin.ch (last ac-cess: 26 November 2012), 2011b.
CH2011: Swiss Climate Change Scenarios CH2011, published by C2SM, MeteoSwiss, ETH, NCCR Climate, and OcCC, Zurich, Switzerland, 88 pp., 2011.
Chen, J. and Ohmura, A.: Estimation of Alpine glacier water re-sources and their change since the 1870s, in: Hydrology in Mountainous Regions I, 127–135, IAHS, proceedings of two Lausanne Symposia, No. 193, 1990.
Dadic, R., Mott, R., Lehning, M., and Burlando, P.: Wind influence on snow depth distribution and accumulation over glaciers, J. Geophys. Res., 115, F01012, doi:10.1029/2009JF001261, 2010. Farinotti, D., Huss, M., Bauder, A., and Funk, M.: An estimate of the glacier ice volume in the Swiss Alps, Global Planet. Change, 68, 225–231, doi:10.1016/j.gloplacha.2009.05.004, 2009a. Farinotti, D., Huss, M., Bauder, A., Funk, M., and Truffer, M.: A
method to estimate ice volume and ice thickness distribution of alpine glaciers, J. Glaciol., 55, 422–430, 2009b.
Farinotti, D., Usselmann, S., Huss, M., Bauder, A., and Funk, M.: The runoff evolution in the Swiss Alps: Projections for selected high-alpine catchments based on ENSEMBLES scenarios, Hy-drol. Process., 26, 1909–1924, doi:10.1002/hyp.8276, 2012. Fischer, A.: Calculation of glacier volume from sparse ice-thickness
data, applied to Schaufelferner, Austria, J. Glaciol., 55, 453–460, 2009.
Glen, J. W.: The creep of polycrystalline ice, P. R. Soc. Lond. A, 228, 519–538, 1955.
Hock, R., Jansson, P., and Braun, L. N.: Modelling the response of mountain glacier discharge to climate warming, in: Global Change and Mountain Regions (An Overview of Current Knowl-edge), edited by: Huber, U. M., Bugmann, H. K. M., and Rea-soner, M. A., Adv. Glob. Change Res., 23, 243–252, Springer, 2005.
Horton, P., Schaefli, B., Hingray, B., Mezghani, A., and Musy, A.: Assessment of climate change impacts on Alpine discharge regimes with climate model uncertainty, Hydrol. Process., 2091– 2109, doi:10.1002/hyp.6197, 2006.
Huss, M., Bauder, A., Funk, M., and Hock, R.: Determination of the seasonal mass balance of four Alpine glaciers since 1865, J. Geo-phys. Res., 113, F01015, doi:10.1029/2007JF000803, 2008a. Huss, M., Farinotti, D., Bauder, A., and Funk, M.: Modelling runoff
from highly glacierized alpine drainage basins in a changing cli-mate, Hydrol. Process., 22, 3888–3902, doi:10.1002/hyp.7055, 2008b.
Huss, M., Funk, M., and Ohmura, A.: Strong Alpine glacier melt in the 1940s due to enhanced solar radiation, Geophys. Res. Lett., 36, doi:10.1029/2009GL040789, 2009.
Huss, M., Jouvet, G., Farinotti, D., and Bauder, A.: Future high-mountain hydrology: a new parameterization of glacier retreat, Hydrol. Earth Syst. Sci., 14, 815–829, doi:10.5194/hess-14-815-2010, 2010.
IPCC: IPCC Emission Scenarios (SRES), Nakicenovic N, Swart R (eds), Cambridge University Press, 570 pp., 2000.
IPCC: Climate Change 2007. The Physical Scientific Basis. Con-tributions of Working Group I to the Fourth Assessment Report of the Intergovernmental Panel on Climate Change, edited by: Solomon, S., Qin, D., Manning, M., Chen, Z., Marquis, M., Av-eryt, K.B., Tignor, M., and Miller, H.L., Cambridge University Press, Cambridge, United Kingdom and New York, NY, USA, 2007.
J´ohannesson, T., Raymond, C. F., and Waddington, E. W.: Time-scale for adjustment of glaciers to changes in mass balance, J. Glaciol., 35, 355–369, 1989.
Jost, G., Moore, R. D., Menounos, B., and Wheate, R.: Quantify-ing the contribution of glacier runoff to streamflow in the up-per Columbia River Basin, Canada, Hydrol. Earth Syst. Sci., 16, 849–860, doi:10.5194/hess-16-849-2012, 2012.
Jouvet, G., Huss, M., Funk, M., and Blatter, H.: Modelling the re-treat of Grosser Aletschgletscher, Switzerland, in a changing cli-mate, J. Glaciol., 57, 1033–1044, 2011.
Kellerer-Pirklbauer, A.: The supraglacial debris system at the Pasterze Glacier, Austria: spatial distribution, characteristics and tranpsort of debris, Z. Geomorphol., 52, 3–25, 2008.
Klok, E. J. and Oerlemans, J.: Model study of the spatial distri-bution of the energy and mass balance of Morteratschgletscher, Switzerland, J. Glaciol., 48, 505–518, 2002.
Lehning, M., Loewe, H., Ryser, M., and Raderschall, N.: Inhomogeneous precipitation distribution and snow trans-port in steep terrain, Water Resour. Res., 44, W07404, doi:10.1029/2007WR006545, 2008.
Oerlemans, J., Giesen, R., and van den Broeken, M.: Retreating alpine glaciers: increased melt rates due to accumulation of dust (Vadret da Morteratsch, Switzerland), J. Glaciol., 55, 729–736, 2009.
Paul, F. and Linsbauer, A.: Modeling of glacier bed topography from glacier outlines, central branch lines, and a DEM, Int. J.
Geogr. Inf. Sci., 26, 1–18, doi:10.1080/13658816.2011.627859, 2012.
Paul, F., Maisch, M., Rothenbuehler, C., Hoelzle, M., and Haeberli, W.: Calculation and visualisation of future glacier extent in the Swiss Alps by means of hypsographic modelling, Global Planet. Change, 55, 343–357, 2007.
Pellicciotti, F., Brock, B. J., Strasser, U., Burlando, P., Funk, M., and Corripio, J.: An enhanced temperature-index glacier melt model including the shortwave radiation balance: development and test-ing for Haut Glacier d’Arolla, Switzerland, J. Glaciol., 51, 573– 587, 2005.
Popovnin, V. and Rozova, A.: Influence of sub-debris thawing on ablation and runoff of the Djankuat Glacier in the Caucasus, Nord. Hydrol., 33, 75–94, 2002.
Radar Systemtechnik GmbH: Website, available at: http://www. rst-group.biz (last access: 26 November 2012), 2012.
Reid, T. and Brock, B.: An energy-balance model for debris-covered glaciers including heat conduction through the debris layer, J. Glaciol., 56, 903–916, 2010.
Schaefli, B., Hingray, B., and Musy, A.: Climate change and hy-dropower production in the Swiss Alps: quantification of po-tential impacts and related modelling uncertainties, Hydrol. Earth Syst. Sci., 11, 1191–1205, doi:10.5194/hess-11-1191-2007, 2007.
Schneeberger, C., Blatter, H., Abe-Ouchi, A., and Wild, M.: Mod-elling changes in the mass balance of glaciers of the northern
hemisphere for a transient 2CO2scenario, J. Hydrol., 282, 145–
163, doi:10.1016/S0022-1694(03)00260-9, 2003.
Schwarb, M., Daly, C., Frei, C., and Sch¨ar, C.: The mean annual and seasonal precipitation throughout the European Alps 1971–1990, Vol. 2-6, 2-7, Hydrological Atlas of Switzerland, 2001. Stahl, K., Moore, R. D., Shea, J. M., Hutchinson, D., and Cannon,
A. J.: Coupled modelling of glacier and streamflow response to future climate scenarios, Water Resour. Res., 44, W02422, doi:10.1029/2007WR005956, 2008.
Stokes, C., Popovnin, V., Aleynikov, S., Gurney, S., and Shahgedanova, M.: Recent glacier retreat in the Caucasus Moun-tains, Russia, and associated increase in supraglacial debris cover and supra-/proglacial lake development, J. Glaciol., 55, 444–452, 2009.
Uhlmann, B., Jordan, F., and Beniston, M.: Modelling runoff in a Swiss glacierized catchment – Part II: daily discharge and glacier evolution in the Findelen basin in a progressively warmer cli-mate, Int. J. Climatol., online first: doi:10.1002/joc.3516, 2012. van der Linden, P. and Mitchell, J.: ENSEMBLES: Climate Change
and its Impacts: Summery of research and results from the EN-SEMBLES project, Met Office Hadley Centre, Exeter EX1 3PB, UK, 160 pp., 2009.
VAW: Mauvoisin – Gi´etrogletscher – Corbassi`eregletscher. Glazi-ologische Studien im Zusammenhang mit den Stauanlagen Mau-voisin, im Auftrag der Elektrizit¨atsgesellschaft Lauffenburg AG (M. Funk, unver¨offentlicht), 1998.
Verbunt, M., Gurtz, J., Jaspera, K., Langa, H., P., W., and Zappa, M.: The hydrological role of snow and glaciers in alpine river basins and their distributed modeling, J. Hydrol., 282, 36–55, 2003. Vieli, A., Funk, M., and Blatter, H.: Griesgletscher: Berechnungen