www.atmos-meas-tech.net/3/1589/2010/ doi:10.5194/amt-3-1589-2010
© Author(s) 2010. CC Attribution 3.0 License.
Measurement
Techniques
Understanding the aerosol information content in multi-spectral
reflectance measurements using a synergetic retrieval algorithm
D. Martynenko1, T. Holzer-Popp1, H. Elbern2, and M. Schroedter-Homscheidt1
1German Aerospace Center (DLR) e.V., Deutsches Fernerkundungsdatenzentrum (DFD), Oberpfaffenhofen, Germany 2Rhenish Institute for Environmental Research (RIU) at the University of Cologne, and Institute for Chemistry and Dynamics of the Geosphere – 2, Research Centre J¨ulich, Germany
Received: 7 May 2010 – Published in Atmos. Meas. Tech. Discuss.: 8 June 2010
Revised: 11 November 2010 – Accepted: 12 November 2010 – Published: 19 November 2010
Abstract. An information content analysis for multi-wavelength SYNergetic AErosol Retrieval algorithm SYNAER was performed to quantify the number of in-dependent pieces of information that can be retrieved. In particular, the capability of SYNAER to discern various aerosol types is assessed. This information content depends on the aerosol optical depth, the surface albedo spectrum and the observation geometry. The theoretical analysis is performed for a large number of scenarios with various geometries and surface albedo spectra for ocean, soil and vegetation. When the surface albedo spectrum and its accuracy is known under cloud-free conditions, reflectance measurements used in SYNAER is able to provide for 2–4◦ of freedom that can be attributed to retrieval parameters: aerosol optical depth, aerosol type and surface albedo.
The focus of this work is placed on an information con-tent analysis with emphasis to the aerosol type classifica-tion. This analysis is applied to synthetic reflectance mea-surements for 40 predefined aerosol mixtures of different basic components, given by sea salt, mineral dust, biomass burning and diesel aerosols, water soluble and water insol-uble aerosols. The range of aerosol parameters considered through the 40 mixtures covers the natural variability of tro-pospheric aerosols. After the information content analysis performed in Holzer-Popp et al. (2008) there was a neces-sity to compare derived degrees of freedom with retrieved aerosol optical depth for different aerosol types, which is the main focus of this paper.
Correspondence to: D. Martynenko (dmytro.martynenko@dlr.de)
The principle component analysis was used to determine the correspondence between degrees of freedom for signal in the retrieval and derived aerosol types. The main results of the analysis indicate correspondence between the major groups of the aerosol types, which are: water soluble aerosol, soot, mineral dust and sea salt and degrees of freedom in the algorithm and show the ability of the SYNAER to discern between this aerosol types.
The results of the work will be further used for the de-velopment of the promising methodology of the construction error covariance matrices in the assimilation system.
1 Introduction
Several satellite instruments measuring backscattered solar radiation are currently used to monitor atmospheric aerosols. But there is a limited number of retrieval methods which are capable to retrieve and classify different aerosol types.The characterization of aerosols using satellite observations is challenging due to their variability in many respects, such as composition, size, particle shape and vertical distribution. In order to determine as many relevant aerosol parameters as possible, radiometric and polarimetric observations in a broad wavelength range with many viewing angles and a high spatial and spectral resolution would be optimal (Chowdhary et al., 2001). However, such measurements are technically challenging.
capabilities is given in Kaufman et al. (2002). Examples of satellite retrieval of additional aerosol optical properties include the Angstrom coefficient, (e.g. AATSR dual view, Veefkind et al., 1999) and the separation into fine and coarse mode aerosols (e.g. MODIS multi-spectral collection 5, Levy et al. (2007); fine mode AOD only by POLDER polar-ized multi-spectral, Deuz´e et al., 2001). Further examples of aerosol characterisation use a choice from pre-defined aerosol types (e.g. MISR multi-angle, Kahn et al., 2005), de-liver the single scattering albedo (MODIS deep blue, Hsu et al., 2004), or provide derived quantities such as particle num-ber concentrations (e.g. parameterization based on MERIS multi-spectral measurements, von Hoyningen-Huene et al., 2003; Kokhanovsky et al., 2006).
In this study the information content of measurements of the synergetic algorithm SYNAER for AATSR and SCIA-MACHY is investigated. These instruments were conceived to improve our global knowledge and understanding of a va-riety of issues of importance for the chemistry and physics of the Earth atmosphere and potential changes resulting from either anthropogenic behaviour or natural phenomena. While not being the prime focus, aerosols are an impor-tant science target of these instruments. Both of the in-struments are flown on the European platform ENVISAT which was launched on 1 March 2002. AATSR data have a resolution of 1 km at nadir, and are derived from measure-ments of reflected and emitted radiation taken at seven wave-lengths: 0.55 µm, 0.66 µm, 0.87 µm, 1.6 µm, 3.7 µm, 11 µm and 12 µm. SCIAMACHY has a nadir and an additional limb viewing mode. Its nadir pixel size is 60×30 km2and it has a complete extended spectral range covering 240 to 1750 nm and 1940 to 2380 nm with a spectral resolution between 0.2 and 1.5 nm. In the latest calibration version the cross-correlation of spectrally and spatially integrated reflectances measured by both instruments and against another radiome-ter MERIS (Medium Resolution Imaging Spectromeradiome-ter) on-board ENVISAT was found to satisfy high accuracy require-ments with deviations on the order of 1% (Kokhanovsky et al., 2007).
At the German Remote Sensing Data Center (DFD) the aerosol retrieval method SYNAER was developed (Holzer-Popp et al., 2002a) which delivers boundary layer aerosol optical depth and type over both land and ocean, the latter as percentage contribution of 9 representative components based on the OPAC (Optical Parameters of Aerosols and Clouds, Hess et al., 1998) dataset to AOD. The SYNAER method consists of two parts. In the first part the AATSR ra-diometer data are used to retrieve aerosol optical depth and surface reflectance with a dark field method exploiting sin-gle wavelength radiometer reflectances (670 nm over land, 870 nm over ocean) for a selected aerosol type. In the second part the spectrometer data are then used to select the most plausible aerosol type by a least square fit of visible top-of atmosphere reflectance spectra at 10 wavelengths (415, 428, 460, 485, 500, 5 516, 523, 554, 615, and 675 nm).
As the estimation of the aerosol type is the most innovative part of SYNAER, a study provided an analysis of the infor-mation content of the second SYNAER part with regard to aerosol composition (Holzer-Popp et al., 2008). The purpose of the analysis in the work by Holzer-Popp et al, 2008 was to establish theoretically the information content of step 2 in the SYNAER retrieval, namely the choice of the most plau-sible aerosol mixture. The information content analysis in Holzer-Popp et al. (2008) estimated degrees of freedom for signal (DFS) for aerosol composition retrieval.
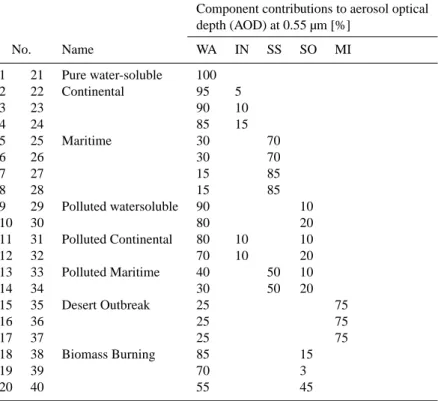
This paper is a logical continuation of the Holzer-Popp et al., 2008 work and concentrates mostly on the interpre-tation of the DFS values (their number being derived in the previous paper) in order to better understand the possibil-ity to differentiate between aerosol types using a principal component analysis. We assume 2 DFS from the first step of the SYNAER algorithm (regarding AOD and surface re-flectance) and up to 2–3 DFS for the second step (regarding aerosol type), as shown in Holzer-Popp et al. (2008). Con-sequently, the focus of this analysis was on exploiting the spectrometer measurements explicitly using the results of the first retrieval step, namely aerosol optical depth at 0.55 µm and surface reflectance at 0.55, 0.67 and 0.87 µm for each aerosol mixture. In the analysis of the information content 9 basic components (water soluble, water insoluble with high and low hematite content, sea salt accumulation and coarse mode, anthropogenic soot, biogenic soot and mineral dust with high and low hematite content) were used to define a set of 40 mixtures (see Table 1), which was then applied to radiative transfer calculations of simulated SCIAMACHY spectra. Table 1 shows the definition of the 40 mixtures used in the SYNAER retrieval method. The set of 40 mixtures is meant to model all principally existing aerosol types and al-low for some variability in the composition of each type. Two groups of 20 mixtures, each are applied where either relative humidity or the absorption (hematite content) of the mineral components are altered. There is also a height variation for those mixtures with an elevated aerosol layer, for example in definition of mixtures 15–17 for desert dust outbreaks.
The set of 40 mixtures is meant to model all principally existing aerosol types and allow for some variability in the composition of each type. This set of mixtures has proven to provide a fit in the SCHIMACHY spectra retrieval which is in many cases at a 0.01% noise level. There is no desert dust mixed with biomass soot aerosol type in predefined types of the aerosol mixtures.
Table 1. Pre-defined external aerosol mixtures of the basic components which are used in SYNAER. Adapted from Holzer-Popp et al. (2008).
WA = watersoluble, IN = insoluble, SS = sea salt, SO = soot, MI = mineral dust.
Component contributions to aerosol optical depth (AOD) at 0.55 µm [%]
No. Name WA IN SS SO MI
1 21 Pure water-soluble 100
2 22 Continental 95 5
3 23 90 10
4 24 85 15
5 25 Maritime 30 70
6 26 30 70
7 27 15 85
8 28 15 85
9 29 Polluted watersoluble 90 10
10 30 80 20
11 31 Polluted Continental 80 10 10
12 32 70 10 20
13 33 Polluted Maritime 40 50 10
14 34 30 50 20
15 35 Desert Outbreak 25 75
16 36 25 75
17 37 25 75
18 38 Biomass Burning 85 15
19 39 70 3
20 40 55 45
(mainly mineral dust, to minor parts smoke plumes from wildfires) is classified as “cloudy” by APOLLO and these AATSR pixels are then not used for the retrieval of AOD in SYNAER, leading to somewhat too small AOD values in the dust belts. The second shortcoming is an improper detection of shallow cumulus cloud cover over land due to a simple temperature threshold test for the rejection of cloudy pixels in order to not classify desert surfaces as low clouds (for de-tails see Holzer-Popp et al., 2002a). In the present theoretical study in order to eliminate cloudiness problem we are con-centrating only on clear sky pixels and assume no error due to cloud correction.
In order to retrieve AOD with an accuracy of 0.1 the sur-face albedo of the treated dark field should be known with an accuracy of 0.01 (see e.g. Holzer-Popp et al., 2002a). To achieve this accuracy in an automatic retrieval proce-dure over land for AATSR, dark fields are selected from a combination of thresholds for the normalized vegetation in-dex NDVI and the reflectance R1.6 in the mid-infrared at 1670 nm (over ocean a different scheme is used, which is described in Holzer-Popp et al., 2002a). For these dark fields R0.670 is estimated using a correlation with R1.6.
The focus of information content analysis is on the sec-ond retrieval step exploiting the spectrometer measurements. This uses the results of the first retrieval step, namely aerosol optical depth at 550 nm and surface reflectance at 550, 670 and 870 nm for each aerosol mixture.
So the spectral surface reflectance is considered to be known from the first retrieval step in SYNAER and not in-cluded as the part of the state vector in DFS analysis using Rodgers (2000) optimal estimation.
accurately known and the presence of clouds can be com-pletely excluded or corrected, see Holzer-Popp et al. (2002). This introduction is followed by the description of used method for information content analysis. An analysis of the information content of the (additional) second retrieval step of SYNAER with regard to aerosol composition including re-alistic noise in the retrieval is made (Sect. 2). The number of Degrees of Freedom of the Signal (DFS) is quantified by ap-plying Singular Value Decomposition Analysis to synthetic reflectance spectra (Sect. 3.1) for a large number of scenar-ios with various aerosol models, observation geometries and surface types. Section 3.2 gives an overview of the derived results for DFS and its interpretation. Section 3.3 deals with the distinction between aerosol types in the retrieval. The weights associated with the DFS provide a graphical view on the aerosol retrieval. This concept is used to investigate the cross correlations of the retrieved aerosol types. The paper concludes with a discussion and conclusions in Sect. 4.
2 Analysis of information content
The method used to examine and analyse the information content is the singular value decomposition (SVD). The fol-lowing theoretical description is based on the inverse meth-ods methodology (Rodgers, 2000). SVD is a useful tool to identify the dominant parts of the observations. This allows identifying the number of parameters which can be retrieved from observations and analysing the separability of the vari-ables retrieved. Generally, the number of observations does not equal the degrees of freedom because not all observations are uncorrelated.
For any remote measurement, we can define relationship between real state of the atmosphere and measurement:
y=F (x,b)+ε (1)
where y∈Rm is the measurements vector of dimension m, i.e. reflectances at m wavelengths; x∈Rn is the state vec-tor of dimension n; b is the vecvec-tor containing all the other parameters necessary to define the radiative transfer through the atmosphere to the spacecraft, F:Rn→Rmis the forward model that describes the physics of the measurements that map from the state space to the measurements space andε ∈Rmis the measurement error vector.
In this work some aspects of principal component analy-sis were used. Principal component analyanaly-sis is a powerful tool that helps to clarify the number of parameters that can be retrieved from a given set of observations. This approach is particularly useful for the analysis of the large measure-ment sets where a direct physical analysis is difficult due to high number of measured and retrieved parameters. In this study there is an attempt to infer information about the cor-relation or independence of retrieved types of aerosol param-eters. A similar analysis for different aerosol parameters was
accomplished in (Veihelmann et al., 2007), where the princi-pal component analysis was applied, which works as follows: the set of n simulated reflectance measurements is stored in the measurement matrix Y with elementsynm, where the col-umn vectors are the n reflectance vectors from the state space
Rnand the index m indicates the wavelength band. The mea-surement matrix Y is normalized such that for each wave-length, the mean value of all measurements is zero and the standard deviation is unity. The covariance matrix A = YYT is diagonalized according to A = VT DV such that the row vectors of the matrix V form an orthonormal set of eigenvec-tors. Each reflectance measurement can be decomposed into a weighted sum of some basic components:
ym= ˆym+δ= kmax
X
k
wmkvk+δ (2)
Whereymˆ are the elements of the reconstructed measurement matrix with an errorδ, with weightswmkbeing the elements of the matrix W. Naturally, when a measurement is recon-structed using all K basic components(kmax= K, in Eq. 2), the errorδ is zero. The sum in Eq. (2) can be truncated at kmax<K without any loss of information as long as the error δis smaller than the error due to instrument noise.
The matrix V transforms the measurement matrix Y into the space of so called weights. D consists of eigenvalues of matrix A. These eigenvalues of the transformed Y can be interpreted as a measure for the importance (DFS) for each aerosol component. In this study, a very similar analysis method is performed. For the implementation of the tech-nique of identifying different aerosol types see Sect. 3.3.
The measurement vector for this theoretical analysis of the SYNAER retrieval consists of simulated spectra at 10 (m= 10) wavelengths for 40 (n= 40) different aerosol mix-tures with a given surface type. As a state vectorx for the
analysis we consider only 40 different aerosol models com-posed by 9 basic components. So the a priori covariance ma-trix Sa is the associated covariance mama-trix for these a pri-ori values and knowledge about thex vector, i.e. 40 aerosol
models. The method rests on the assumption, that a linear ap-proximation of F is sufficiently exact at some reference state
x0:
y−F (x0)=∂F
∂x(x−x0)+ε=K·(x−x0)+ε (3)
where K is the weighting function matrix of dimension m×n. Each element of K is the partial derivative of a for-ward model element with respect to a state vector element: kij=
∂F (x)i ∂xj
;∀i=1..m,∀j=1..n (4)
F maps the state space into the measurement space according
The information content can be condensed into the De-grees of Freedom for Signal (DFS). DFS can be interpreted as the number of independent linear combinations of the state vector that can be independently retrieved from the measure-ments. It is given by:
DFS=X λ
2 i
1+λ2i (5)
whereλi are the singular values of (Sε)−1/2K (Sa)1/2.
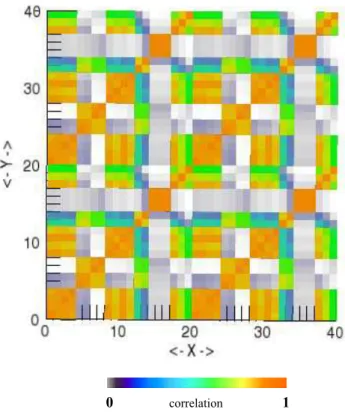
Sε and Sa correspond to measurement covariance matrix and a priori covariance matrix. The measurement covariance matrix Sεhas a diagonal form, with diagonal elements equal to the relative error of measured reflectance spectrum values. The structure of the a priori covariance matrix Sais shown on Fig. 1. The elements of this matrix are derived from Table 1 using an ordinary definition of covariance:
Saij= 1 n
X (ri−
⌣ r )(sj−
⌣
s ) (6)
where ri, sj are the percentage contributions of the 9 basic components for each aerosol mixture from Table 1; , ˇs are the mean values of ri, sj, i=1..n, j=1..n; n is the total number of mixtures.
3 Results
In this section the results of the DFS analysis are shown and discussed for a large number of scenarios. The capabilities of the multi-wavelength algorithm are assessed using the num-ber of DFS as well as the weights of the measurement matrix. 3.1 Synthetic reflectance data
For a fast application in aerosol retrieval precalculated radia-tive transfer tables are used. For this study radiaradia-tive transfer simulations are based on the Look-Up Tables (LUT) which includes simulations for many different aerosol cases for var-ious aerosol types, including biomass burning, desert dust, weakly absorbing and water soluble aerosols. The aerosol mixtures cover a range of optical parameters, as well as a range of atmospheric scenarios with varying AOD. Alto-gether, more than 2500 simulated reflectances with different geometry and aerosol parameters are taken into account. 3.2 Overview for number of degrees of freedom for
signal
The singular values used in definition of DFS drop fast with increasing order: for most geometries and surface types, more than 70% of the reflectance measurements can be re-produced within the measurement error when including 2 to 5 singular values; singular values of higher orders are then not relevant for most reflectance measurements since their contribution to the reflectance is dominated by instrument noise (Holzer-Popp et al., 2008).
0 correlation 1
Fig. 1. Graphical representation of the correlation between 40
pre-defined aerosol mixtures. The maximum correlation elements are on the main diagonal of the matrix (self correlation). There is also strong correlation between first and second halves of the 40 aerosol mixtures because of similarity between these two subsets. Stan-dard matrix normalization procedure (dividing by maximum ele-ment) was used.
Building on earlier work, the number of DFS calculated as explained at the end of Sect. 2 depends on the observa-tion geometry, the surface albedo and the choice of the noise threshold. In order to give an overview of the information content of reflectance measurements, histograms of the num-ber of DFS for various scenarios are shown. In Fig. 2 his-tograms of the number of DFS are plotted for the observation geometry for varying solar elevation angles (SEA), applying surface albedo spectrum for soil. The measurement error in this case is equal 10e-6. Histograms for the number of DFS of all aerosol models are shown for a series of geometries with sun elevation angles ranging from 12.5◦to 90◦. The in-formation content of measurements is a monotone function of satellite angle. In most cases the number of DFS varies between 2 and 5.
Fig. 2. Histogram for various scenarios (y-axis) of the number of
DFS of reflectance measurements for retrieval with different sun elevation angle (SEA) for a case with surface albedo spectra over soil.
also applicable in this case. There is an accumulation point (DFS = 4) about AOD = 0.16, from which the distribution of histograms is quite similar to each other. This means that fur-ther increase of AOD does not contribute to any additional aerosol information in the retrieval. In this case the variance of the measurement error covariance matrix is of order 10e-6. In Fig. 4 the histogram of the number of DFS is plotted for the observation geometry with solar elevation angle 42.5◦, surface albedo spectrum for vegetation and varying measure-ment observation error.
As a starting value of measurement error covariance (i.e. the square of the error) in this analysis we took 10e-6, which corresponds to 1% of reflectance spectra from SCIAMACHY reflectances in the visible (typically at 0.1), assuming explicit knowledge of surface type and AOD from the first AATSR step. So we don’t consider albedo uncertainty as the part of measurement error at this step. After that, in order to assess the sensitivity, we varied the measurement error in large steps (10e-6, 6e-7, 3e-8) and in small steps (4e-7, 5e-7, 6e-7). The choice of such values for the observation error variance is based on the attempt to explore the dependency of DFS from observation error. For the typical observation error variance of order 10e-6 obtained DFS varies between 3 and 4. When an error ofσε2=6e-7 is assumed, there are 4 degrees of free-dom for most of the aerosol measurements (yellow line). If this noise value is relaxed by assuming a lower error in obser-vations (with the observation error values ofσε2= 5e-7 (green line),σε2= 4e-7 (blue line),σε2= 3e-8 (purple line)), a further increase of degrees of freedom is monitored. The choice of such values for observation error variance is based on the at-tempt to explore the dependency of DFS from observation
er-Fig. 3. Histogram for various scenarios (y-axis) of the number of
DFS of reflectance measurements for aerosol models as a function of Aerosol Optical Depth (AOD) for a case with surface albedo spectra for soil.
ror in large-step series of the error (10e-6, 6e-7, 3e-8) and in small-step series of the observation error (4e-7, 5e-7, 6e-7). 3.3 Distinction between aerosol types
In SYNAER a look-up table approach is used. Radiative transfer calculations are pre-calculated for many values of the parameters, after that results are compared with measure-ments until the best “fit” is obtained. There is a problem in such a method, which is the lack of uniqueness in the solu-tions, but this is the problem of all ill-posed inversions. We used a classical tool from statistical methods (PCA) to ex-plore this problem, extract the uncorrelated and independent variables and concentrate attention only on main (principal) aerosol type components which should be retrieved. Such an approach has advantages (in comparison with, for example, Factor-analysis) and is useful since it will give us in an unbi-ased way the number of parameters (and their interpretation) that can be retrieved.
The PCA analysis is aiming only at the distinction of aerosol types. The spectral surface reflectance is considered to be known from the first retrieval step in SYNAER and not included as the part of the state vector in the DFS analysis.
σ
σ σ σ σ
σ2 =10e-6
σ2 =6e-7
σ2
=5e-7
σ2
=4e-7
σ2 =3e-8
Fig. 4. Histogram for various scenarios (y-axis) of the number of
DFS of SYNAER reflectance measurements using different obser-vation errors for spectrum measurements. The black histogram cor-responds to observational measurement varianceσ2=10e-6, yel-low corresponds toσ2=6e-7, green line: σ2=5e-7, blue line: σ2=4e-7, violet line: σ2=3e-8. Large-step series of the error: 10e-6, 6e-7, 3e-8 and small-step series of the observation error: 4e-7, 5e-4e-7, 6e-7 correspondingly.
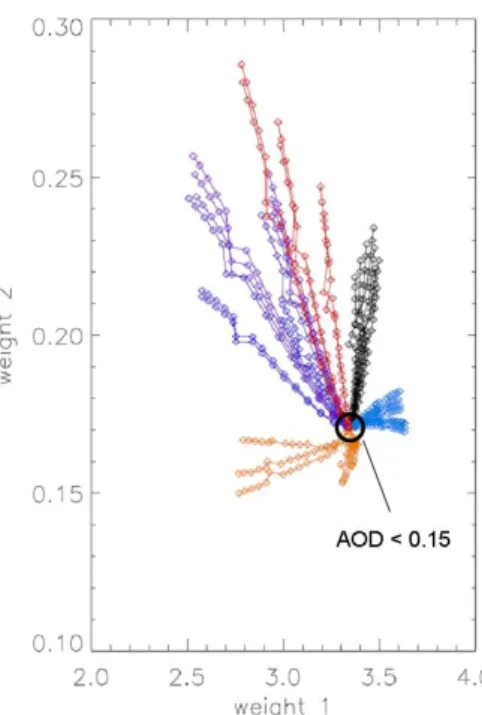
the first two weights for all 40 aerosol mixtures from Table 1. Solid lines connect models with identical aerosol type but variable aerosol optical depth ranging from 0 to 0.7, while all other parameters, such as observation angle, albedo, aerosol type are constant. When the solid lines in this plot construct a larger angle between each other, using DFS interpretation from Sect. 2, Eq. (5) it can be interpreted as uncorrelated measurements of aerosol mixtures with larger DFS number. The separability is also defined by a minimum distance to noise measurements, e.g. from the figure AOD>0.15. The independent retrieval becomes more pronounced when the AOD increases. It appears that the major groups of the aerosol mixtures can be separated rather well in most cases with AOD>0.15. Mineral dust aerosol with high and low hematite content are also represented with two separate bun-dles. The measurements from Fig. 5a containing independent information about desert dust and continental aerosol form the fact that these aerosol types are near-orthogonal in the space of weights. But this does not require that either desert dust or continental aerosol generate the basis in this space. In the same manner such retrieval parameters as surface type and AOD also can not be explicitly assigned to some DFS value.
Fig. 5a. Weights for the first and second eigenvalue component
for 40 aerosol mixtures for all measurement scenarios. Retrieval scenarios with the same parameters but with varying optical depth are connected with solid lines. The domain of diesel and biomass burning (red) overlaps with the domains of polluted aerosol (dark blue and violet). Other domains: maritime (light blue), continental (black) and desert dust (sienna) are distinguishable from one an-other.
However the domain of biomass burning aerosols (red) overlaps with the domain of polluted aerosols (violet). This overlap is less pronounced in the space of second and third weights (Fig. 5b), where the same 40 predefined aerosol mix-tures are represented. So for DFS≥3 here also separation becomes possible.
Fig. 5b. Distribution of retrieval in the space of second and third
weights for 40 aerosol mixtures for all measurement scenarios. Re-trieval scenarios with the same parameters but with varying optical thickness are connected with solid lines. There are five domains marked with different colours: the domain of diesel and biomass burning (red), the domain of polluted aerosol (dark blue and violet). Other domains: maritime (blue), continental (black) and desert dust (sienna). In this case black and red lines are not separated.
al., 2008). On the other hand one of the most favourable re-sults is shown on Fig. 6c, where the analysis for meadow surface type is made. Domains of different aerosol mod-els are well distinguished. The small overlap over the lower part of the domain is due to incomplete distinction between biomass burning and polluted water soluble aerosol and sim-ilar as it was indicated on Fig. 5a where a small overlap can be also observed. The retrieval still has problems with aerosol type identification in the lower part of the domain, despite favourable surface type: meadow. This feature con-firms once more the necessity for the reduction of the 40 pre-defined aerosol mixtures to a smaller number of aerosol type definitions.
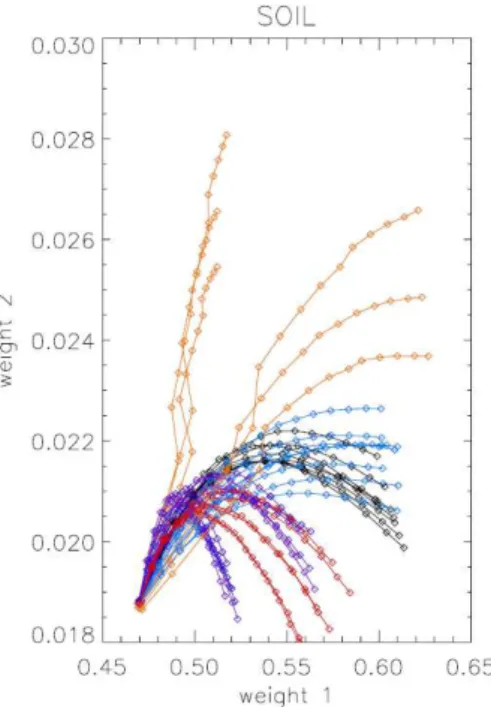
Such plots have been investigated for various typical ob-servation geometries and various surface type spectra. The differences between absolute values and starting point value for the solid lines on these figures (Fig. 6a, b and c) are caused by the differences between AOD measurement val-ues which form the structure of analysing matrices for each surface type case.
Fig. 6a. Distribution of retrieval in the space of first and second
weights for 40 aerosol mixtures only for the surface type soil.
4 Discussion and conclusions
The motivation of the present investigation is to explore aerosol type information content with the help of principal component analysis. This theoretical analysis is performed for a large number of scenarios with various geometries and surface albedo spectra for water, soil, vegetation etc. When the surface albedo spectra and AOD is accurately known and clouds are absent or are corrected, SCIAMACHY reflectance measurements have 2 to 3◦of freedom that can be attributed to aerosol type parameters. This was the main result from Holzer-Popp at al. (2008) work. The present work goes fur-ther in investigation of the correspondence of derived DFS to distinction of aerosol type. The capability of the SYNAER algorithm to discern aerosol types is investigated using the distribution of the models in the space of weights of the prin-cipal components. This is a new step in comparison with the previous Holzer-Popp at al. (2008) paper.
The main assumptions on aerosol retrieval which have been made are as follows:
– Particles are assumed to be spherical.
– There are 40 aerosol mixtures which are assumed to cover natural variability of aerosol in the troposphere. – The error measurement of the spectrometer is
Fig. 6b. Distribution of aerosol models in the space of first and
second weights for 40 aerosol mixtures for the surface type sand.
albedo uncertainties are excluded from the present error analysis.
A good overview of the discretization of radiative transfer is represented in Hasekamp et al. study. This work presents an analytical linearization of vector radiative transfer with respect to physical properties of spherical aerosols. It is quite close to the analysis of information content discussed in ACP paper by Holzer-Popp et al. (2008). There, we also use linearization of radiative transfer around some point of state space with respect to different aerosol type properties. The present paper concentrates on PCA analysis applied for aerosol type in order to understand the separation of the aerosol types.
The information content of SYNAER simulated re-flectance measurements has been investigated using DFS analysis. This analysis has been performed with a total of about 2500 synthetic SCIAMACHY reflectance measure-ments in wavelength bands between 400 nm to 700 nm. The number of DFS for reflectance measurements varies between 2 and 6, depending on AOD, surface type, observation angle and noise. The number of DFS reported here are consistent with the results of a preliminary short theoretical study on the information content (Holzer-Popp et al., 2008). Derived DFS from that study can now be assigned in appropriate way to the different types of aerosol. The weights of all aerosol mod-els have been employed to investigate the capability of the SYNAER algorithm to distinguish different aerosol types. Consider the angle between solid lines in Fig. 5 as an index of discernment for aerosol models. Desert dust,
continen-Fig. 6c Distribution of aerosol models in the space of first and second weights for 40 aerosol
MEADOW
Fig. 6c. Distribution of aerosol models in the space of first and
sec-ond weights for 40 aerosol mixtures for the surface type meadow.
tal, sea salt and polluted aerosol can be discerned well from each other. Desert dust can be discerned from other types of aerosol with the best index. Some aerosol cases for biomass burning cannot be distinguished from polluted aerosol in the space of the first two weights. This ambiguity depends on the number of DFS and is less pronounced if three or more degrees of freedom of the signal can be assigned to aerosol. However, in the most typical SYNAER measurement cases, with sufficient solar angle and appropriate surface type, more than two DFS are available and then a third weight can be used in order to distinguish aerosol types.
Fig. 7 Distribution of aerosol models in the space of first and second weights in perfect case
Fig. 7. Distribution of aerosol models in the space of first and
sec-ond weights in perfect case of the retrieval.
The main results of this work will be further used in assim-ilation procedure of satellite data from SYNAER in chemical transport model. The main focus will be concentrated on tun-ing of error covariance matrices in assimilation ustun-ing DFS retrieval information.
Acknowledgements. This work was supported by German Aerospace Center. Thanks are especially given to Thomas Holzer-Popp.
Edited by: P. K. Bhartia
References
Chowdhary, J., Cairns, B., Mishchenko, M., and Travis, L.: Re-trieval of aerosol properties over the ocean using multispectral and multiangle photopolarimetric measurements from the re-search scanning polarimeter, Geophys. Res. Lett., 28(2), 243– 246, 2001.
Deuz´e, L., Br´eon, F. M., and Devaux, C.: Remote sensing of aerosols over land surfaces from POLDER-ADEOS–1 polarized measurements, J. Geophys. Res., 106(D5), 4913–4926, 2001. Hasekamp, O. P. and Landgraf, J.: Linearization of vector
radia-tive transfer with respect to aerosol properties and its use in satellite remote sensing, J. Geophys. Res., 110(D4), D04203, doi:10.1029/2004JD005260, 2005.
Hess, M., K¨opke, P., and Schult, I.: Optical Properties of Aerosols and Clouds: The Software package OPAC, B. Am. Meteorol. Soc., 79, 831–844, 1998
Holzer-Popp, T., Schroedter, M., and Gesell, G.: Retrieving aerosol optical depth and type in the boundary layer over land and ocean from simultaneous GOME spectrometer and ATSR-2 radiome-ter measurements, 1, Method description, J. Geophys. Res., 107(D21), AAC16-1–AAC16-17, 2002a.
Holzer-Popp, T., Schroedter-Homscheidt, M., Breitkreuz, H., Mar-tynenko, D., and Klser, L.: Improvements of synergetic aerosol retrieval for ENVISAT, Atmos. Chem. Phys., 8, 7651–7672, doi:10.5194/acp-8-7651-2008, 2008.
Hsu, N. C., Tsax, S.-C., and King, M.: Aerosol Properties Over Bright-Reflecting Source Regions, IEEE T. Geosci. Remote, 42(3), 557–569, 2004.
Kaufman, Y. J., Tanre, D., Gordon, H. R., Nakajima, T., Lenoble, J., Frouin, R., Grassl, H., Herman, B. M., King, M. D., and Teillet, P. M.: Passive remote sensing of tropospheric aerosol and atmo-spheric correction for the aerosol effect, J. Geophys. Res., 102, 16815–16830, 1997a.
Kaufman, Y. J., Tanre, D., Remer, L. A., Vermote, E. F., Chu, A., and Holben, B. N.: Operational remote sensing of tropospheric aerosol over land from EOS moderate resolution imaging spec-trometer, J. Geophys. Res., 102, 17051–17067, 1997b.
Kaufman, Y. J., Tanre, D., and Boucher, O.: A satellite view of aerosols in the climate system, Nature, 419, 215–223, 2002. Kokhanovsky, A. A., Bramstedt, K., von Hoyningen-Huene, W.,
and Burrows, J. P.: The intercomparison of top-of-atmosphere reflectivity measured by MERIS and SCIAMACHY in the spec-tral range of 443–865 nm, IEEE T. Geosci. Remote, 4, 293–296, 2007.
Kokhanovsky, A. A., von Hoyningen-Huene, W., and Burrows, J. P.: Atmospheric aerosol load as derived from space, Atmos. Res., 81, 176–185, 2006.
Kriebel, K. T., Saunders, R. W., and Gesell, G.: Optical properties of clouds derived from fully cloudy AVHRR pixels, Beitraege zur Physik der Atmosphaere, 8, 723–729, 1989.
Kriebel, K. T., Gesell, G., K¨astner, M., and Mannstein, H.: The cloud analysis tool APOLLO: Improvements and Validation, Int. J. Remote. Sens., 24, 2389–2408, 2003.
Rodgers, C. D.: Inverse methods for atmospheric sounding, Theory and Practice, University of Oxford, UK, 2000.
Tanr´e, D., Herman, M., and Kaufman, Y. J.: Information on aerosol size distribution contained in solar reflected spec-tral radiances, J. Geophys. Res., 101(D14), 19043–19060, doi:10.1029/96JD00333, 1996.
Veefkind J. P., de Leeuw, G., Durkee, P. A., Russell, P. B., Hobbs, P. V., and Livingston, J. M.: Aerosol optical depth retrieval using ATSR-2 data and AVHRR data during TARFOX, J. Geophys. Res., 104(D2), 2253–2260, 1999.
Veihelmann, B., Levelt, P. F., Stammes, P., and Veefkind, J. P.: Sim-ulation study of the aerosol information content in OMI spectral reflectance measurements, Atmos. Chem. Phys., 7, 3115–3127, doi:10.5194/acp-7-3115-2007, 2007.