ACPD
15, 32831–32887, 2015Aerosol microphysical properties profiles during ChArMEx 2012
M. J. Granados-Muñoz et al.
Title Page
Abstract Introduction
Conclusions References
Tables Figures
◭ ◮
◭ ◮
Back Close
Full Screen / Esc
Printer-friendly Version Interactive Discussion
Discussion
P
a
per
|
Discussion
P
a
per
|
Discussion
P
a
per
|
Discussion
P
a
per
|
Atmos. Chem. Phys. Discuss., 15, 32831–32887, 2015 www.atmos-chem-phys-discuss.net/15/32831/2015/ doi:10.5194/acpd-15-32831-2015
© Author(s) 2015. CC Attribution 3.0 License.
This discussion paper is/has been under review for the journal Atmospheric Chemistry and Physics (ACP). Please refer to the corresponding final paper in ACP if available.
Profiling of aerosol microphysical
properties at several
EARLINET/AERONET sites during July
2012 ChArMEx/EMEP campaign
M. J. Granados-Muñoz1,2,a, F. Navas-Guzmán3, J. L. Guerrero-Rascado1,2,
J. A. Bravo-Aranda1,2, I. Binietoglou4, S. N. Pereira5, S. Basart6,
J. M. Baldasano6, L. Belegante4, A. Chaikovsky7, A. Comerón8, G. D’Amico9, O. Dubovik10, L. Ilic11, P. Kokkalis12, C. Muñoz-Porcar8, S. Nickovic11,13, D. Nicolae4, F. J. Olmo1,2, A. Papayannis12, G. Pappalardo9, A. Rodríguez8, K. Schepanski14, M. Sicard8,15, A. Vukovic11,16, U. Wandinger14, F. Dulac17, and
L. Alados-Arboledas1,2
1
Dpt. Applied Physics, Faculty of Sciences, University of Granada, Fuentenueva s/n, 18071, Granada, Spain
2
Andalusian Institute for Earth System Research (IISTA-CEAMA), Avda. del Mediterráneo s/n, 18006, Granada, Spain
3
Institute of Applied Physics (IAP), University of Bern, Bern, Switzerland
4
ACPD
15, 32831–32887, 2015Aerosol microphysical properties profiles during ChArMEx 2012
M. J. Granados-Muñoz et al.
Title Page
Abstract Introduction
Conclusions References
Tables Figures
◭ ◮
◭ ◮
Back Close
Full Screen / Esc
Printer-friendly Version Interactive Discussion
Discussion
P
a
per
|
Discussion
P
a
per
|
Discussion
P
a
per
|
Discussion
P
a
per
|
5
Departamento de Física, ECT, Instituto de Ciências da Terra, IIFA, Universidade de Évora, Évora, Portugal
6
Earth Sciences Department, Barcelona Supercomputing Center-Centro Nacional de Supercomputación, BSC-CNS, Barcelona, Spain
7
Institute of Physics, National Academy of Sciences of Belarus, Minsk, Belarus
8
Dept. of Signal Theory and Communications, Remote Sensing Lab. (RSLab), Universitat Politècnica de Catalunya, Barcelona, Spain
9
Consiglio Nazionale delle Ricerche – Istituto di Metodologie per l Analisi Ambientale (CNR-IMAA), Potenza, Italy
10
Laboratoire d’Optique Atmospherique, CNRS Universite de Lille 1, Bat P5 Cite scientifique, 59655, Villeneuve d’Ascq CEDEX, France
11
Institute of Physics, University of Belgrade, Belgrade, Serbia
12
National Technical University of Athens, Physics Department, Laser Remote Sensing Laboratory, Zografou, Greece
13
South East European Virtual Climate Change Center, Republic Hydrometeorological Service, Belgrade, Serbia
14
Leibniz Institute for Tropospheric Research, Leipzig, Germany
15
Ciències i Tecnologies de l’Espai – Centre de Recerca de l’Aeronàutica i de l’Espai/Institut d’Estudis Espacials de Catalunya (CTE-CRAE/IEEC), Universitat Politècnica de Catalunya, Barcelona, Spain
16
Faculty of Agriculture, University of Belgrade, Belgrade, Serbia
17
Laboratoire des Sciences du Climat et de l’Environnement (IPSL-LSCE), CEA-CNRS-UVSQ, CEA Saclay, Gif-sur-Yvette, France
a
currently at: Table Mountain Facility, NASA/Jet Propulsion Laboratory, California Institute of Technology, Wrightwood, California, USA
Received: 5 August 2015 – Accepted: 10 November 2015 – Published: 20 November 2015
Correspondence to: M. J. Granados-Muñoz ([email protected])
ACPD
15, 32831–32887, 2015Aerosol microphysical properties profiles during ChArMEx 2012
M. J. Granados-Muñoz et al.
Title Page
Abstract Introduction
Conclusions References
Tables Figures
◭ ◮
◭ ◮
Back Close
Full Screen / Esc
Printer-friendly Version Interactive Discussion
Discussion
P
a
per
|
Discussion
P
a
per
|
Discussion
P
a
per
|
Discussion
P
a
per
|
Abstract
The analysis of aerosol microphysical properties profiles at different European stations
is made in the framework of the ChArMEx/EMEP 2012 field campaign (9–11 July 2012). During and in support to this campaign, five lidar ground-based stations (Athens, Barcelona, Bucharest, Évora and Granada) performed 72 h of continuous lidar and
5
collocated and coincident sun-photometer measurements. Therefore it was possible to retrieve volume concentration profiles with the Lidar Radiometer Inversion Code (LIRIC). Results indicated the presence of a mineral dust plume affecting the
West-ern Mediterranean region (mainly Granada station) whereas a different aerosol plume
was observed over the Balkans area. LIRIC profiles showed a predominance of coarse
10
spheroid particles above Granada, as expected for mineral dust, and an aerosol plume composed mainly of fine and coarse spherical particles above Athens and Bucharest. Due to the exceptional characteristics of the ChArMEx database, the analysis of the microphysical properties profiles temporal evolution was also possible. An in depth analysis was performed mainly at Granada station because of the availability of
contin-15
uous lidar measurements and frequent AERONET inversion retrievals. The analysis at Granada was of special interest since the station was affected by mineral dust during
the complete analyzed period. LIRIC was found to be a very useful tool for performing continuous monitoring of mineral dust, allowing for the analysis of the dynamics of the dust event in the vertical and temporal coordinates. Results obtained here illustrate the
20
importance of having collocated and simultaneous advanced lidar and sun-photometer measurements in order to characterize the aerosol microphysical properties both in the vertical and temporal coordinates at a regional scale. In addition, this study re-vealed that the use of the depolarization information as input in LIRIC in the stations of Bucharest, Évora and Granada was crucial for the characterization of the aerosol
25
ACPD
15, 32831–32887, 2015Aerosol microphysical properties profiles during ChArMEx 2012
M. J. Granados-Muñoz et al.
Title Page
Abstract Introduction
Conclusions References
Tables Figures
◭ ◮
◭ ◮
Back Close
Full Screen / Esc
Printer-friendly Version Interactive Discussion
Discussion
P
a
per
|
Discussion
P
a
per
|
Discussion
P
a
per
|
Discussion
P
a
per
|
forecast the vertical distribution of the mineral dust than the column integrated mass concentration, which was underestimated in most of the cases.
1 Introduction
The influence of the atmospheric aerosol particles in the Earth’s radiative forcing is still affected by a large uncertainty, as indicated in the AR5 report from the
Intergovern-5
mental Panel for Climate Change (IPCC, 2013). During past years, this uncertainty has been reduced from high to medium with respect to the data in the Fourth Assessment Report (AR4) of the IPCC, (2007). However, atmospheric aerosol still contribute to the largest uncertainty to the total radiative forcing estimate, even though the level of con-fidence on the effects of atmospheric aerosols has increased from low and medium to
10
medium and high (for indirect and direct effect, respectively) (IPCC, 2013).
The difficulty in accurately determining atmospheric aerosol properties and their
in-fluence on the Earth’s radiative forcing lies in their large spatial and temporal vari-ability. Ground based (active and passive) remote sensing techniques have proven to be quite robust and provide accurate results for atmospheric aerosol characterization
15
(e. g. Nakajima et al., 1996; Dubovik and King, 2000; Mattis et al., 2004; Olmo et al., 2006). Nonetheless, they provide information about atmospheric aerosol properties on a local scale. Since regional analyses are highly important when analyzing the aerosol variability, several observational networks have been developed. Namely, the lidar net-work GALION (Global Atmospheric Watch Aerosol Lidar Observation Netnet-work), which
20
includes EARLINET (European Aerosol Research Lidar Network, www.earlinet.org) (Bösenberg et al., 2001; Pappalardo et al., 2014), MPLNET (Micro Pulse Lidar Net-work) (Welton et al., 2005), LALINET (Latin American Lidar Network, www.lalinet.org) (Guerrero-Rascado et al., 2014) and ADNET (Asian Dust Network) (Shimizu et al., 2004) among others; ant the sun-photometer networks SKYNET (Skyradiometer
net-25
ACPD
15, 32831–32887, 2015Aerosol microphysical properties profiles during ChArMEx 2012
M. J. Granados-Muñoz et al.
Title Page
Abstract Introduction
Conclusions References
Tables Figures
◭ ◮
◭ ◮
Back Close
Full Screen / Esc
Printer-friendly Version Interactive Discussion
Discussion
P
a
per
|
Discussion
P
a
per
|
Discussion
P
a
per
|
Discussion
P
a
per
|
In addition to the regional coverage, these networks can provide useful informa-tion on the vertical and temporal coordinates, if adequate measurement protocols are stablished. Information on the vertical structure of the aerosol is of high importance, since the atmospheric aerosol effects can be very different near the surface, within the
boundary layer, and in the free troposphere. Estimates of radiative forcing are sensitive
5
to the vertical distribution of aerosols (Claquin et al., 1998; Huang et al., 2009; Sicard et al., 2014) and the vertical information is required for accounting the indirect effect
(McCormick et al., 1993; Bréon, 2006). In addition, atmospheric aerosol can change the vertical profile of temperature and atmospheric stability, which in turn influences the wind speed profile within the lower atmosphere (Pérez et al., 2006; Guerrero-Rascado
10
et al., 2009; Choobari et al., 2014). Furthermore, continuous and/or regular measure-ments provided by the networks, would allow us to analyse the temporal evolution and dynamics of the atmospheric aerosol particles, which will be very useful not only for accurately determining the radiative forcing, but also to improve the performance of nu-merical weather prediction (NWP) (e.g. Pérez et al., 2006a) and climatological models
15
(Nabat et al., 2014, 2015).
Lidar systems are widely used to determine the vertical distribution of aerosols. There are already many regional studies on the vertical characterization of optical prop-erties based on lidar systems (e. g. Papayannis et al., 2008). However, the characteri-zation of the microphysical properties profiles is still not so straightforward, due to the
20
complexity of the retrievals. Algorithms designed to combine lidar and sun-photometer measurements have been developed in order to overcome this difficulty (e.g. LIdar
Radiometer Inversion Code, LIRIC, Chaikovsky et al., 2008, 2012) and Generalized Aerosol Retrieval from Radiometer and Lidar Combined data, GARRLIC (Lopatin et al., 2013). The combination of simultaneous information about the aerosol vertical
struc-25
Wag-ACPD
15, 32831–32887, 2015Aerosol microphysical properties profiles during ChArMEx 2012
M. J. Granados-Muñoz et al.
Title Page
Abstract Introduction
Conclusions References
Tables Figures
◭ ◮
◭ ◮
Back Close
Full Screen / Esc
Printer-friendly Version Interactive Discussion
Discussion
P
a
per
|
Discussion
P
a
per
|
Discussion
P
a
per
|
Discussion
P
a
per
|
ner et al., 2013; Granados-Muñoz et al., 2014, 2015; Papayannis et al., 2014; Bini-etoglou et al., 2015). The increasing number of stations performing these simultaneous measurements foresees an optimistic future concerning the increasing spatial cover-age.
Regional studies in the Mediterranean region are of huge scientific interest since
5
multiple studies indicate that aerosol radiative forcing over the Mediterranean region is one of the largest in the world (Lelieveld et al., 2002; IPCC, 2013). In this con-text, the ChArMEx (the Chemistry-Aerosol Mediterranean Experiment, http://charmex. lsce.ipsl.fr/) (Dulac et al., 2014) international project involving several Mediterranean countries aims at developing and coordinating regional research actions for a
scien-10
tific assessment of the present and future state of the atmospheric environment in the Mediterranean Basin, and of its impacts on the regional climate, air quality, and marine biogeochemistry. The ChArMEx project organized a field campaign between 25 June and 12 July 2012, in order to address interactions such as long range transport and air quality, and aerosol vertical structure and sources. The period of the campaign falls
15
within the ACTRIS (Aerosols, Clouds, and Trace Gases Research Infrastructure Net-work) summer 2012 campaign (8 June–17 July 2012) that aimed at giving support to both ChArMEx and EMEP (European Monitoring and Evaluation Programme) (Espen Yttri et al., 2012) field campaigns. Within the ACTRIS summer 2012 campaign, the European lidar network (EARLINET) (Pappalardo et al., 2014) performed a controlled
20
exercise of feasibility to demonstrate its potential to perform operational, coordinated measurements (Sicard et al., 2015). The exercise consisted of continuous lidar mea-surements during a 72 h period in July 2012 at different European sites. Most of those
lidar data have been successfully assimilated by a regional particulate air quality model to improve 36 h operational aerosol forecasts both in terms of surface PM and aerosol
25
optical depth (Wang et al., 2014).
ACPD
15, 32831–32887, 2015Aerosol microphysical properties profiles during ChArMEx 2012
M. J. Granados-Muñoz et al.
Title Page
Abstract Introduction
Conclusions References
Tables Figures
◭ ◮
◭ ◮
Back Close
Full Screen / Esc
Printer-friendly Version Interactive Discussion
Discussion
P
a
per
|
Discussion
P
a
per
|
Discussion
P
a
per
|
Discussion
P
a
per
|
Temporal evolution of the aerosol microphysical properties is also analysed when the continuity of the inverted data is available. Up to our knowledge, it is the first time that LIRIC algorithm is applied in a continuous and automated way to retrieve simultane-ous and continusimultane-ous data acquired at different stations, proving the algorithm capability
to provide reliable microphysical properties information with high spatial and temporal
5
resolution. In addition, this exceptional aerosol observational database is used for the spatio-temporal evaluation of different regional mineral dust models
2 Measurement strategy
During the summer of 2012, an intensive measurement campaign was performed in the framework of ChArMEx and EMEP in the Mediterranean Basin at twelve
ground-10
based lidar stations throughout Europe. The main aim of these measurements was to obtain an experimental vertically-resolved database for investigating aerosol radiative impacts over the Mediterranean basin using 3-D regional climate models. The exten-sive lidar database acquired during this campaign combined with AERONET regular measurements represents a unique opportunity to evaluate the performance of LIRIC
15
microphysical inversion retrieval during the event in both temporal and spatial (hori-zontal and vertical) coordinates, proving the utility of combined measurements and the potential of LIRIC algorithm for routinary aerosol microphysical properties measure-ments.
The measurement campaign consisted in 72 h of continuous and simultaneous lidar
20
measurements performed at twelve European stations, with eleven out of them partic-ipating in ACTRIS/EARLINET (Sicard et al., 2015). The measurement period started on 9 July at 06:00 UTC and lasted until 12 July 2012 at 06:00 UTC, in coincidence with a forecast mineral dust event over the Mediterranean basin according to dust transport models.
25
LIRIC algorithm requires lidar data at least in 3 different wavelengths and
ACPD
15, 32831–32887, 2015Aerosol microphysical properties profiles during ChArMEx 2012
M. J. Granados-Muñoz et al.
Title Page
Abstract Introduction
Conclusions References
Tables Figures
◭ ◮
◭ ◮
Back Close
Full Screen / Esc
Printer-friendly Version Interactive Discussion
Discussion
P
a
per
|
Discussion
P
a
per
|
Discussion
P
a
per
|
Discussion
P
a
per
|
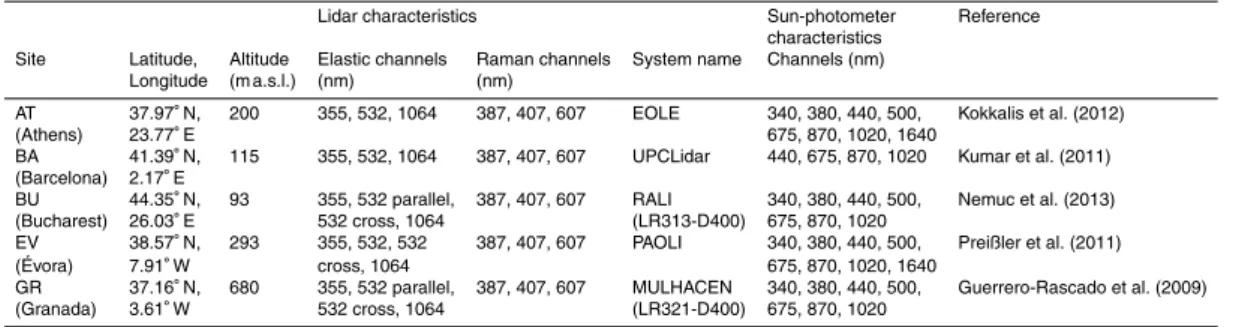
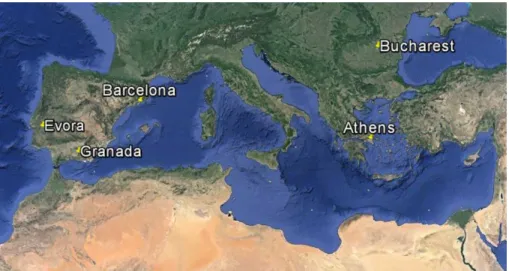
profiles. Therefore, to evaluate the performance of LIRIC algorithm and characterize the distribution and temporal evolution of the aerosol microphysical properties during the event, only those stations where multiwavelenght lidar data at 3 wavelengths and AERONET data were available for the period 9–11 July were selected. Namely, those stations were Athens (AT), Barcelona (BA), Bucharest (BU), Évora (EV) and Granada
5
(GR) (Fig. 1). The main characteristics of each station are included in Table 1.
All the five stations are part of both EARLINET and AERONET networks. Thus, these five stations are equipped with at least a multiwavelength lidar and a sun photometer. Multiwavelength lidar systems are used in this study to measure vertical profiles of the atmospheric aerosol properties. Lidar systems in all these five stations emit and
10
receive at least at three different wavelengths (355, 532 and 1064 nm), with the
sys-tems in Granada, Bucharest and Évora including depolarization capabilities at 532 nm (Table 1). Depolarization information can be used in the retrieval of the aerosol mi-crophysical properties profiles with LIRIC to distinguish between coarse spherical and coarse spheroid mode.
15
Stations are also equipped with collocated standard sun photometers CIMEL CE-318-4, used in the AERONET network. AERONET retrieval algorithm provides atmo-spheric aerosol properties integrated in the atmoatmo-spheric vertical column (Dubovik and King, 2000; Dubovik et al., 2006). The automatic tracking sun and sky scanning ra-diometer makes sun direct measurements with a 1.2◦ full field of view every 15 min at
20
different nominal wavelengths, depending on the station (Table 1). These solar
extinc-tion measurements are used to compute aerosol optical depth (τλ) at each wavelength except for the 940 nm channel, which is used to retrieve total column water vapour (or precipitable water) (Estellés et al., 2006; Pérez-Ramírez et al., 2012). The estimated uncertainty in computed τλ, due primarily to calibration uncertainty, is around 0.01–
25
ACPD
15, 32831–32887, 2015Aerosol microphysical properties profiles during ChArMEx 2012
M. J. Granados-Muñoz et al.
Title Page
Abstract Introduction
Conclusions References
Tables Figures
◭ ◮
◭ ◮
Back Close
Full Screen / Esc
Printer-friendly Version Interactive Discussion
Discussion
P
a
per
|
Discussion
P
a
per
|
Discussion
P
a
per
|
Discussion
P
a
per
|
3 Methodology
3.1 Retrieval of aerosol properties from remote sensing measurements
The analysis of aerosol microphysical properties profiles is performed with LIRIC algo-rithm. Details about LIRIC retrieval algorithm and its physical basics can be found in previous studies (Chaikovsky et al., 2012, 2015; Kokkalis et al., 2013; Wagner et al.,
5
2013; Granados-Muñoz et al., 2014, 2015; Perrone et al., 2014; Binietoglou et al., 2015), but a brief description is included here for completeness. LIRIC provides pro-files of atmospheric aerosol microphysical properties from atmospheric aerosol colum-nar optical and microphysical properties retrieved from direct sun and sky radiance measurements from the sun-photometer using AERONET code (Version 2, Level 1.5)
10
(Dubovik and King, 2000; Dubovik et al., 2006) and measured lidar elastic backscat-ter signals at three different wavelengths (355, 532 and 1064 nm). If available, also
the 532nm cross-polarized signal is used. Raw lidar data used for this analysis have been prepared accordingly to the EARLINET Single Calculus Chain (SCC), described in detail in D’Amico et al. (2015). From the combination of all this data, volume
concen-15
tration profilesCv(zn) are obtained for fine and coarse aerosol particles. The use of
the 532-nm cross-polarized lidar channel allows for distinguishing between spherical and non-spherical particles within the coarse fraction of the aerosol. The uncertainty in LIRIC retrievals associated to the input data is not yet well described, but the algorithm has proven to be very stable and the variations in the output profiles associated to the
20
user-defined input parameters are below 20 % (Granados-Muñoz et al., 2014).
3.2 Model description and validation strategy
Models of dust emission, transport and deposition are used as a tool to understand the various aspects that control the distribution and impact of dust. While global models of the dust cycle are used to investigate dust at large scales and long-term changes,
re-25
ACPD
15, 32831–32887, 2015Aerosol microphysical properties profiles during ChArMEx 2012
M. J. Granados-Muñoz et al.
Title Page
Abstract Introduction
Conclusions References
Tables Figures
◭ ◮
◭ ◮
Back Close
Full Screen / Esc
Printer-friendly Version Interactive Discussion
Discussion
P
a
per
|
Discussion
P
a
per
|
Discussion
P
a
per
|
Discussion
P
a
per
|
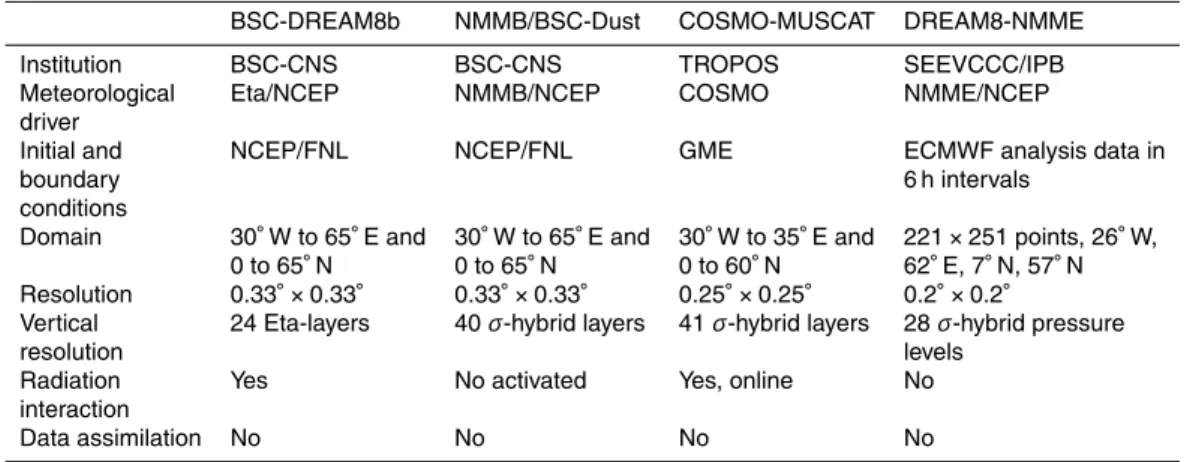
distribution as well as individual dust events. The analysis of the aerosol microphysi-cal properties with LIRIC using ChArMEx comprehensive database was used here for the evaluation of a set of 4 regional mineral dust models. This model evaluation was performed for both the vertical and horizontal coordinates and the temporal evolution.
Firstly, the spatial distribution of the mineral dust was examined by using the
experi-5
mental data from the five EARLINET/AERONET sites considered in the present study. Dust optical depth (at 550 nm) provided by four different regional mineral dust
mod-els (BSC-DREAM8b, NMMB/BSC-Dust, DREAM8-NMME and the regional version of COSMO-MUSCAT) was used at this stage. Experimental data were used here just to corroborate the presence or non-presence of mineral dust at the different regions and
10
periods indicated by the models.
BSC-DREAM8b and DREAM8-NMME models are based on the Dust Regional At-mospheric Model (DREAM), originally developed by Nickovic et al. (2001). The main feature of the updated version of the model, BSC-DREAM8b (version 2), include an 8-bins size distribution within the 0.1–10 µm radius range according to Tegen and
15
Lacis (1996), radiative feedbacks (Pérez et al., 2006a, b) and upgrades in its source mask (Basart et al., 2012). BSC-DREAM8b model provides daily dust forecasts at Barcelona Supercomputing Center-Centro Nacional de Supercomputación (BSC-CNS, http://www.bsc.es/projects/earthscience/BSC-DREAM/). The model has been exten-sively evaluated against observations (see, e.g. Basart et al., 2012b). DREAM8-NMME
20
model (Vukovic et al., 2014), driven by the NCEP Nonhydrostatic Mesoscale Model on E-grid (Janjic et al., 2001), provides daily dust forecasts available at the South East European Virtual Climate Change Center (SEEVCCC; http://www.seevccc.rs/).
NMMB/BSC-Dust model (Pérez et al., 2011; Haustein et al., 2012) is a regional to global dust forecast operational system developed and maintained at BSC-CNS. It is
25
ACPD
15, 32831–32887, 2015Aerosol microphysical properties profiles during ChArMEx 2012
M. J. Granados-Muñoz et al.
Title Page
Abstract Introduction
Conclusions References
Tables Figures
◭ ◮
◭ ◮
Back Close
Full Screen / Esc
Printer-friendly Version Interactive Discussion
Discussion
P
a
per
|
Discussion
P
a
per
|
Discussion
P
a
per
|
Discussion
P
a
per
|
saltation and sandblasting processes. It includes an 8-bin size distribution and radiative interactions. NMMB/BSC-Dust model has been evaluated at regional and global scales (Pérez et al., 2011; Haustein et al., 2012; Gama et al., 2015).
BSC-DREAM8b, NMMB/BSC-DDUST and DREAM8-NMME models are participat-ing in the World Meteorological Organization Sand and Dust Storm Warnparticipat-ing
Advi-5
sory and Assessment System (WMO SDS-WAS) Northern Africa-Middle East-Europe (NAMEE) Regional Center (http://sds-was.aemet.es//). Additionally, NMMB/BSC-Dust is the model that provides operational dust forecast in the first Regional Specialized Meteorological Center with activity specialization on Atmospheric Sand and Dust Fore-cast, the Barcelona Dust Forecast Center (BDFC; http://dust.aemet.es/).
10
On the other hand, COSMO-MUSCAT is an online coupled model system based on a different philosophy: COSMO is a non-hydrostatic and compressible meteorological
model which solves the governing equations on the basis of a terrain-following grid (Schättler et al., 2008; Baldauf et al., 2011), whereas MUSCAT is a chemistry transport model that treats the atmospheric transport as well as chemical transformations for
15
several gas phase species and particle populations using COSMO output data (Knoth and Wolke, 1998; Wolke et al., 2012). More details about COSMO-MUSCAT model can be found elsewhere (Schepanski et al., 2007, 2009; Heinold et al., 2009; Laurent et al., 2010; Tegen et al., 2013).
The spatial resolution, domain size, initial and boundary conditions, differ, in
addi-20
tion to the different physical parameterizations implemented in the models. Details on
the individual mineral dust models and their respective model configurations evaluated here are summarized in Table 2.
Modelled mineral dust mass concentration profiles provided by the previous mod-els were compared with LIRIC output profiles in order to evaluate the model
perfor-25
mance on the vertical coordinate. The temporal evolution of the modelled vertical pro-files was evaluated in more detail only at Granada, which was the station most affected
ACPD
15, 32831–32887, 2015Aerosol microphysical properties profiles during ChArMEx 2012
M. J. Granados-Muñoz et al.
Title Page
Abstract Introduction
Conclusions References
Tables Figures
◭ ◮
◭ ◮
Back Close
Full Screen / Esc
Printer-friendly Version Interactive Discussion
Discussion
P
a
per
|
Discussion
P
a
per
|
Discussion
P
a
per
|
Discussion
P
a
per
|
needed to obtain mass concentration. This conversion factor was the density of the aerosol particles, namely 2.65 g cm−3 for the coarse mode (1–10 µm) and 2.5 g cm−3
(0.1–1 µm) for the fine mode (Pérez et al., 2006a, b). In addition, the initial vertical res-olution of the different models and LIRIC was established to a common value of 100 m,
in order to obtain a compromise between the loss of information from LIRIC and from
5
the different models, following a similar procedure to that in Binietoglou et al. (2015).
After this processing, mineral dust mass concentration profiles provided by BSC-DREAM8b, NMMB/BSC-DUST, DREAM8-NMME and COSMO-MUSCAT models were evaluated against LIRIC results in those cases when mineral dust was detected. For the comparison, the fine mode was assumed to be fine mineral dust since it is not
10
possible to distinguish which part of the fine mode corresponds to dust or non-dust particles with LIRIC. This assumption may cause an overestimation of the mineral dust concentration that becomes more important in those cases with high concentrations of the fine mode (which was not the case in our study). Alternative methods, such as POLIPHON (Polarization-lidar photometer networking) method, could be applied to
15
overcome this difficulty (Mamouri and Ansmann, 2014), but this is out of the scope of
our study.
In our study, model output profiles were retrieved every 3 h and compared to LIRIC retrievals during the three analyzed days. Only daytime data are presented here (from 06:00 to18:00 UTC) because of the limitations of LIRIC retrieval during night-time. Due
20
to the difficulties of the models to correctly represent the convective processes
occur-ring within the planetary boundary layer and PBL-free troposphere interactions and the photochemical reactions producing secondary aerosols at the considered resolution, the lowermost part of LIRIC profiles (affected by these processes) was not considered
in the comparison presented here. Only data between 2000 m a.s.l., which is the mean
25
ACPD
15, 32831–32887, 2015Aerosol microphysical properties profiles during ChArMEx 2012
M. J. Granados-Muñoz et al.
Title Page
Abstract Introduction
Conclusions References
Tables Figures
◭ ◮
◭ ◮
Back Close
Full Screen / Esc
Printer-friendly Version Interactive Discussion
Discussion
P
a
per
|
Discussion
P
a
per
|
Discussion
P
a
per
|
Discussion
P
a
per
|
In order to quantify the model agreement with the total dust load observed in the profiles, the dust mass concentration from the different profiles was integrated between
2 and 8 km a.s.l. Relative differences were calculated according to Eq. (1), where nis
the number of height levels and Cmass (zn) is the dust mass concentration at each
height levelzn:
5
RD=100×
P
n
Cmodelmass(zn)−CmassLIRIC(zn)/CLIRICmass(zn)
n (1)
The altitude of the center of mass of the dust column (Cm) is calculated according to Eq. (2), wherezmin andzmaxare 2 and 8 km a.s.l. respectively:
Cm=100×
Rzmax
zminznCmass(zn)dzn Rzmax
zminCmass(zn)dzn
(2)
A detailed comparison of BSC-DREAM8b, NMMB/BSC-DUST, DREAM8-NMME
10
dust mass concentration profiles with LIRIC results was performed in Binietoglou et al. (2015) using additional stations and selected case studies for the period 2011– 2013. However, due to the characteristics of ChArMEx database this study goes a step further and a validation of the mass concentration profiles temporal evolution of a spe-cific mineral dust event is presented for the first time.
15
4 Results
4.1 Spatial–temporal characterization of aerosol microphysical properties
during ChArMEx/EMEP 2012
During the 72 h intensive measurement period, information from different models,
plat-forms and instrumentation was available. A detailed characterization of the situation
ACPD
15, 32831–32887, 2015Aerosol microphysical properties profiles during ChArMEx 2012
M. J. Granados-Muñoz et al.
Title Page
Abstract Introduction
Conclusions References
Tables Figures
◭ ◮
◭ ◮
Back Close
Full Screen / Esc
Printer-friendly Version Interactive Discussion
Discussion
P
a
per
|
Discussion
P
a
per
|
Discussion
P
a
per
|
Discussion
P
a
per
|
above the Mediterranean Basin during the campaign regarding aerosol properties us-ing the different resources available is presented in the following subsections.
Charac-terization of the column-integrated properties is presented in the first place, followed by the analysis of the vertical distribution.
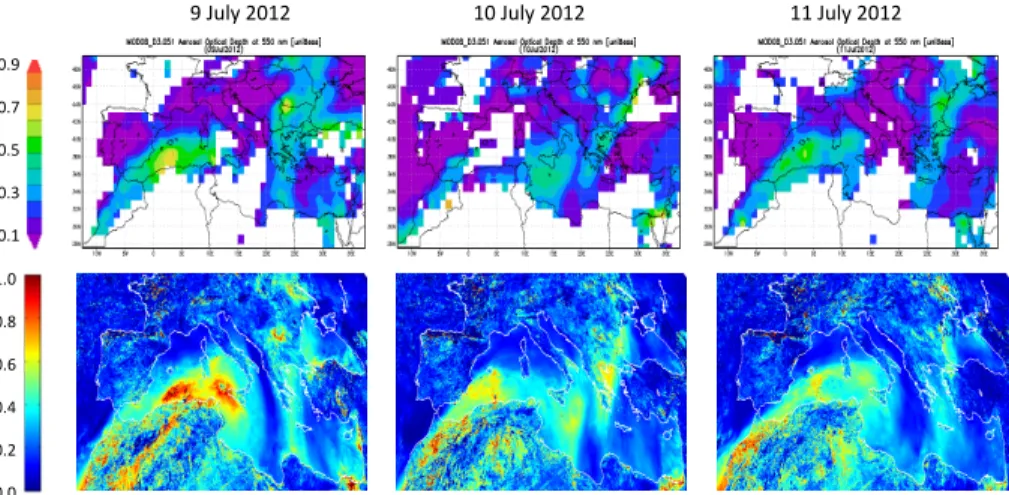
4.1.1 Satellite and column-integrated model forecasts
5
Aerosol optical products from satellite information were used to obtain a general overview of the mineral dust event. Figure 2 shows the standard aerosol optical depth product retrieved using the dark-target approach from MODIS/Terra (Remer et al., 2005 and references therein) and the AERUS-GEO from MSG/SEVIRI (Carrer et al., 2014) for the three analysed days (9–11 July 2012).
10
Satellite data evidenced the presence of an aerosol plume extending from the North African coast towards the East with higher aerosol load, as τλ values from MODIS sensor indicate, mainly affecting the South-East of the Iberian Peninsula and the South
of Italy (Fig. 2). A different aerosol plume can be observed above the Balkans area.
The pathways of the aerosol plumes suggested by satellite data are in agreement with
15
both the meteorological analyses of ECMWF and HYSPLIT air mass trajectories based on GDAS analysed meteorological fields at 2 km a.g.l. presented in the study by Wang et al. (2014). The air masses were moving from Spain and Portugal to the East whereas in the Balkans region they were moving southwards.
τ550 nm data simulated by BSC-DREAM8b, DREAM8-NMME NMMB/BSC-Dust and
20
COSMO-MUSCAT are shown in Fig. 3, where it is observed that a dust event was affecting a large region in the western Mediterranean basin. Granada station was
af-fected by the mineral dust outbreak during the whole analyzed period according to the four models. The stations of Évora and Barcelona were not affected by the dust event
according to BSC-DREAM8b, DREAM8-NMME and NMMB/BSC-Dust, even though
25
re-ACPD
15, 32831–32887, 2015Aerosol microphysical properties profiles during ChArMEx 2012
M. J. Granados-Muñoz et al.
Title Page
Abstract Introduction
Conclusions References
Tables Figures
◭ ◮
◭ ◮
Back Close
Full Screen / Esc
Printer-friendly Version Interactive Discussion
Discussion
P
a
per
|
Discussion
P
a
per
|
Discussion
P
a
per
|
Discussion
P
a
per
|
gion, the station of Athens was affected by the mineral dust during the three days
according to DREAM8-NMME model and COSMO-MUSCAT, only on 10 July accord-ing to NMMB/Dust and on 10 and 11 July accordaccord-ing to DREAM8b. BSC-DREAM8b foresaw no influence of the mineral dust over Bucharest, whereas accord-ing to DREAM8-NMME the station was at the edge of the mineral dust plume on
5
10 and 11 July. NNMB/BSC-DUST indicated a slight presence of mineral dust over Bucharest on, 10 July and COSMO-MUSCAT forecast mineral dust during the three days, with larger loads on 10 and 11 July. In general, it can be observed that larger aerosol loads were forecast by DREAM8-NMME and COSMO-MUSCAT models than by BSC-DREAM8b and NMMB/BSC-Dust. Besides, the different models forecast the
10
dust plume leaving the North of Africa and moving towards the East, as also indicated by satellite data. However, the decrease inτ550 nmvalues with time observed with satel-lite data is not well captured by the different models.
4.1.2 Ground-based measurements
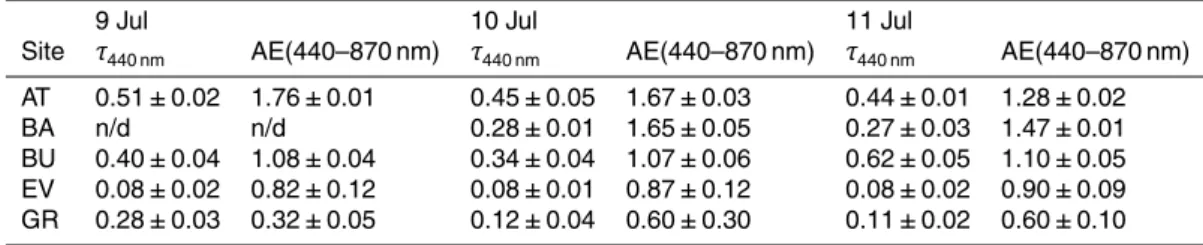
Data provided by the ground-based instrumentation were also used for the study.
Fig-15
ure 4 shows the time series of the τ440 nm and AE(440–880 nm) obtained with the AERONET sun photometers for the selected five stations during the analysed period and mean values for each day and station are indicated in Table 3.
According to these data, the lowest values ofτ440 nmwere measured at Évora station during the whole period, with values below 0.18. The AE(440–880 nm) was close to
20
one, except in the early morning and late evening, when it decreased down to∼0.5.
These values, together with the columnar volume size distributions observed in Fig. 4c indicates a very low aerosol load, mostly related to aerosol from local sources, and no impact of the North African aerosol plume arriving at the Iberian Peninsula. This is in agreement with the information provided satellites and the set of models, except
25
COSMO-MUSCAT.
ACPD
15, 32831–32887, 2015Aerosol microphysical properties profiles during ChArMEx 2012
M. J. Granados-Muñoz et al.
Title Page
Abstract Introduction
Conclusions References
Tables Figures
◭ ◮
◭ ◮
Back Close
Full Screen / Esc
Printer-friendly Version Interactive Discussion
Discussion
P
a
per
|
Discussion
P
a
per
|
Discussion
P
a
per
|
Discussion
P
a
per
|
τ440 nm values were between 0.10 and 0.20, except for the late afternoon of 10 July
from 17:00 UTC, when the aerosol load decreased and τ440 nm below 0.10 were ob-served. On the contrary, values of the AE(440–870 nm) were increasing from 0.3 on 9 July up to 0.7 on 11 July, with maximum values on the late evening on the 10 July (AE(440–870 nm) >1). It is worthy to note that the AE(440–870 nm) was below 0.5
5
during the whole period except for the late afternoon on 10 July, in coincidence with the decrease inτ440 nm, indicating a clear predominance of coarse particles (e. g. Pérez et al., 2006a; Basart et al., 2009; Valenzuela et al., 2014). The columnar volume size distributions for the different days agreed with these data. Data from the 9 July showed
a very large coarse mode and a small contribution of fine particles. The contribution
10
of fine particles is almost constant during the three days, whereas the coarse mode is decreasing with time. There was a predominance of the coarse mode during the whole period, with maximum values of 0.13 µm3µm−2 during the first day. All these data are usually related to the presence of mineral dust in the station and the temporal evolution of the analyzed properties clearly suggest a decrease of the mineral dust event
inten-15
sity throughout the analysed period and a possible mixing or aging of the mineral dust. Models in Fig. 3 correctly forecast the arrival of mineral dust above the station, even though they underestimated the aerosol load.
At Barcelona station no AERONET data were available on 9 July. During 10 and 11 July,τ440 nm values were relatively high and quite constant (around 0.30) and the
20
AE(440–870 nm) values were larger than 1.5, indicating a strong contribution of fine aerosol particles. In the columnar volume size distributions, similar values for the fine and coarse mode were observed on the 10 July, but larger values of the fine mode were obtained on 11 July. Therefore, it can be inferred from these data that the impact of the North African aerosol plume was almost negligible at this station. It is worthy to
25
note that only COSMO-MUSCAT model forecast a slight presence of dust.
In Athens and Bucharest the aerosol plume presented very different characteristics
ACPD
15, 32831–32887, 2015Aerosol microphysical properties profiles during ChArMEx 2012
M. J. Granados-Muñoz et al.
Title Page
Abstract Introduction
Conclusions References
Tables Figures
◭ ◮
◭ ◮
Back Close
Full Screen / Esc
Printer-friendly Version Interactive Discussion
Discussion
P
a
per
|
Discussion
P
a
per
|
Discussion
P
a
per
|
Discussion
P
a
per
|
In this region, largeτ440 nmvalues (>0.35) and large values of the AE(440–870 nm)
suggested a situation with high aerosol load mainly composed of fine particles. At Athens bothτ440 nm and AE(440–870 nm) values were very constant during the three analysed days, except for a slight decrease of the AE(440–870 nm) on 11 July (from
∼1.70 to ∼1.30). This is in agreement with the columnar volume size distributions
5
(Fig. 4c), where a slight increase of the coarse mode was observed on 11 July when compared to 9 and 10 July. In the case of Bucharest, τ440 nm was almost constant on 9 and 10 July (around 0.37), but increased on 11 July (over 0.60). The AE(440– 870 nm) was almost constant around 1.10 during the three days, indicating a balanced presence of coarse and fine particles. The columnar volume size distributions were
10
very similar to those of Athens on 9 and 10 July, but larger presence of fine particles was observed here on 11 July. According to these sun-photometer data, the aerosol plume over this region was not composed of mineral dust particles, even though low concentrations of mineral dust might have been advected over Athens on 11 July. Therefore, COSMO-MUSCAT dust simulations do not match well the measurements
15
over Athens and Bucharest, whereas the BSC-DREAM8b, NNMB/BSC-DUST and DREAM8-NMME models correctly predicted the situation above Bucharest, but not above Athens station.
4.1.3 Aerosol vertical distribution
Figure 5 shows the time series of the lidar range-corrected signal (RCS) in arbitrary
20
units at 532 nm (at 1064 nm in Athens) for the 72 h period at the different stations.
From these plots, it is clearly observed that at Barcelona and Évora the aerosol load was mainly confined within the planetary boundary layer and the time series reveal the evolution of the planetary boundary layer height. Therefore, it is expected that most of the aerosol particles were from local origin. However, at the rest of the stations
25
a more complex vertical structure was observed and the presence of lofted aerosol layer reaching up to 6 km a.s.l. at some periods indicated the advection of different
ACPD
15, 32831–32887, 2015Aerosol microphysical properties profiles during ChArMEx 2012
M. J. Granados-Muñoz et al.
Title Page
Abstract Introduction
Conclusions References
Tables Figures
◭ ◮
◭ ◮
Back Close
Full Screen / Esc
Printer-friendly Version Interactive Discussion
Discussion
P
a
per
|
Discussion
P
a
per
|
Discussion
P
a
per
|
Discussion
P
a
per
|
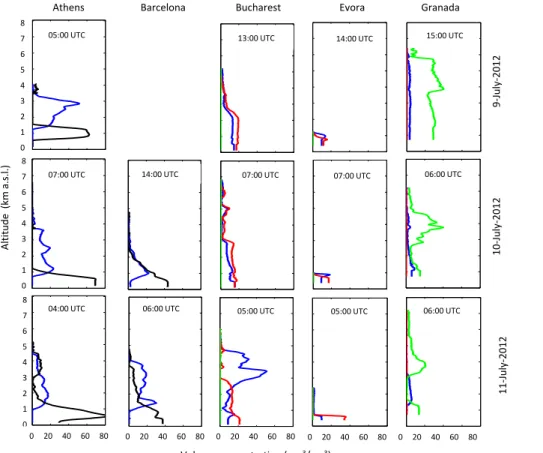
The aerosol microphysical properties profiles retrieved with LIRIC for different
pe-riods at the different stations are shown in Fig. 6. Namely, the volume concentration
profiles of the total coarse mode and the fine mode were retrieved at Barcelona and Athens, whereas the volume concentration profiles of fine, coarse spherical and coarse spheroid mode were retrieved at Évora, Bucharest and Granada because of the
avail-5
ability of depolarization information.
At Évora it was clearly observed that the aerosol was located below 1000 m a.s.l., within the planetary boundary layer, and concentrations were very low, ranging from 25 to 46 µm cm−3. At Granada a clear predominance of the coarse spheroid mode in concentrations up to 50 µm3cm−3 and reaching altitudes around 6000 m a.s.l. was
ob-10
served, related to a strong presence of mineral dust. Concentrations were decreasing with time and a small contribution of fine particles was also observed during the three days. At Barcelona, the coarse mode particles were predominant in the height range between the surface and 1000 m a.s.l. on 10 July and a similar concentration of fine and coarse particles was observed between 1000 and 2500 m a.s.l. However, on 11 July an
15
aerosol layer dominated by fine particles with a slight presence of coarse particles was observed between 2000 and 4000 m a.s.l. The 5 day backward trajectories analysis performed with HYSPLIT model (Draxler and Rolph, 2003) for Barcelona station (not shown) together with the information of the models previously presented indicates that this upper layer might be related to a faint presence of mineral dust. However, this could
20
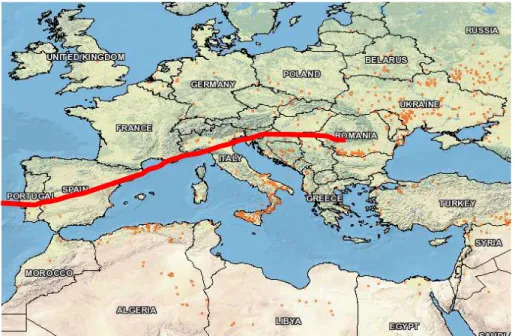
also be linked to the presence of biomass burning from the Eastern Iberian Peninsula (see Fig. 7). Depolarization information would be crucial here to discriminate the origin of the aerosol particles arriving at this height above Barcelona. At Athens station the aerosol reached up to 5000 m a.s.l. The coarse mode was located below 2000 m a.s.l., whereas a predominance of fine particles was observed at higher altitudes. The top
25
sta-ACPD
15, 32831–32887, 2015Aerosol microphysical properties profiles during ChArMEx 2012
M. J. Granados-Muñoz et al.
Title Page
Abstract Introduction
Conclusions References
Tables Figures
◭ ◮
◭ ◮
Back Close
Full Screen / Esc
Printer-friendly Version Interactive Discussion
Discussion
P
a
per
|
Discussion
P
a
per
|
Discussion
P
a
per
|
Discussion
P
a
per
|
tion, probably related to the arrival of mineral dust indicated by the models at the end of the period. Backward trajectories analysis with HYSPLIT (not shown) also revealed a change in the trajectory of the air masses arriving at 3500 m a.s.l. which would explain the presence of mineral dust on 11 July. At Bucharest, similar volume concentration of fine and coarse particles was observed on 9 and 10 July. The observed coarse
parti-5
cles were spherical according to LIRIC; therefore the presence of mineral dust at this region can be totally neglected. On 11 July a strong increase of the fine mode volume concentration was observed between 2500 and 5000 m a.s.l. suggesting the advec-tion of an aerosol plume dominated by fine particles at this altitude. Again, this is in agreement with the optical properties presented in Sicard et al. (2015), where a larger
10
spectral dependence (related to finer particles) is observed at Bucharest station in the height range between 3 and 4 km a.s.l., and with the predictions of the dust models participating in the study. As suggested in the study by Sicard et al. (2015) this large spectral dependence of the backscatter coefficient could be originated by the presence
of fine particles related to the advection of smoke. The combined information provided
15
by backward trajectories analysis and MODIS FIRMS comes to confirm the presence of active fires along the air masses paths arriving at Bucharest on 11 July (Fig. 7).
The use of the depolarization information as input in LIRIC in the stations of Bucharest, Évora and Granada provided additional information. In the cases of Bucharest and Granada, this information turned out to be very useful for the
char-20
acterization of the aerosol types and their distribution in the vertical coordinates. The differences in the aerosol type were already evidenced in the columnar volume size
dis-tributions retrieved by AERONET code (Fig. 4), and here LIRIC confirmed that these two stations presented really different situations. The volume concentration profiles
re-trieved with LIRIC indicated a predominance of the spheroid mode in Granada and
25
a predominance of spherical particles in Bucharest, highlighting very different aerosol
ACPD
15, 32831–32887, 2015Aerosol microphysical properties profiles during ChArMEx 2012
M. J. Granados-Muñoz et al.
Title Page
Abstract Introduction
Conclusions References
Tables Figures
◭ ◮
◭ ◮
Back Close
Full Screen / Esc
Printer-friendly Version Interactive Discussion
Discussion
P
a
per
|
Discussion
P
a
per
|
Discussion
P
a
per
|
Discussion
P
a
per
|
the coarse mode was related to non-spherical particles, usually associated to min-eral dust, or to spherical particles, usually present in cases of anthropogenic pollution or aged smoke. Therefore, here we have a clear example of the importance and the potential of the depolarization measurements in the vertical characterization of the aerosol particles.
5
4.2 Temporal evolution of the aerosol microphysical properties profiles
The continuous analysis of the aerosol microphysical properties profiles during the three days provided very valuable information about the dynamics of the aerosol lay-ers. Because of the uninterrupted lidar measurements at Granada from 12:00 UTC on 9 July 2012 to 00:00 UTC on 12 July and the frequent AERONET retrievals due to
10
good weather conditions a more detailed analysis was performed at this station. A to-tal of 60 different LIRIC retrievals were performed based on 60 lidar datasets and 21
AERONET inversion products.The retrieval of microphysical properties was performed using 30 min averaged lidar data (in order to reduce noise on the lidar profiles) and the closest in time AERONET retrieval, considering only those data with time differences
15
lower than three hours.
Besides, Granada station was affected by a mineral dust event during the whole
period as already shown in previous sections. This fact is of special interest since the retrieval of the mineral dust microphysical is not so straightforward and they are not so well characterized. Up to our knowledge not many comprehensive studies on dust
20
microphysical properties vertical profiles have been performed (Tsekeri et al., 2013; Wagner et al., 2013; Granados-Muñoz et al., 2014; Noh, 2014) because of the difficulty
of the retrievals due to different factors, e. g. the high temporal variation and
non-uniform distribution of dust aerosol concentration around the globe (Sokolik and Toon, 1999; Formenti et al., 2011), mineral dust highly irregular shape and the chemical and
25
physical transformations dust suffers during its transport (Sokolik and Toon, 1999; Chen
ACPD
15, 32831–32887, 2015Aerosol microphysical properties profiles during ChArMEx 2012
M. J. Granados-Muñoz et al.
Title Page
Abstract Introduction
Conclusions References
Tables Figures
◭ ◮
◭ ◮
Back Close
Full Screen / Esc
Printer-friendly Version Interactive Discussion
Discussion
P
a
per
|
Discussion
P
a
per
|
Discussion
P
a
per
|
Discussion
P
a
per
|
The dust outbreak analysed here started over Granada station on 7 July in 2012 as indicated by sun-photometer data and the model forecast from previous days (not shown). Thus, it was already well developed when the intensive measurement period started. The presence of mineral dust was correctly forecasted by the different models
as depicted in Fig. 3. However, they did not correctly capture the intensity and the
5
temporal evolution of the event. The 5 day backward trajectories analysis performed with HYSPLIT model indicated that the air masses arriving at Granada on 9 and 11 July came from Africa passing by the North African coast above 2500 m a.s.l. and from the North Atlantic Ocean through South-western Iberian Peninsula below this altitude (Fig. 8). On 10 July the air masses came from the central part of Sahara desert through
10
the North African coast for heights above 5000 m a.s.l., from the Atlantic Ocean going along the coast of Africa between 2500 and 5000 m a.s.l. and from the North Atlantic Ocean overpassing South-western Iberian Peninsula below 2500 m a.s.l.
Figure 9 shows the time series of the volume concentration profiles retrieved with LIRIC. It is clearly observed that the dust event was decreasing its intensity along the
15
whole study period with the largest aerosol concentrations for the coarse spheroid mode retrieved on 9 July (∼35 µm3cm−3) and the lowest concentrations on 11 July
(∼15 µm3cm−3), in agreement with AERONET data and model predictions. Maximum
values of total volume concentration were around 60 µm3cm−3 on 9 July. There was a strong predominance of the coarse spheroid mode during the whole period with
max-20
imum values on 9 July in the afternoon, reaching values up to 55 µm3cm−3. Some fine
particles were also observed, with larger volume concentrations during the first day (∼10 µm3cm−3). For this first day of measurements, fine particles reached altitudes
around 6000 m a.s.l., whereas on 10 and 11 July larger volume concentration values were confined to the lowermost region from surface up to 3 km a.s.l. The presence of
25
ACPD
15, 32831–32887, 2015Aerosol microphysical properties profiles during ChArMEx 2012
M. J. Granados-Muñoz et al.
Title Page
Abstract Introduction
Conclusions References
Tables Figures
◭ ◮
◭ ◮
Back Close
Full Screen / Esc
Printer-friendly Version Interactive Discussion
Discussion
P
a
per
|
Discussion
P
a
per
|
Discussion
P
a
per
|
Discussion
P
a
per
|
masses overpassed North African industrial areas before reaching Granada. However, it is also well known that mineral dust emissions produce a submicronic size mode (e.g. Gomes et al., 1990; Alfaro and Gomes, 2001). Depolarization lidar observations over the Mediterranean have illustrated that irregularly shaped fine dust particles sig-nificantly contribute to aerosol extinction over the boundary layer during dust transport
5
events (Mamouri and Ansmann, 2014). A more detailed analysis with additional data (e.g. chemical components measurements, single scattering albedo profiles) would be needed in order to come to a quantitative attribution of soil dust and anthropogenic particles to the fine mode.
The contribution of the fine mode in the lowermost part may be due mainly to
anthro-10
pogenic sources of local origin. From 11 July around 12:00 UTC up to the end of the study period, an increase in the coarse spherical mode concentration was observed. This increase of the coarse spherical mode was associated with a decrease of the particle linear depolarization profilesδ532 nmp obtained from the lidar data according to Bravo-Aranda et al. (2013) as shown in Fig. 10. On 9 July the values of δ532 nmp were
15
around 0.30 in the layer between 3 and 5 km a.s.l. These values are representative of pure Saharan dust (Freudenthaler et al., 2009). However, they decreased down to 0.25 during the following days, indicating either a possible mixing of dust particles with anthropogenic aerosols or aging processes affecting the mineral dust. During 11 July,
the decrease in the fine mode in coincidence with the increase in the coarse spherical
20
mode could be associated to the aging of the mineral dust particles and aggregation processes. On 10 July this behaviour was also faintly observed in the late afternoon.
According to δ532 nmp profiles the mineral dust layer was clearly located above 2500 m a.s.l. or even at higher altitudes depending on the analysed period (see Fig. 10). Below this altitude, values were lower indicating more contribution of anthropogenic
25
ACPD
15, 32831–32887, 2015Aerosol microphysical properties profiles during ChArMEx 2012
M. J. Granados-Muñoz et al.
Title Page
Abstract Introduction
Conclusions References
Tables Figures
◭ ◮
◭ ◮
Back Close
Full Screen / Esc
Printer-friendly Version Interactive Discussion
Discussion
P
a
per
|
Discussion
P
a
per
|
Discussion
P
a
per
|
Discussion
P
a
per
|
distribution of the modes or the sphericity, which according to the results presented in previous studies (Wagner et al., 2013; Granados-Muñoz et al., 2014), is an issue that needs to be carefully considered in the analysis of the results retrieved with LIRIC algorithm.
4.3 Evaluation of the mineral dust models mass concentration vertical profiles
5
Mineral dust mass concentration profiles provided by the BSC-DREAM8b, NMMB/BSC-Dust, DREAM8-NMME and COSMO-MUSCAT models were evaluated against LIRIC results at Granada in order to evaluate their performance regarding ver-tical distribution and temporal evolution.
In general, the four models tended to underestimate LIRIC values and to locate the
10
aerosol load at higher altitudes compared to remote sensing results (Figs. 11 and 12). If we analyze the different periods, on 9 July, with τ
440 nm values around 0.3,
a good agreement in the layer between 2500–6000 m a.s.l. for the NMMB/BSC-Dust model was observed. On 10 and 11 July, whenτ440 nm values were decreasing down to 0.1, lower agreement was observed for the four analyzed models. A good
perfor-15
mance of DREAM8-NMME was observed at 06:00 UTC of 10 July, withτ440 nm∼0.2,
whereas NMMB/BSC-Dust showed an un-realistic increasing maximum at 5000 m a.s.l. at 15:00 and 18:00 UTC. However, this maximum was very similar to the one provided by LIRIC between 06:00 and 12:00 UTC. Therefore, it could be due to a time shift of the model when compared to the LIRIC values. It is worthy to note that BSC-DREAM8b
20
and NMMB/BSC-Dust use NCEP/FNL data as initial conditions, whereas COSMO-MUSCAT and DREAM8b-NMME use ECWMF, being this a possible cause of the delay in the BSC models. Nonetheless, a more exhaustive analysis with a more compre-hensive database would be needed to confirm this hypothesis. COSMO-MUSCAT was showing an increase in the mineral dust load during the analyzed period and a
max-25
ACPD
15, 32831–32887, 2015Aerosol microphysical properties profiles during ChArMEx 2012
M. J. Granados-Muñoz et al.
Title Page
Abstract Introduction
Conclusions References
Tables Figures
◭ ◮
◭ ◮
Back Close
Full Screen / Esc
Printer-friendly Version Interactive Discussion
Discussion
P
a
per
|
Discussion
P
a
per
|
Discussion
P
a
per
|
Discussion
P
a
per
|
concentrations during the afternoon on 11 July 2012. Taking the vertical resolution of the model into account, the simulation matches well with the LIRIC concentration pro-file on 11 July. BSC-DREAM8b provided larger values on the 9 July than on 10 and 11 July, as observed also in the experimental data, but it underestimated the aerosol load during the three studied days.
5
Simulated and observed integrated dust mass concentration values are compared in Fig. 12. On both 10 and 11 July during the afternoon, NMMB/BSC-DUST presented lower differences with LIRIC values and it followed a similar trend to the one observed
with LIRIC, with higher values during 9 July decreasing during 10 and 11. DREAM8-NMME and BSC-DREAM8b presented much lower values than LIRIC during the whole
10
analysed period, whereas COSMO-MUSCAT underestimated the aerosol load on 9 and 11 July but overestimated it on 11. In the histogram in Fig. 12d, the relative diff
er-ence between the different models and LIRIC are presented.
More than 70 % of the data for the four models presented a negative diff
er-ence because of the underestimation of the mass concentration of the profiles
(ex-15
cept for COSMO-MUSCAT), as already observed in Fig. 12a. In the case of BSC-DREAM8b, 80 % of the data had a relative difference in the range between −90 and −30 %, whereas for DREAM8-NMME the range was between −98 and −49 %. For
NMMB/BSC-Dust, 80 % of the data were between−97 and 20 % (27 % of the data were
overestimating LIRIC values). In the case of COSMO-MUSCAT, 50 % of the data
over-20
estimated LIRIC values. In spite of this differences in the mass concentration values,
if we focus on the vertical structure of the mineral dust layers provided by the different
models we can see that the agreement is quite better. In Fig. 12, it is also depicted the determination coefficient, R2, which was ranging between 0.01 and 0.84. The largest
values were obtained with COSMO-MUSCAT during most of the periods, whereas the
25
ACPD
15, 32831–32887, 2015Aerosol microphysical properties profiles during ChArMEx 2012
M. J. Granados-Muñoz et al.
Title Page
Abstract Introduction
Conclusions References
Tables Figures
◭ ◮
◭ ◮
Back Close
Full Screen / Esc
Printer-friendly Version Interactive Discussion
Discussion
P
a
per
|
Discussion
P
a
per
|
Discussion
P
a
per
|
Discussion
P
a
per
|
et al. (2015) selected mineral dust events with higher aerosol load (τ440>0.15) were
presented whereas in this study the continuous evolution of the dust event was ana-lyzed withτ440ranging between 0.07 and 0.40.R2was larger than 0.5 only for 17.5 % of the analyzed profiles and the highest correlation was obtained when the aerosol load was higher. Therefore, models seem to show a better performance in cases of higher
5
aerosol load.
The location of the center of mass,Cm, which is also an indicator of the vertical dis-tribution of the dust mass concentration, is similar in the case of LIRIC and the models (Fig. 12). Despite the models were capable to reproduce the temporal evolution ofCm, in general they tended to locate the dust load at higher altitudes, as indicated by the
10
larger values ofCm obtained. During this event, BSC-DREAM8b model presented the lowest differences with LIRIC regardingC
mheight.Cmvalues determined by
DREAM8-NMME model were also very similar to the ones provided by LIRIC on 9 and 10 July but much higher values were obtained on the 11 July, when the mineral dust load was much lower. COSMO-MUSCAT presented lower discrepancies on day 9 and the
15
mornings of 10 and 11 July, whilst NMMB/BSC-Dust presented larger values during the whole period. These results are comparable to those in the study by Binietoglou et al. (2015).
Regarding the discrepancies with LIRIC in the vertical coordinate, Fig. 13 shows that for BSC-DREAM8b, NMMB/BSC-DUST and COSMO-MUSCAT the smallest
rel-20
ative differences in the mass concentration, even though the largest variability, were
obtained around 3500 and 4500 m a.s.l. In the cases of NMMB/BSC-Dust and COSMO-MUSCAT, large discrepancies were observed in the upper layer, above 5 km a.s.l. BSC-DREAM8b and DREAM8-NMME underestimated LIRIC values in the whole profile, whereas NMMB/BSC-Dust underestimated LIRIC values below 4.5 km and
overesti-25
ACPD
15, 32831–32887, 2015Aerosol microphysical properties profiles during ChArMEx 2012
M. J. Granados-Muñoz et al.
Title Page
Abstract Introduction
Conclusions References
Tables Figures
◭ ◮
◭ ◮
Back Close
Full Screen / Esc
Printer-friendly Version Interactive Discussion
Discussion
P
a
per
|
Discussion
P
a
per
|
Discussion
P
a
per
|
Discussion
P
a
per
|
Model profiles were also obtained at the stations of Athens, Barcelona, Bucharest and Évora in order to evaluate their performance at stations where there is a slight or no presence of mineral dust. At Athens (Fig. S1 in the Supplement) almost negligible mass concentration values were forecast by the different models, with the exception
of DREAM8-NMME. This model indicated the presence of mineral dust in mass
con-5
centrations up to 100 µg m−3 reaching 4000 m a.s.l. on 10 July and up to 65 µg m−3 on the 11 July which is not in agreement with LIRIC results. In spite of the disagree-ment, it is worthy to point out that the dust layer observed at Athens between 3000 and 5000 m a.s.l. on 11 July according to LIRIC data was correctly forecast by the different
models. At Barcelona station (Fig. S2 in the Supplement), DREAM8-NMME were not in
10
agreement with the experimental results since it forecasted dust mass concentrations of up to 100 µg m−3and located below 2000 m a.s.l. At Bucharest (Fig. S3 in the Sup-plement), large dust concentrations were forecasted between 3000 and 7000 m a.s.l. by BSC-DREAM8b, DREAM8-NMME and NMMB/BSC-Dust on 9 July. On 10 and 11 July the dust load forecasted by the models was much lower, even though it reached up
15
to 50 µg m−3. This is not in agreement with our experimental results since only coarse spherical and fine particles were observed and no mineral dust should be forecasted here. Finally, at Évora station (Figs. S4 in the Supplement), DREAM8-NMME fore-casted dust mass concentration lower than 10 µg m−3 below 2000 m a.s.l. COSMO-MUSCAT forecasted similar concentrations above 2000 m a.s.l. These mass
concen-20
tration values are almost negligible and therefore good agreement can be considered. In general, good results were provided by the different models at the five stations.
However, DREAM8-NMME seems to be overestimating the dust mass concentrations at those stations affected by aerosol types different to mineral dust.
The analysis of the causes for the discrepancies between the models and LIRIC
25
is out of the scope of this study. Understanding the differences between the models
and the observations would require wider databases with higher temporal and spatial coverage in order to cover the different aspects of the model calculations (e.g. mineral