www.atmos-chem-phys.net/14/6049/2014/ doi:10.5194/acp-14-6049-2014
© Author(s) 2014. CC Attribution 3.0 License.
Impact of data quality and surface-to-column representativeness on
the PM
2
.
5
/ satellite AOD relationship for the contiguous
United States
T. D. Toth1, J. Zhang1, J. R. Campbell2, E. J. Hyer2, J. S. Reid2, Y. Shi1, and D. L. Westphal2 1Department of Atmospheric Sciences, University of North Dakota, Grand Forks, ND, USA
2Aerosol and Radiation Sciences Section, Marine Meteorology Division, Naval Research Laboratory, Monterey, CA, USA
Correspondence to:J. Zhang ([email protected])
Received: 15 October 2013 – Published in Atmos. Chem. Phys. Discuss.: 3 December 2013 Revised: 23 April 2014 – Accepted: 5 May 2014 – Published: 20 June 2014
Abstract.Satellite-derived aerosol optical depth (AOD) ob-servations have been used to estimate particulate matter smaller than 2.5 µm (PM2.5). However, such a relation-ship could be affected by the representativeness of satellite-derived AOD to surface aerosol particle mass concentration and satellite AOD data quality. Using purely measurement-based methods, we have explored the impacts of data quality and representativeness on the AOD-inferred PM2.5/ AOD re-lationship for the contiguous United States (CONUS). This is done through temporally and spatially collocated data sets of PM2.5and AOD retrievals from Aqua/Terra Moderate Res-olution Imaging Spectroradiometer (MODIS), Multi-angle Imaging Spectroradiometer (MISR), and Cloud-Aerosol Li-dar with Orthogonal Polarization (CALIOP). These analyses show that improving data quality of satellite AOD, such as done with data assimilation-grade retrievals, increases their correlation with PM2.5. However, overall correlation is rela-tively low across the CONUS. Also, integrated extinction ob-served within 500 m above ground level (a.g.l.), as measured by CALIOP, is not well representative of the total column AOD. Surface aerosol in the eastern CONUS is better corre-lated with total column AOD than in the western CONUS. The best correlation values are found for estimated dry mass CALIOP extinction at 200–300 m a.g.l. and PM2.5, but addi-tional work is needed to address the ability of using actively sensed AOD as a proxy for PM2.5concentrations.
1 Introduction
of using Moderate Resolution Imaging Spectroradiometer (MODIS; Remer et al., 2005) AOD as an estimate for PM10 concentration. Several studies have focused on correlating satellite AOD observations and PM2.5 concentrations (e.g., Wang and Christopher, 2003; Liu et al., 2004), and advances have been made improving correlation between the two by considering other meteorological and environmental parame-ters, such as the surface mixed-layer height (Engel-Cox et al., 2006; Gupta et al., 2006) and relative humidity (Shinozuka et al., 2007; Van Donkelaar et al., 2010). Simulated vertical structure from chemical transport models (e.g., Van Donke-laar et al., 2006; 2010) has also been used to help improve the PM2.5/ satellite AOD relationship.
There are important issues, however, that need be con-sidered when applying satellite-based observations in gen-eral, much less as a proxy for PM2.5 estimates. First, un-certainties exist in satellite-retrieved AOD values due to is-sues such as cloud contamination, inaccurate optical mod-els used in the retrieval process, and heterogeneous surface boundary conditions (e.g., Zhang and Reid, 2006; Shi et al., 2011a; Toth et al., 2013). Even today, convergence has not yet been reached for retrieved AOD values found among the most widely used satellite aerosol products, such as the Dark Target (DT)/DeepBlue (DB) MODIS and Multi-angle Imag-ing Spectroradiometer (MISR; Diner et al., 1998; Kahn et al., 2010) aerosol products (e.g., Shi et al., 2011b). Any es-timate of PM2.5derived from satellite AOD data cannot be more accurate than the AOD data themselves. Thus, relation-ships between AOD and PM2.5are likely to be highly sensor-product specific. Second, AOD derived from passive sensors is a column-integrated value, and PM2.5 concentration is a surface measurement. Under conditions where aerosol parti-cles are concentrated primarily within the surface/boundary layer, AOD is presumably a likelier proxy for PM2.5 concen-tration. Conversely, in conditions where aerosol plumes are transported above the boundary layer, AOD will likely prove a weaker one. Finally, AOD is a column-integrated sum of total ambient particle extinction, whereas PM2.5is measured with respect to dried particles ingested for analysis by corre-sponding instruments. Thus, hygroscopicity and mass extinc-tion efficiency correcextinc-tions are further required to accurately characterize any relationship present between the two param-eters.
While some studies have attempted to use chemical trans-port models and ground-based lidars to investigate a relation-ship between aerosol particle structure, column-integrated AOD and surface-based PM2.5(Liu et al., 2004; Van Donke-laar et al., 2006; Boyouk et al., 2010; Hyer and Chew, 2010), a measurement-based analysis using the Cloud-Aerosol Li-dar with Orthogonal Polarization (CALIOP; Winker et al., 2007; Hunt et al., 2009) would allow for such a study over relatively broad spatial and temporal scales, for which more tenable proxies between AOD and PM2.5may be realized and thus applied on more representative scales. Range-resolved information collected with CALIOP provides the critical
per-spective for relating the depth and vertical extent of aerosol particle presence to both surface-based PM2.5measurements and passive retrievals of column-integrated AOD.
This paper differs from past research efforts in several aspects. For one, the impact of passive satellite AOD data quality on the PM2.5/ satellite AOD relationship has yet to be investigated. Secondly, while other studies have consid-ered the aerosol vertical distribution during estimation of PM2.5 from satellite AOD retrievals, this has not been ex-amined over large spatial and temporal domains. Lastly, to the best of our knowledge, near-surface aerosol extinction from CALIOP has never been evaluated as a potential proxy for surface PM2.5concentrations. Therefore, through the use of MODIS, MISR, and CALIOP observations, the following research questions are considered:
1. How does the quality of passive satellite AOD retrievals impact the PM2.5/ AOD relationship?
2. Based on CALIOP data, how representative are surface-based measurements to aerosol particle presence within the full column?
3. Can near surface observations from CALIOP be used as a better proxy for PM2.5concentration?
The paper has been designed to discuss each component se-quentially, thus building off the previous step. In Sect. 2 of this paper, we describe the various satellite and surface-based data sets used. In Sect. 3, the PM2.5/ AOD relationship is first examined at an hourly time scale, followed by a daily anal-ysis in which we explore the impact of AOD quality on this relationship. In Sect. 4, we investigate the representativeness of satellite-derived surface aerosol concentration to that of the entire column, and how well surface AOD correlates with total column AOD. Lastly, in Sect. 5 we provide results com-paring surface-based PM2.5and CALIOP aerosol extinction near the lower bounds of the satellite profile to investigate the potential use of CALIOP data for air quality applications.
2 Data sets
2.1 MODIS, MISR, and CALIOP data
parameter flags of “very good”. Although the DB MODIS aerosol products also provide aerosol retrievals over land, the Collection 5.1 Aqua/Terra DB MODIS aerosol products are not available for the study period and are thus not included in the study.
MISR, aboard the Terra satellite, is a unique spectrora-diometer, able to collect observations at nine different view-ing angles, providview-ing a means for studyview-ing aerosol parti-cle size and shape (Diner et al., 1998). MISR features four spectral bands, located at 0.446, 0.558, 0.672, and 0.867 µm. Different from the DT MODIS aerosol products, the MISR aerosol product also includes AOD retrievals over bright sur-faces such as desert regions. Kahn et al. (2005) suggested that 70 % of MISR AOD data are within 0.05 (or 20 % ×AOD) of sun-photometer-measured AOD values. This study utilizes the same 2 years (2008–2009) of AOD derived from version 22 MISR retrievals (0.558 µm), flagged through QA screen-ing as “successful”.
CALIOP is a multiwavelength (0.532 and 1.064 µm) polarization lidar flown aboard the Cloud-Aerosol Lidar and Infrared Pathfinder Satellite Observations (CALIPSO) platform within the NASA “A-Train” constellation (e.g., Stephens et al., 2002). To gain an understanding of aerosol particle distribution over the contiguous United States (CONUS) for the period 2008–2009, this study utilizes the version 3.01 CALIOP Level 2, 5 km aerosol profile (L2_05kmAProf) (Winker et al., 2007, 2013) product. The version 3.01 Level 2 vertical feature mask (L2_VFM) prod-uct is also used to restrict the analysis to those 5 km AOD and total extinction (at 0.532 µm) profile retrievals that are cloud-free, in a manner consistent with that of Toth et al. (2013). Additionally, only daytime CALIOP data are used in this study.
2.2 Quality-assured MODIS and MISR subsets
Existing uncertainties in passive satellite AOD retrievals, such as those for MODIS and MISR, are optimally sup-pressed before being considered and applied for data assim-ilation (DA) activities involving operational aerosol forecast models (e.g., Zhang et al., 2008). Through rigid QA, reduced AOD uncertainties have been characterized and DA-quality AOD data sets have been created for both over-land (Hyer et al., 2011) and over-ocean MODIS DT products (Shi et al., 2011a), as well as the MISR aerosol products (Shi et al., 2011b, 2012). In this study, we use DA-quality MODIS and MISR AOD products as control data sets for comparison with operational MODIS and MISR products.
Available at 6-hourly 1◦×1◦resolution, DA-quality AOD data are converted to daily averages and then compared with daily PM2.5 concentrations. For comparison purposes with the PM2.5data available (described further below), we have constructed daily averaged “Level 3” AOD data using op-erational MODIS and MISR aerosol products after apply-ing first-order QA as described in Sect. 2.1. DA-quality
MODIS aerosol products are available from the Global Ocean Data Assimilation Experiment (GODAE) server (http: //www.usgodae.org/). However, no quality-assured hourly DA-quality aerosol products are currently available, and no comparisons were therefore made between the DA-quality products and hourly PM2.5measurements.
2.3 Surface PM2.5
The US EPA has collected observations of surface-based PM since the passage of the Clean Air Act in 1970 (http://www. epa.gov/air/caa/). In 1997, the EPA began specifically mon-itoring PM2.5 concentrations (Federal Register, 2006). The Federal Reference Method (FRM), a filter-based method, is used to measure concentration over a continuous 24 h period. The filter is weighed before and after the sample collection interval and PM2.5mass concentration (µg m−3) is calculated by dividing the total mass of PM2.5 particles by the vol-ume of air sampled (Federal Register, 1997). Some EPA sites also report hourly (continuous) PM2.5 measurements. For this study, 2 years (2008–2009) of daily and hourly PM2.5 local conditions (EPA parameter code 88101) data were used and obtained from the EPA Air Quality System (AQS).
2.4 AERONET
AERONET is a worldwide ground-based network of sun photometers that provides measurements of aerosol optical properties, and is currently used as the benchmark for valida-tion of satellite AOD retrievals. AERONET AOD is reported at eight channels (0.34–1.64 µm), and has an uncertainty of 0.01–0.015 (Holben et al., 1998). For the purposes of this study, AOD derived at 0.67 µm is used.
3 How does the quality of passive satellite AOD retrievals impact their linear correlation with surface-based PM2.5?
As a first step, linear correlations between passive satellite AOD retrievals and PM2.5 observations in the CONUS are derived. We investigate the impact of data quality to the AOD / PM2.5relationship through a daily analysis using both daily averaged operational and DA-quality AOD data sets, as well as daily PM2.5data. No hourly DA-quality AOD re-trievals are currently available, and therefore the impact of data quality to the AOD / PM2.5correlations are not specif-ically characterized on this temporal scale. Still, an hourly analysis is first considered, using only operational AOD data and hourly PM2.5 data, for comparison purposes and for establishing a relevant context for the relationship between AOD and PM2.5.
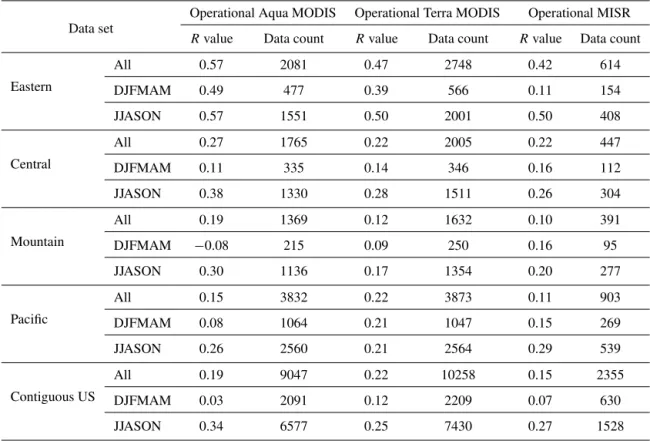
Table 1.Correlation coefficients and data counts of the daily 1◦×1◦average operational/DA Aqua/Terra MODIS and MISR AOD/daily PM2.5collocation analyses for the eastern, central, mountain, and Pacific time zones and contiguous United States total for the entire two-year (2008–2009) study period, from December to May 2008–2009 (DJFMAM), and June to November 2008–2009 (JJASON).
Data set
Operational Aqua MODIS Operational Terra MODIS Operational MISR
Rvalue Data count Rvalue Data count Rvalue Data count
Eastern
All 0.57 2081 0.47 2748 0.42 614
DJFMAM 0.49 477 0.39 566 0.11 154
JJASON 0.57 1551 0.50 2001 0.50 408
Central
All 0.27 1765 0.22 2005 0.22 447
DJFMAM 0.11 335 0.14 346 0.16 112
JJASON 0.38 1330 0.28 1511 0.26 304
Mountain
All 0.19 1369 0.12 1632 0.10 391
DJFMAM −0.08 215 0.09 250 0.16 95
JJASON 0.30 1136 0.17 1354 0.20 277
Pacific
All 0.15 3832 0.22 3873 0.11 903
DJFMAM 0.08 1064 0.21 1047 0.15 269
JJASON 0.26 2560 0.21 2564 0.29 539
Contiguous US
All 0.19 9047 0.22 10258 0.15 2355
DJFMAM 0.03 2091 0.12 2209 0.07 630
JJASON 0.34 6577 0.25 7430 0.27 1528
(see figure caption for color scheme). Note that some sites feature multiple instruments observing PM2.5concentration; one routine/primary, regular measurement and a secondary measurement that is only available sporadically. Both types of PM2.5data are included for this analysis.
3.1 Hourly analysis
For the period 2008–2009, the operational Level-2 AOD data sets are spatially and temporally collocated with avail-able PM2.5 observations. After these AOD data are filtered through basic QA screening (Sect. 2.1), each hourly PM2.5 observation is matched with those Level-2 AOD retrievals meeting the QA criteria and found within 40 km and 1 h of the PM2.5 observation. All remaining AOD values are then averaged for a single comparison with the PM2.5 observa-tion. We chose 40 km as the averaging range for the satellite data after assuming a mean wind speed of 10 m s−1 influ-encing aerosol plume transport (approximately 40 km h−1). AOD autocorrelation at or exceeding 0.8 has been reported for a distance of 40 km (on average) (Anderson et al., 2003; Zhang et al., 2011), making this a reasonable constraint.
Table 1 summarizes the results of the hourly collocation of 40 km/1 h average MODIS/MISR AOD with corresponding ground-based PM2.5measurements over the two year study,
including linear correlation coefficients and data counts for the CONUS divided into its four respective time zones: east-ern (coordinated universal time, UTC−5), central (UTC−6), mountain (UTC−7), and Pacific (UTC−8). Relatively low correlations are found for the CONUS, as a whole. However, a regional dependence of the relationship between the two parameters is also apparent. The eastern CONUS region ex-hibits higher correlation than does the Pacific CONUS by a factor of approximately two (0.2 vs. 0.4). This is consistent with several studies that have shown similar regional effects. For example, Hu (2009) reports average PM2.5/ AOD cor-relations of 0.67 (eastern US) and 0.22 (western US), with Engel-Cox et al. (2004) and Paciorek et al. (2008) report-ing similar correlations of 0.6–0.8 (eastern US) and 0.2–0.4 (western US). It has been suggested that this regional vari-ability in the PM2.5/ AOD relationship is due to differences in topography, surface albedo, and boundary layer depth be-tween the eastern and western US (Engel-Cox et al., 2006).
Table 2. Correlation coefficients and data counts of the 40 km average operational Aqua/Terra MODIS and MISR AOD/hourly PM2.5 collocation analyses for the eastern, central, mountain, and Pacific time zones and contiguous United States total for the entire 2-year (2008– 2009) study period, from December to May 2008–2009 (DJFMAM), and June to November 2008–2009 (JJASON).
Data set
Aqua MODIS Terra MODIS MISR
Operational DA Operational DA Operational DA
R Data R Data R Data R Data R Data R Data
value count value count value count value count value count value count
Eastern
All 0.40 76 194 0.50 29 682 0.38 80 810 0.51 38 725 0.32 15 526 0.50 10 949
DJFMAM 0.23 30 615 0.31 12 180 0.23 32 492 0.35 15 166 0.20 6819 0.37 4829
JJASON 0.45 43 837 0.56 17 123 0.44 45 839 0.55 22 723 0.37 8194 0.55 5750
Central
All 0.39 39 942 0.47 18 584 0.36 40 824 0.51 21 084 0.30 8396 0.46 6256
DJFMAM 0.27 15 892 0.31 7507 0.22 15 853 0.29 8130 0.23 3536 0.35 2549
JJASON 0.45 23 217 0.55 10 708 0.44 23 979 0.57 12 506 0.33 4649 0.53 3551
Mountain
All 0.09 14 160 0.21 5007 0.07 15 597 0.13 6313 0.04 3455 0.06 2489
DJFMAM 0.06 4788 0.00 1180 0.04 5258 −0.04 1463 −0.01 1385 −0.05 782
JJASON 0.13 9178 0.30 3775 0.13 10 078 0.29 4793 0.12 1974 0.16 1659
Pacific
All 0.13 21 871 0.33 11 446 0.12 22 405 0.33 11 470 0.16 4639 0.27 3625
DJFMAM 0.00 9110 0.08 4218 −0.03 9308 0.08 4265 0.06 2047 0.16 1509
JJASON 0.24 12 310 0.44 7107 0.24 12 470 0.43 7011 0.27 2431 0.37 2025
Contiguous US
All 0.31 152 167 0.43 64 719 0.29 159 636 0.45 77 592 0.26 32 016 0.40 23 319
DJFMAM 0.15 60 405 0.21 25 085 0.12 62 911 0.22 29 024 0.15 13 787 0.26 9669
JJASON 0.40 88 542 0.52 38 713 0.39 92 366 0.52 47 033 0.34 17 248 0.48 12 985
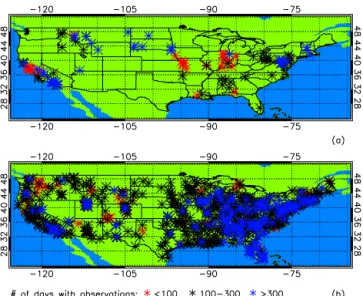
Figure 1.For the period 2008–2009, US EPA sites with available PM2.5measurements at(a)hourly and(b)daily intervals, respec-tively. The sites are color-coded based on number of days with ob-servations as red (fewer than 100), black (between 100 and 300), or blue (greater than 300).
and Terra MODIS in Table 1, we show only the Terra MODIS/MISR analysis in Fig. 2 because of their common satellite-observing platform. In general, a better correlation is found for the bin averages, which is consistent with that reported by Gupta et al. (2006).
Seasonally, each of the hourly PM2.5/ AOD correlation co-efficients shown in Table 1 are recomputed for December through May (Table 1; DJFMAM) and June through Novem-ber (Table 1; JJASON). There are fewer data points for DJF-MAM than JJASON (∼68 % decrease), enhanced by the ab-sence of December 2007 in the data set (this month was not included in the analysis due to the lack of PM2.5local condi-tions data, EPA parameter code 88101, before 2008). Over-all, however, lower correlations are found during this season compared with the annual mean. The opposite is thus true for JJASON. Although not shown here, further analysis reveals that higher correlations of JJASON may be due to a signif-icant number of cases of relatively high PM2.5(greater than 35 µg m−3) and high satellite AOD (greater than 0.3) that oc-cur during this season, relative to DJFMAM, which may pos-itively influence the regression compared with JJASON.
3.2 Daily analysis
Figure 2. Two-year (2008–2009) scatterplots of operational Terra MODIS (in light blue) and MISR (in red) AOD, averaged within 40 km of each respective PM2.5-monitoring site, versus hourly PM2.5concentrations for the(a)eastern and(b) Pacific US time zones. Also plotted are averages of PM2.5for each 0.1 AOD bin, represented with triangles (in dark blue) for Terra MODIS and squares (in orange) for MISR. Error bars (±1 standard deviation) for the bin averages are also shown.
operational satellite AOD data sets, using only basic QA, ver-sus the DA-quality Level 3 AOD data. As discussed above, these latter data are subject to more advanced screening, with filtering, correction, and spatial aggregation applied. Each available daily ground-based PM2.5 observation is matched with both the operational and DA-quality AOD retrievals found within 1◦latitude/longitude and the day of the PM2.5 observation. Results of the daily 1◦×1◦ operational and DA-quality MODIS/MISR AOD analyses are shown for the CONUS and each respective time zone in Table 2.
Distinct increases are found for the PM2.5/ AOD corre-lation using the DA-quality satellite AOD products versus the operational satellite AOD data sets (Table 2). For exam-ple, PM2.5/ AOD correlations for the CONUS increase by about 0.12 (Aqua MODIS), 0.16 (Terra MODIS), and 0.14 (MISR) from each respective operational to DA-quality data set. Note that data counts for each DA-quality AOD
analy-Figure 3.Two-year (2008–2009) scatterplots of daily 1◦×1◦DA Terra MODIS (in light blue) and daily 1◦×1◦MISR (in red) AOD versus daily PM2.5concentrations for the(a)eastern and(b)Pacific US time zones. Averages of PM2.5are plotted for each 0.1 AOD bin, represented with triangles (in dark blue) for Terra MODIS and squares (in orange) for MISR. Error bars (±1 standard deviation) for the bin averages are also shown.
sis decrease relative to each corresponding operational AOD analysis, indicative of fewer available collocations from the Level 3 AOD data sets from increased data rejection. We be-lieve that such a pronounced pattern reflects the influence of AOD retrieval quality from the passive satellites on their re-lationship with surface-based PM2.5measurements.
Also shown in Table 2, the eastern sample exhibits greater linearity (i.e., correlation) overall compared with the west-ern one. Figure 3 further illustrates the regional variation in PM2.5/ DA AOD correlation, through corresponding scatter-plots for the eastern (Fig. 3a) and Pacific (Fig. 3b) time zones. As in Fig. 2, we only show the Terra MODIS/MISR analysis because of their common platform. Also, averages of PM2.5 concentrations are shown for each 0.1 bin of DA TERRA and MISR AOD.
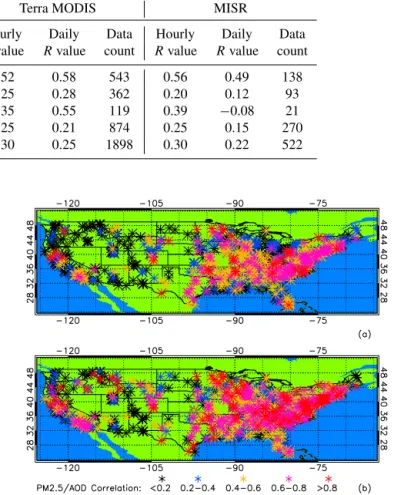
Table 3.Correlation coefficients and data counts for the hourly PM2.5/ 40 km average operational AOD and daily PM2.5/ 1◦×1◦average DA AOD common point analyses for the eastern, central, mountain, and Pacific time zones and contiguous United States total for the two-year (2008–2009) study period.
Data set Aqua MODIS Terra MODIS MISR
Hourly Daily Data Hourly Daily Data Hourly Daily Data Rvalue Rvalue count Rvalue Rvalue count Rvalue Rvalue count
Eastern 0.63 0.54 369 0.52 0.58 543 0.56 0.49 138 Central 0.29 0.20 305 0.25 0.28 362 0.20 0.12 93 Mountain 0.52 0.56 108 0.35 0.55 119 0.39 −0.08 21 Pacific 0.32 0.16 916 0.25 0.21 874 0.25 0.15 270 Contiguous US 0.36 0.20 1698 0.30 0.25 1898 0.30 0.22 522
Figure 4.For the period 2008–2009, the US EPA daily PM2.5sites used in this study. Sites are color-coded based on the correlation between daily PM2.5observations and daily 1◦×1◦(a)operational and(b)DA Terra MODIS AOD.
DJFMAM than JJASON (∼32 % decrease). Likewise, lower PM2.5/ AOD correlations are found during DJFMAM, and higher correlations are found from JJASON, as compared to the mean annual results presented in Table 2. Again, this pat-tern may be due to a larger number of high PM2.5(greater than 35 µg m−3) and high satellite AOD (greater than 0.3) values that are found from JJASON, as compared to DJF-MAM. However, a longer study period is likely needed to more appropriately understand the seasonal dependence of the PM2.5/ AOD relationship.
Figure 4 consists of two maps depicting daily PM2.5 sites used in this analysis, color coded with respect to the PM2.5/ AOD correlation coefficient. Figure 4a reflects the PM2.5/ daily operational Terra MODIS AOD relationship, with generally higher correlations in the eastern CONUS than the Pacific CONUS. Figure 4b also illustrates a clear increase in PM2.5/ AOD correlation for the daily DA Terra MODIS AOD analysis, with again still higher correlations
Figure 5.For the period 2008–2009, the US EPA daily PM2.5sites used in this study. Sites are color-coded based on the correlation between daily PM2.5observations and daily 1◦×1◦(a)operational and(b)DA MISR AOD.
for the eastern CONUS compared to those results found in the west. Similar regional and operational-to-DA AOD pat-terns in the PM2.5/ AOD relationship are shown in Fig. 5 for the operational MISR AOD (Fig. 5a) and DA MISR AOD (Fig. 5b) daily analyses.
Table 4. Correlation coefficients and data counts for the hourly PM2.5/ average AERONET AOD (0.67 µm) collocation analy-sis (AERONET AOD averaged within the hour and 0.3◦ lati-tude/longitude of an hourly PM2.5measurement) for the eastern, central, mountain, and Pacific time zones and contiguous United States total for the 2-year (2008–2009) study period.
Data set Rvalue Data count
Eastern 0.61 6596 Central 0.36 613 Mountain 0.16 2438 Pacific 0.54 512 Contiguous US 0.51 10 159
satellite sensor. While this common point study implies that operational AOD may be a better estimate of PM2.5than DA AOD, we note here that when only daily data are used (Ta-ble 2) there exists a distinct improvement in PM2.5estimation from the operational to DA AOD data sets. Thus, it is rea-sonable to expect further improvement in the PM2.5/ passive satellite AOD relationship through the use of hourly DA-quality AOD data sets. These data are currently not readily available, however, so this topic is left for a future study.
As a final step for Sect. 3, we examine the hourly PM2.5/ AERONET AOD relationship for the CONUS. AERONET AOD (0.67 µm) measurements found within 0.3◦ latitude/longitude and the hour of an hourly PM2.5 observa-tion were first averaged, and hourly PM2.5/ AERONET AOD correlations and data counts were then computed (Table 4). Similar to the results from the PM2.5/ satellite AOD analy-ses, a higher correlation is found for the eastern time zone (0.61) compared to the Pacific time zone (0.54). Also, the hourly PM2.5/ AERONET AOD correlations are generally higher than those between hourly PM2.5/ satellite AOD (Ta-ble 1). These findings are not surprising, as AERONET is considered the benchmark for validation of satellite AOD re-trievals.
4 How representative is the surface layer aerosol particle presence to the atmospheric column?
We have demonstrated that the quality of the AOD data sets investigated impacts any linear correlation apparent with ground-based PM2.5measurements. Next we explore the rep-resentativeness of aerosol particle presence near the surface to that of the atmospheric column. We use the CALIOP L2_05kmAProf product, featuring a vertical resolution of 60 m for altitudes below 20.2 km above mean sea level (MSL). Using the corresponding mean surface elevation re-ported with each profile, values of extinction coefficient and AOD (0.532 µm) are regridded linearly at 100 m resolution vertically from the surface (above ground level, or a.g.l.) to 8.2 km after a robust QA screening procedure takes place.
Figure 6. Two-year (2008–2009) 1◦×1◦ average CALIOP 0.532 µm extinction, relative to the number of cloud-free 5 km CALIOP profiles in each 1◦×1◦bin, for atmospheric layers a.g.l. of(a)0–500 m,(b)500–1500 m,(c)1500–2500 m, and(d)2500– 3500 m.
The details of this QA process are documented in past stud-ies (Kittaka et al., 2011; Campbell et al., 2012a; Toth et al., 2013; Winker et al., 2013). Only cloud-free profiles are con-sidered.
Shown in Fig. 6 are 1◦×1◦averages (relative to the num-ber of cloud-free 5 km CALIOP profiles in each 1◦× 1◦ re-gional bin) of 0.532 µm aerosol extinction coefficient for the 0.0–0.5 km layer (Fig. 6a), 0.5–1.5 km (Fig. 6b), 1.5–2.5 km (Fig. 6c) and 2.5–3.5 km a.g.l. (Fig. 6d), respectively. In gen-eral, extinction values observed in the lower atmospheric lay-ers (Figs. 6a, b) are larger than those observed in the elevated atmospheric layers (Fig. 6c, d). However, higher mean values are found nearer the surface in the eastern region (particularly the southeastern CONUS; Fig. 6a, b), while higher values are found at elevated heights in the west (Fig. 6c, d). These data indicate that, on average, aerosol particle distributions tend to be more concentrated near the surface in the east and more diffuse vertically in the west.
Figure 7.Two-year (2008–2009) 1◦×1◦average contribution per-centage of 0–500 m a.g.l. integrated CALIOP extinction to total column AOD (at 0.532 µm) relative to the number of cloud-free CALIOP profiles in each 1◦×1◦bin, for the contiguous United States.
Figure 8. From 2006 to 2011, fraction of CALIOP-integrated 0.532 µm extinction below 500 m a.g.l. for the contiguous United States.
as higher percentages are again found over the east versus the west. In general, however, AOD below 500 m a.g.l. accounts for only 30 % or less of the total column AOD across the CONUS. This indicates that it is necessary to have a priori knowledge of the ratio between near-surface-integrated ex-tinction to column-integrated AOD in order to better charac-terize the likely representativeness of applying satellite AOD as a proxy for surface PM2.5concentration.
Note that although integrated extinction over the lowest 500 m a.g.l. may not be representative of the total column AOD, it is possible that the correlation between the two could be high, and thus useful for satellite AOD / PM2.5 studies. Although not shown here, we also compute the 1◦×1◦ aver-age correlation between integrated extinction from the low-est 500 m a.g.l. and total column AOD. Globally, over land,
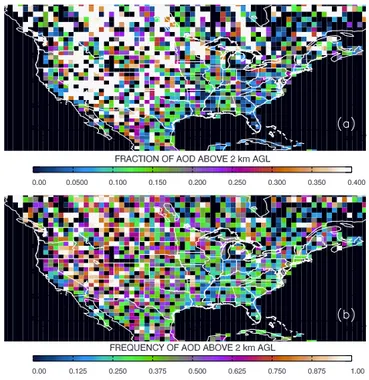
Figure 9.Two-year (2008–2009) 1◦×1◦average(a)contribution percentage of above 2 km a.g.l. CALIOP AOD to total column AOD (at 0.532 µm) and(b)frequency of occurrence of AOD above 2 km a.g.l., both relative to the number of cloud-free CALIOP pro-files in each 1◦×1◦bin, for the contiguous United States.
an average correlation of 0.61 is found. For the CONUS, a similar value of 0.62 is calculated, with values of 0.61 for the eastern time zone and 0.57 for the Pacific. Importantly, the lack of significant regional variability in these relation-ships indicates that although the eastern and Pacific time zones may exhibit different AOD surface contribution per-centages, integrated surface extinction correlates relatively consistently with total column AOD. Still, given a perfect possible correlation of 1 between integrated surface level ex-tinction and PM2.5 concentration, the correlation value of ∼0.6 between the former with column-integrated AOD might represent the best case scenario, on a regional average, that one could derive presently for the satellite AOD to PM2.5 concentration relationship. This agrees well with the findings reported in Hoff and Christopher (2009).
the east (usually below 30 %). Consistent with the find-ings shown in Fig. 9a, regional variations in the frequency of occurrence of AOD above 2 km a.g.l. are also observed (Fig. 9b), with generally higher frequencies in the west as compared to the east. The average frequency of occurrence of aerosol particle presence (as measured by CALIOP total column AOD) above 2 km a.g.l for the CONUS is ∼40 % (Fig. 9b). Also, about 20 % of data records (not shown) have at least 50 % of aerosol particle presence above 2 km a.g.l. This indicates that a significant number of elevated aerosol plumes occurred over the CONUS during the 2008–2009 pe-riod, and thus will not be recognized by surface-based PM2.5 measurements.
5 Can near surface observations from CALIOP be used as a better proxy for PM2.5concentration?
Taking advantage of an active-profiling aerosol particle sen-sor like CALIOP, we investigate the relationship between hourly PM2.5 concentration and CALIOP 0.532 µm extinc-tion coefficient values near the surface. The temporal/spatial collocation and 40 km AOD averaging process here is the same as described in Sect. 3. Recall that PM2.5is a dry par-ticle mass measurement. However, satellite-retrieved AOD values include the effects of aerosol particle growth as a func-tion of vapor pressure. To compute the CALIOP extincfunc-tion and PM2.5relationship, a sensitivity study was performed for which the hygroscopic growth of aerosol particles was ac-counted for. We approximate that aerosol particles over the CONUS are sulfate aerosols, and apply the sulfate aerosol hygroscopic growth factor (Hanel, 1976; Hegg et al., 1993; Anderson et al., 1994) to compute dry aerosol extinction and AOD using Goddard Modeling and Assimilation Office (GMAO) relative humidity values included as metadata in the NASA-disseminated CALIOP files. No correction is made to extinction coefficient values when relative humidity is less than 30 % or above 95 %. Further, we investigate the sensitiv-ity of the CALIOP value chosen to compare with by varying the height of the retrieval used between 0 and 500 m a.g.l. in 100 m segments.
Results, including the level of CALIOP extinction used, are summarized in Table 5. For both the eastern and Pacific US time zones, altering the level of the reported CALIOP extinction from 200 to 500 m a.g.l. has little effect on cor-relation. Relatively low correlation is observed using the CALIOP extinction values at the 0–100 m level, however, suggesting the likely impacts of ground contamination of the backscatter signal. When hygroscopic growth of aerosol par-ticles is considered, modest improvements are found for the eastern CONUS but not the climatologically drier Pacific re-gion.
We next investigate the relationship between CALIOP ex-tinction near the surface and PM2.5 concentrations when collocated Aqua MODIS operational retrievals are
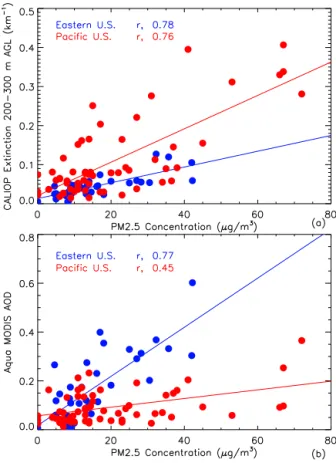
avail-Figure 10.For the eastern (in blue) and Pacific (in red) US time zones, 2-year (2008–2009) scatterplots of hourly PM2.5 concentra-tions versus(a)cloud-free 5 km CALIOP dry mass 0.532 µm extinc-tion at the 200–300 m a.g.l. layer, and(b)operational Aqua MODIS AOD, both averaged within 40 km and the hour of each respective PM2.5measurement.
able. This PM2.5/ CALIOP/Aqua MODIS data set was con-structed for both hourly and daily analyses during the 2008– 2009 period. For the hourly study, both CALIOP and opera-tional Aqua MODIS observations are again averaged within 40 km and the 1 h of the PM2.5 measurements. For the daily comparison, observations from CALIOP are averaged within 100 km along track (approximately 1◦), and those from operational Aqua MODIS are averaged within 1◦ lat-itude/longitude, and the day of each PM2.5measurement.
Table 5.Two-year (2008–2009) correlation coefficients of hourly PM2.5observations and 40 km average CALIOP extinction (both uncor-rected and dry mass) at various 100 m a.g.l. atmospheric layers.
CALIOP extinction layer
Uncorrected CALIOP extinction Dry mass CALIOP extinction
Eastern Pacific Eastern Pacific
0–100 m 0.35 0.72 0.33 0.71
100–200 m 0.62 0.73 0.66 0.72
200–300 m 0.57 0.72 0.69 0.74
300–400 m 0.54 0.61 0.63 0.59
400–500 m 0.69 0.58 0.70 0.56
and Aqua MODIS retrievals behave similarly for the eastern CONUS, but CALIOP performance is much better than Aqua MODIS over the Pacific. However, the correlations between PM2.5and CALIOP/Aqua MODIS observations computed in this analysis should be considered with caution, as the low data count (fewer than 100 data points) make these findings tenuous.
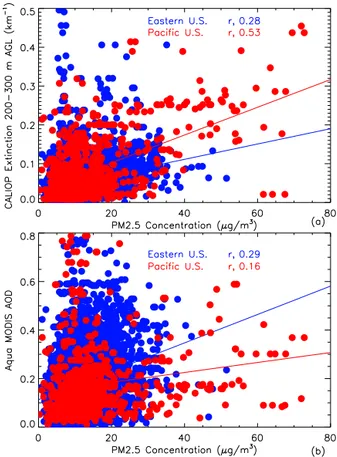
Figure 11a and b depict the same analyses as in Fig. 10, but now for the daily analysis of PM2.5/ CALIOP / Aqua MODIS. Correlations are reduced for each time zone, compared with the hourly results. As was shown in Fig. 10, CALIOP and Aqua MODIS exhibit similar cor-relations with daily PM2.5 for the eastern CONUS, but daily PM2.5/ CALIOP correlations are better than daily PM2.5/ Aqua MODIS correlations for the Pacific CONUS.
CALIOP near-surface extinction/ hourly PM2.5 relation-ships represent the most consistent correlations solved in this study. However, more research is necessary to advance our understanding of the relationship between actively profiled aerosol optical properties and PM2.5. This is particularly im-portant since studies have reported significant uncertainties in CALIOP AOD and extinction data (e.g., Schuster et al., 2012; Omar et al., 2013), especially for values lower than 200 m a.g.l., which are clearly critical to resolving the most optimal CALIOP extinction/PM2.5relationship. Note, how-ever, that aside from ground contamination issues described above, Campbell et al. (2012a, b) argue for an additional QA step of removing CALIOP profiles from bulk averages where no aerosol extinction is retrieved below 200 m to limit the effects of signal pulse attenuation. This effect may be fur-ther contributing to lower skill at these heights. Furfur-ther, ad-ditional analysis can be explored where the top height of the surface-detached mixed aerosol layer is known. This con-straint was not considered here, and is outside the general scope of our investigation.
6 Conclusions
Surface measurements of particulate matter with diameters smaller than 2.5 µm (PM2.5) are a frequent tool used to eval-uate air quality in urban areas. Past studies have
investi-Figure 11.For the eastern (blue) and Pacific (red) US time zones, 2-year (2008–2009) scatterplots of daily PM2.5concentrations ver-sus(a)cloud-free 5 km CALIOP dry mass 0.532 µm extinction at the 200–300 m a.g.l. layer (averaged within 100 km), and(b) opera-tional Aqua MODIS AOD (averaged within 1◦) and the day of each respective PM2.5measurement.
Spectroradiometer (MODIS) and Version 22 Multi-angle Imaging Spectroradiometer (MISR) are temporally and spa-tially collocated for an hourly comparison with PM2.5 mea-surements. Next, operational and data assimilation (DA) quality Aqua/Terra MODIS and MISR AOD data sets are analyzed against PM2.5 on a daily temporal scale to veal the effects that AOD data quality can exhibit with re-spect to PM2.5/ AOD correlations. The representativeness of surface aerosol particle concentration to that of the en-tire column, as well as the correlation between surface AOD and total column AOD, are investigated using obser-vations from Cloud-Aerosol Lidar with Orthogonal Polariza-tion (CALIOP). CALIOP is then used to examine the rela-tionship between near surface aerosol extinction and PM2.5.
The conclusions of this study are summarized as follows: 1. Application of aggressive quality assurance (QA)
pro-cedures to passive satellite AOD retrievals increases their correlation with PM2.5for all of the CONUS, but significantly decreases data counts by a factor of about 2.
2. Correlations remain low even with aggressive QA. 3. Aerosol particle distributions tend to be more
con-centrated near the surface in the eastern CONUS and more diffuse vertically in the western CONUS. This regional variability in aerosol vertical distribution across the CONUS confirms one reason for the higher PM2.5/ satellite AOD correlations observed in the east compared to the west.
4. Near-surface extinction (below 500 m a.g.l.), as mea-sured by CALIOP, is not well representative of total column-integrated extinction (i.e., AOD). Regionally, near-surface aerosols are more representative of total column AOD in the eastern CONUS than in the west-ern CONUS.
5. Correlations between near-surface CALIOP 0.532 µm extinction and hourly PM2.5observations are better than can be achieved with passive AOD retrievals. How-ever, with fewer than 100 pairs of collocated PM2.5and CALIOP extinction data points used, such a finding is tenuous. Additional studies are needed to further ex-plore the possibility of accurately estimating PM2.5 con-centrations from surface extinction derived from active sensors.
In this paper, we have demonstrated that estimation of PM2.5 concentrations from satellite-retrieved AOD is lim-ited by both the quality of satellite AOD retrievals as well as the representativeness of column-integrated AOD to near-surface AOD. Also, some of the past studies have shown that passive satellite AOD may be used to accurately esti-mate PM2.5 for particular sites. However, this study shows
that, even with the use of higher-quality DA AOD obser-vations, column-integrated AOD derived from passive satel-lite sensors may not be used directly as accurate proxies for surface-based PM2.5 over broad spatial domains. As discussed earlier, this is partly attributed to differences in the aerosol surface-to-column representativeness across the CONUS. Therefore, we caution the direct use of passive satellite AOD observations for PM2.5 estimation over large areas, especially in regions where elevated aerosol plumes exist.
Additionally, as our initial study has shown, the use of near surface extinction measurements from active sensors, such as CALIOP, may provide a better PM2.5estimation over broad spatial scales than column-integrated passive satellite AOD. However, ground contamination for near-surface CALIOP measurements and the effects of humidity on aerosol op-tical properties need further investigation. Still, satellite-derived aerosol properties are of much value to PM2.5 stud-ies, especially with the synergistic use of passive and ac-tive aerosol-sensiac-tive observations, and through assimilating these quality-assured data into air-quality-focused numerical models for future PM2.5monitoring and forecasts.
Acknowledgements. This research was funded through the sup-port of the Office of Naval Research Code 322 and the NASA Interdisciplinary Science Program. J. R. Campbell acknowledges the support of NASA Interagency Agreement NNG13HH10I on behalf of the Micropulse Lidar Network and NASA Radiation Sciences Program. Author Y. Shi acknowledges the support of the NASA Earth and Space Science Fellowship (NESSF) Program. We thank Mark Vaughan for his suggestions in improving this work. CALIPSO and MISR data were obtained from the NASA Langley Research Center Atmospheric Science Data Center. MODIS data were obtained from NASA Goddard Space Flight Center. The DA-quality MODIS data were obtained from the Global Ocean Data Assimilation Experiment (GODAE) server. The PM2.5 data were obtained from the EPA AQS site. We acknowledge the AERONET program, and the contributing principal investigators and their staff, for coordinating the sites and data used for this investigation.
Edited by: E. Gerasopoulos
References
Anderson, T. L., Charlson, R. J., White, W. H., and McMurry, P. H.: Comment on “Light scattering and cloud condensation nucleus activity of sulfate aerosol measured over the Northeast Atlantic Ocean” by D.A. Hegg et al., J. Geophys. Res., 99, 25947–25949, doi:10.1029/94JD02608, 1994.
Anderson, T. L., Charlson, R. J., Winker, D. M., Ogren, J. A., and Holmén, K.: Mesoscale variations of tropospheric aerosols, J. At-mos. Sci., 60, 119–136, 2003b.
PM2.5and aerosol optical thickness, Atmos. Environ., 44, 271– 277, 2010.
Campbell, J. R., Tackett, J. L., Reid, J. S., Zhang, J., Curtis, C. A., Hyer, E. J., Sessions, W. R., Westphal, D. L., Prospero, J. M., Welton, E. J., Omar, A. H., Vaughan, M. A., and Winker, D. M.: Evaluating nighttime CALIOP 0.532 µm aerosol optical depth and extinction coefficient retrievals, Atmos. Meas. Tech., 5, 2143–2160, doi:10.5194/amt-5-2143-2012, 2012a.
Campbell, J. R., Reid, J. S., Westphal, D. L., Zhang, J., Tack-ett, J. L., Chew, B. N., Welton, E. J., Shimizu, A., Sugimoto, N., Aoki, K., and Winker, D. M.: Characterizing the verti-cal profile of aerosol particle extinction and linear depolar-ization over southeast Asia and the maritime continent: the 2007–2009 view from CALIOP, Atmos. Res., 122, 520–543, doi:10.1016/j.atmosres.2012.05.007, 2012b.
Chu, D. A., Kaufman, Y. J., Zibordi, G., Chern, J. D., Mao, J., Li, C., and Holben, B. N.: Global monitoring of air pollution over land from the Earth Observing System-Terra Moderate Resolution Imaging Spectroradiometer (MODIS), J. Geophys. Res., 108, 4661, doi:10.1029/2002JD003179,D21, 2003.
Diner, D. J., Beckert, J. C., Reilly, T. H., Bruegge, C. J., Conel, J. E., Kahn„ R. A., Martonchik, J. V., Ackerman, T. P., Davies, R., Gerstl, S. A. W., Gordon, H. R., Muller, J.-P., Myneni, R. B., Sell-ers, P. J., Pinty, B., and Verstraete, M. M.: Multi-angle Imaging SpectroRadiometer (MISR) instrument description and experi-ment overview, IEEE Trans. Geosci. Remote Sens., 36, 1072– 1087, 1998.
Engel-Cox, J. A., Hoff, R. M., Rogers, R., Dimmick, F., Rush, A. C., Szykman, J., Al-Saadi, J., Chu, D. A., and Zell, E. R.: Inte-grating lidar and satellite optical depth with ambient monitoring for 3-dimensional particulate characterization, Atmos. Environ., 40, 8056–8067, 2006.
Engel-Cox, J. A., Holloman, C. H., Coutant, B. W., and Hoff, R. M.: Qualitative and quantitative evaluation of MODIS satellite sensor data for regional and urban scale air quality, Atmos. Environ., 38, 2495–2509, 2004.
Federal Register: National ambient air quality standards for partic-ulate matter. Final Rule Federal Register/vol. 62, no. 138/18 July 1997/Final Rule, 40 CFR Part 50, 1997.
Federal Register: National ambient air quality standards for partic-ulate matter. Proposed Rule Federal Register/vol. 71, no. 10/17 January 2006/Proposed Rules, 40 CFR Part 50, 2006.
Gupta, P., Christopher, S. A., Wang, J., Gehrig, R., Lee, Y. C., and Kumar, N.: Satellite remote sensing of particulate matter and air quality over global cities, Atmos. Environ., 40, 5880–5892, 2006. Hanel, G.: The properties of atmospheric aerosol particles as func-tions of relative humidity at thermodynamic equilibrium with surrounding moist air, Adv. Geophys., 19, 73–188, 1976. Hegg, D. A., Ferek, R. J., and Hobbs, P. V.: Light scattering and
cloud condensation nucleus activity of sulfate aerosol measured over the northeast Atlantic Ocean, J. Geophys. Res., 98, 14887– 14894, doi:10.1029/93JD01615, 1993.
Hoff, R. M. and Christopher, S. A.: Remote sensing of particulate pollution from space: have we reached the promised land?, J Air Waste Manage. Assoc., 59, 645–675, 2009.
Holben, B. N., Eck, T. F., Slutsker, I., Tanré, D., Buis, J. P., Set-zer, A., Vermote, E., Reagan, J. A., Kaufman, Y., Nakajima, T., Lavenu, F., Jankowiak, I., and Smirnov, A.: AERONET - A
fed-erated instrument network and data archive for aerosol character-ization, Rem. Sens. Environ., 66, 1–16, 1998.
Hu, Z.: Spatial analysis of MODIS aerosol optical depth, PM2.5, and chronic coronary heart disease, Int. J. Health Geogr., 8, 1, doi:10.1186/1476-072X-8-27, 2009.
Hunt, W. H., Winker, D. M., Vaughan, M. A., Powell, K. A., Lucker, P. L., and Weimer, C.: CALIPSO lidar description and perfor-mance assessment, J. Atmos. Oceanic Technol., 26, 1214–1228, doi:10.1175/2009JTECHA1223.1, 2009.
Hutchison, K. D.: Applications of MODIS satellite data and prod-ucts for monitoring air quality in the state of Texas. Atmos. Env-iron., 37, 2403–2412, 2003.
Hyer, E. J. and Chew, B. N.: Aerosol transport model evaluation of an extreme smoke episode in Southeast Asia, Atmos. Environ., 44, 1422–1427, 2010.
Hyer, E. J., Reid, J. S., and Zhang, J.: An over-land aerosol opti-cal depth data set for data assimilation by filtering, correction, and aggregation of MODIS Collection 5 optical depth retrievals, Atmos. Meas. Tech., 4, 379–408, doi:10.5194/amt-4-379-2011, 2011.
Kahn, R. A., Gaitley, B. J., Martonchik, J. V., Diner, D. J., Crean, K. A., and Holben, B. N.: Multiangle Imaging Spec-troradiometer (MISR) global aerosol optical depth validation based on 2 years of coincident Aerosol Robotic Network (AERONET) observations, J. Geophys. Res., 110, D10S04, doi:10.1029/2004JD004706, 2005.
Kahn, R. A., Gaitley, B. J., Garay, M. J., Diner, D. J., Eck, T., Smirnov, A. and Holben, B. N.: Multiangle Imaging Spectro-Radiometer global aerosol product assessment by comparison with Aerosol Robotic Network, J. Geophys. Res., 115, D23209, doi:10.1029/2010JD014601, 2010.
Kittaka, C., Winker, D. M., Vaughan, M. A., Omar, A., and Remer, L. A.: Intercomparison of column aerosol optical depths from CALIPSO and MODIS-Aqua, Atmos. Meas. Tech., 4, 131–141, doi:10.5194/amt-4-131-2011, 2011.
Kumar, N., Chu, A., and Foster, A.: An empirical relationship be-tween PM2.5 and aerosol optical depth in Delhi Metropolitan, Atmos. Environ., 41, 4492–4503, 2007.
Liu, Y., Park, R. J., Jacob, D. J., Li, Q., Kilaru, V., and Sarnat, J. A.: Mapping annual mean ground-level PM2.5concentrations us-ing Multiangle Imagus-ing Spectroradiometer aerosol optical thick-ness over the contiguous United States, J. Geophys. Res., 109, D22206, doi:10.1029/2004JD005025, 2004.
Liu, Y., Franklin, M., Kahn, R., and Koutrakis, P.: Using aerosol optical thickness to predict ground-level PM2.5 concentrations in the St Louis area: a comparison between MISR and MODIS, Remote Sens. Environ., 107, 33–44, 2007.
Omar, A. H., Winker, D. M., Tackett, J. L., Giles, D. M., Kar, J., Liu, Z., Vaughan, M. A., Powell, K. A., and Trepte, C. R.: CALIOP and AERONET aerosol optical depth comparisons: One size fits none, J. Geophys. Res. Atmos., 118, 4748–4766, doi:10.1002/jgrd.50330, 2013.
Paciorek, C., Liu, Y., Moreno-Macias, H., and Kondragunta, S.: Spatio-temporal associations between GOES aerosol optical depth retrievals and ground-level PM2.5, Environ. Sci. Technol., 42, 5800–5806, 2008.
mor-tality, and long-term exposure to fine particulate air pollution, J. Am. Med. Assoc., 287, 1132–1141, 2002.
Prados, A. I., Kondragunta, S., Ciren, P., and Knapp, K. R.: GOES Aerosol/Smoke Product (GASP) over North America: Compar-isons to AERONET and MODIS observations, J. Geophys. Res., 112, D15201, doi:10.1029/2006JD007968, 2007.
Remer, L. A., Kaufman, Y. J., Tanre, D., Mattoo, S., Chu, D. A., Martins, J. V., Li, R.-R., Ichoku, C., Levy, R. C., Kleidman, R. G., Eck, T. F., Vermote, E., and Holben, B. N.: The MODIS aerosol algorithm, products, and validation, J. Atmos. Sci., 62, 947–973, 2005.
Schuster, G. L., Vaughan, M., MacDonnell, D., Su, W., Winker, D., Dubovik, O., Lapyonok, T., and Trepte, C.: Comparison of CALIPSO aerosol optical depth retrievals to AERONET mea-surements, and a climatology for the lidar ratio of dust, Atmos. Chem. Phys., 12, 7431–7452, doi:10.5194/acp-12-7431-2012, 2012.
Schwartz, J. and Neas, L. M.: Fine particles are more strongly asso-ciated than coarse particles with acute respiratory health effects in school children, Epidemiology, 11, 6–10, 2000.
Shi, Y., Zhang, J., Reid, J. S., Holben, B., Hyer, E. J., and Curtis, C.: An analysis of the Collection 5 MODIS over-ocean aerosol opti-cal depth product for its implication in aerosol assimilation, At-mos. Chem. Phys., 11, 557–565, doi:10.5194/acp-11-557-2011a, 2011.
Shi, Y., Zhang, J., Reid, J. S., Liu, B., and Deshmukh, R.: Multi-sensor Analysis on Data-Assimilation-Quality MISR Aerosol Products, Abstract A53C-0358 presented at 2011 Fall Meeting, AGU, San Francisco, CA, 5–9 December 2011, 2011b. Shi Y., Zhang, J., Reid, J. S., Liu, B., and Deshmukh, R.: Critical
evaluation of cloud contamination in MISR aerosol product using collocated MODIS aerosol and cloud products, Abstract A13J-0310, presented at 2012 Fall Meeting, AGU, San Francisco, CA, 3–7 December 2012, 2012.
Shinozuka, Y., Clarke, A. D., Howell, S. G., Kapustin, V. N., McNaughton, C. S., Zhou, J., and Anderson, B. E.: Aircraft profiles of aerosol microphysics and optical properties over North America: Aerosol optical depth and its association with PM2.5 and water uptake, J. Geophys. Res., 112, D12S20, doi:10.1029/2006JD007918, 2007.
Stephens, G. L., Vane, D. G., Boain, R. J., Mace, G. G., Sassen, K., Wang, Z., Illingworth, A. J., O’Connor, E. J., Rossow, W. B., Durden, S. L., Miller, S. D., Austin, R. T., Benedetti, A., and Mitrescu, C.: The CloudSat mission and the A-Train: A new di-mension of space-based observations of clouds and precipitation, B. Am. Meteorol. Soc., 83, 1771–1790, doi:10.1175/BAMS-83-12-1771, 2002.
Toth, T. D., Zhang, J., Campbell, J. R., Reid, J. S., Shi, Y., Johnson, R. S., Smirnov, A., Vaughan, M. A., and Winker, D. M.: Investigating enhanced Aqua MODIS aerosol optical depth retrievals over the mid-to-high latitude Southern Oceans through intercomparison with co-located CALIOP, MAN, and AERONET data sets, J. Geophys. Res. Atmos., 118, 4700–4714, doi:10.1002/jgrd.50311, 2013.
van Donkelaar, A., Martin, R. V., and Park, R. J.: Estimating ground-level PM2.5 using aerosol optical depth determined from satellite remote sensing, J.Geophys. Res. 111, D21201, doi:10.1029/2005JD006996, 2006.
van Donkelaar A., Martin, R. V., Brauer, M., Kahn, R., Levy, R., Verduzco, C., and Villeneuve, P. J.: Global estimates of am-bient fine particulate matter concentrations from satellite-based aerosol optical depth: development and application. Environ. Health Persp., 118, 847–855, 2010.
Wang, J. and Christopher, S. A.: Intercomparison between satel-lite derived aerosol optical thickness and PM2.5 mass: impli-cations for air quality studies, Geophys. Res. Lett., 30, 2095, doi:10.1029/2003GL018174, 2003.
Winker, D. M., Hunt, W. H., and McGill, M. J.: Initial perfor-mance assessment of CALIOP, Geophys. Res. Lett., 34, L19803, doi:10.1029/2007GL030135, 2007.
Winker, D. M., Tackett, J. L., Getzewich, B. J., Liu, Z., Vaughan, M. A., and Rogers, R. R.: The global 3-D distribution of tro-pospheric aerosols as characterized by CALIOP, Atmos. Chem. Phys., 13, 3345–3361, doi:10.5194/acp-13-3345-2013, 2013. Zhang, J. and Reid, J. S.: MODIS aerosol product analysis for
data assimilation: Assessment of over-ocean level 2aerosol optical thickness retrievals, J. Geophys. Res., 111, D22207, doi:10.1029/2005JD006898, 2006.
Zhang, J., Christopher, S. A., and Holben, B. N.: Intercomparison of smoke aerosol optical thickness derived from GOES 8 im-ager and ground-based Sun photometers, J. Geophys. Res., 106, 7387–7397, doi:10.1029/2000JD900540, 2001.
Zhang, J., Reid, J. S., Westphal, D. L., Baker, N. L., and Hyer, E. J.: A system for operational aerosol optical depth data as-similation over global oceans, J. Geophys. Res., 113, D10208, doi:10.1029/2007JD009065, 2008.