www.atmos-chem-phys.net/16/15097/2016/ doi:10.5194/acp-16-15097-2016
© Author(s) 2016. CC Attribution 3.0 License.
An observationally constrained estimate of
global dust aerosol optical depth
David A. Ridley1, Colette L. Heald1, Jasper F. Kok2, and Chun Zhao3
1Civil and Environmental Engineering, Massachusetts Institute of Technology, Cambridge, MA, USA 2Department of Atmospheric and Oceanic Sciences, UCLA, Los Angeles, CA, USA
3Atmospheric Sciences and Global Change Division, Pacific Northwest National Lab, Richland, WA 99352, USA
Correspondence to:David A. Ridley ([email protected])
Received: 8 May 2016 – Published in Atmos. Chem. Phys. Discuss.: 20 May 2016 Revised: 27 October 2016 – Accepted: 18 November 2016 – Published: 6 December 2016
Abstract. The role of mineral dust in climate and ecosys-tems has been largely quantified using global climate and chemistry model simulations of dust emission, transport, and deposition. However, differences between these model simu-lations are substantial, with estimates of global dust aerosol optical depth (AOD) that vary by over a factor of 5. Here we develop an observationally based estimate of the global dust AOD, using multiple satellite platforms, in situ AOD ob-servations and four state-of-the-science global models over 2004–2008. We estimate that the global dust AOD at 550 nm is 0.030±0.005 (1σ), higher than the AeroCom model
me-dian (0.023) and substantially narrowing the uncertainty. The methodology used provides regional, seasonal dust AOD and the associated statistical uncertainty for key dust regions around the globe with which model dust schemes can be evaluated. Exploring the regional and seasonal differences in dust AOD between our observationally based estimate and the four models in this study, we find that emissions in Africa are often overrepresented at the expense of Asian and Mid-dle Eastern emissions and that dust removal appears to be too rapid in most models.
1 Introduction
Mineral dust is a key component of aerosol, affecting climate through interaction with radiation, clouds and snowpack, hu-man health through contribution to particulate matter (PM), and ecosystem health through nutrient transport and depo-sition. The direct radiative effect (DRE) of dust contributes
∼30 % of the total aerosol global mean DRE (Heald et al.,
2014); however, there is significant uncertainty in the radia-tive forcing of dust, estimated to be anywhere between−0.3
and+0.1 Wm−2(Boucher et al., 2013), owing to large
un-certainties in the anthropogenically driven changes in dust (Ginoux et al., 2012; Heald and Spracklen, 2015), the parti-cle morphology and absorption properties (e.g., Balkanski et al., 2007; Mishra et al., 2008), and the dust size distribution (Kok, 2011; Kok et al., 2016). Dust concentrations are often highest in remote regions that are sparsely monitored, lead-ing to further uncertainty on the atmospheric burden and the associated radiative effects.
aerosol hinder our ability to estimate the full extent of the climate and air quality impacts of mineral dust.
To simulate the global dust cycle, models must be able to predict the vertical dust flux from suitable regions and rep-resent the evolution of the particle size distribution while the dust is transported and deposited out of the atmosphere (e.g., Kok et al., 2012). The AeroCom project, an intercompari-son and evaluation of different aerosol models, provides a detailed evaluation of dust aerosol simulations from multi-ple models (Huneeus et al., 2011). There is a considerable spread in global dust AOD estimates from models ranging from 0.010 to 0.053 (yielding a mean of 0.028±0.011) and
an AeroCom “median model” estimate of 0.023. The uncer-tainty in the AOD highlights the underlying uncertainties in emissions, size distributions, lifetime, and optical properties. Even over the well-studied, most productive dust region of West Africa, climate models struggle to represent dust emis-sion and their year-to-year changes (Evan et al., 2014).
An observationally constrained estimate of dust AOD can thus provide a valuable metric to holistically evaluate model dust emission, transport, and deposition, thereby helping constrain both the DRE and the role of dust in adverse health effects from exposure to PM. Here we derive such a metric, with consideration for the sources of uncertainty, and use it to highlight seasons and regions in which current global models deviate from the observations.
2 Data description
To derive an estimate of dust AOD we make use of AOD retrievals from three satellite instruments as well as surface-based sun photometers to provide a “ground truth” for cor-recting the satellite retrievals. We use four global aerosol models to provide a range of estimates for the non-dust aerosol AOD and the spatial distribution of dust aerosol (see Sect. 3 for a full description of the methodology). We use observational data and model simulations over the 5-year pe-riod between 2004 and 2008, except when calculating biases between satellite and surface-based observations, for which we leverage a longer dataset between 2003 and 2013. Below we give a brief description of each instrument and model and the products used.
2.1 Moderate Resolution Imaging Spectroradiometer (MODIS)
Two MODIS instruments are in sun-synchronous orbit aboard the Terra and Aqua platforms, making equatorial overpasses at 10.30 and 14.30 local time (LT), respectively. Radiance measurements are made across 36 bands between 0.4 and 14 microns, with seven channels used to retrieve the AOD at 550 nm. The wide swath (2330 km) allows al-most daily coverage of the globe by both instruments at a native resolution of 500 m at nadir (2 km at swath edge), for
the aerosol-relevant bands, with AOD reported at approxi-mately 10 km×10 km resolution (Level 2 product). The
Col-lection 6 MODIS data include a merged AOD product that combines retrievals over ocean, vegetated land surface (Dark Target), and bright land surface (Deep Blue) to maximize global coverage. The retrieved AOD (τ) is estimated to be
accurate to±0.03±0.05τ over ocean (Remer et al., 2005), ±0.05±0.15τ over dark land surfaces (Levy et al., 2010),
and±0.05±0.20τ over bright surfaces (Hsu et al., 2006;
Sayer et al., 2013). The quality-assured (QA) Level 2 AOD retrievals are aggregated daily onto a 1◦×1◦grid (Level 3) with statistics, including cloud fraction and standard devi-ation. Throughout this study we use the Level 3 product. The merged Level 3 product uses QA=3 data over land
and QA=1–3 data over ocean, where higher quality data
are given commensurate weighting. Baddock et al. (2016) show that correlation between the frequency of high AOD and dust source location is actually improved when using only QA=1 data. For data to be considered QA > 1 the
stan-dard deviation in AOD between 1 km retrievals must remain below a threshold of 0.18. Therefore, some legitimate dust-influenced retrievals over source may be discarded when us-ing the Level 3 merged product. However, this is a trade off in terms of improving the quality of the retrieval away from source regions. The MODIS retrieval algorithm uses a lookup table of surface reflectance for a set of simulated aerosol properties to determine the AOD that best represents the observed reflectance. For the Deep Blue retrieval, the most relevant to this study over dust-influenced regions, the assumed optical properties of the dust aerosol have a single-scattering albedo (SSA) between 0.87 and 1.0 for the lookup tables at 412 and 490 nm and a refractive index of 1.55– 0.0i(at 670 nm). The Mie calculation uses an effective phase
function, derived from comparison of the Sea-Viewing Wide Field-of-View Sensor (SeaWIFS) instrument retrievals with AERONET, over the ocean to account for nonsphericity. Dif-ferent locations and loading conditions trigger changes in the wavelengths used in the retrieval, more information can be found in Hsu et al. (2004, 2013)
2.2 Multi-angle Imaging SpectroRadiometer (MISR) The MISR instrument, aboard the Terra satellite platform, measures radiance over nine camera angles with an equa-torial overpass at 10.30 LT. The relatively narrow swath width (400 km) results in global coverage every 9 days, com-pared with 1–2 days by MODIS. MISR provides AOD at four wavelengths (446, 558, 672, 867 nm) with about three-quarters of retrievals falling within 0.20τ (but no less than
0.05) of AERONET observations (we assume an instrument uncertainty of±0.05±0.20τ throughout this study) and
radiances using properties for eight particle types to deter-mine the AOD. The optical properties of the two aerosol particle types corresponding to dust assume a refractive in-dex of 1.51–6.5×10⁻⁴iand SSA between 0.971 and 0.994
(at 672 nm). The extinction is calculated using the discrete dipole approximation and theT matrix technique to account
for particle nonsphericity (Kalashnikova et al., 2005; Mar-tonchik et al., 2009).
2.3 Aerosol Robotic Network (AERONET)
AERONET consists of a global network of Cimel Elec-tronique CE-318 sun photometers, which reports AOD with a high degree of accuracy leading to estimated errors of
∼0.01–0.02 (Eck et al., 1999; Holben et al., 1998). Direct
sun measurements are made every 15 min at 340, 380, 440, 500, 675, 870, 940, and 1020 nm and AOD is retrieved at all but the 940 nm channel, which is used to provide total column water vapor. We use Level 2.0 data that have been screened for clouds (Smirnov et al., 2000). The wavelength dependence of the AOD, described by the Ångström ex-ponent (Ångström, 1964) between the AOD at 440 and at 870 nm, is used to distinguish AOD dominated by coarse aerosol that is indicated by a lower Ångström exponent than for fine aerosol (e.g., O’Neill et al., 2001; Reid et al., 1999). Sun photometer measurements made from aboard ship cruises as part of the AERONET Maritime Aerosol Net-work (MAN; Smirnov et al., 2011) are incorporated into the AERONET analysis in this work.
2.4 GEOS-Chem
We use the GEOS-Chem global chemical transport model (v9-01-03; http://www.geos-chem.org) to simulate the cou-pled oxidant–aerosol chemistry of the troposphere at a res-olution of 2.5◦ by 2.0◦ over 47 vertical levels follow-ing the specifications used in (Heald et al., 2014). The oxidant–aerosol simulation includes H2SO4–HNO3–NH3 aerosol thermodynamics described by ISORROPIA II (Foun-toukis and Nenes, 2007) and coupled with an O3–NOx–
hydrocarbon chemical mechanism (Park et al., 2004, 2006). The aerosol simulation also includes carbonaceous aerosols (Park et al., 2003; Pye et al., 2010; Pye and Seinfeld, 2010), mineral dust (Fairlie et al., 2007; Ridley et al., 2012), and sea salt (Alexander et al., 2005). Aerosol mass is trans-ported in four size bins (0.1–1.0, 1.0–1.8, 1.8–3.0, and 3.0– 6.0 µm radius) for dust, two for sea salt, and one for each of the other species. The model is driven by assimilated me-teorology from the NASA Modern-Era Retrospective anal-ysis for Research and Applications (MERRA), which pro-vides winds, precipitation, etc., could cover at 1-hourly and 3-hourly temporal resolution. Dust emissions are gen-erated using the DEAD scheme (Zender, 2003) with the GOCART source function (Ginoux et al., 2001; Prospero et al., 2002) and a fixed soil clay fraction of 0.2. We
fol-low Ridley et al. (2013) by using a probability distribu-tion of subgrid scale winds, generated from 0.5◦×0.67◦ MERRA 10 m winds, rather than the average wind speed when calculating dust uplift. Biomass burning emissions are provided by the Global Fire Emissions Database version 3 (GFEDv3; van der Werf et al., 2010). Anthropogenic emis-sions are provided by the Emisemis-sions Database for Global Atmospheric Research (EDGAR) v3.2 inventory (Olivier, 2001) for SOx, NOx, and CO, which is superseded by the
National Emissions Inventory (NEI99; http://www.epa.gov/ ttn/chief/net/1999inventory.html) over the United States and Streets et al. (2003, 2006) over Asia (van Donkelaar et al., 2008). Sea salt emissions follow Gong (2003) with added dependence on sea surface temperature (Jaeglé et al., 2011). AOD at 550nm is calculated online assuming lognormal size distributions of externally mixed aerosols and is a function of the local relative humidity to account for hygroscopic growth (Martin et al., 2003). Aerosol optical properties are based on the Global Aerosol Data Set (GADS) (Hess et al., 1998a) with modifications to the size distribution based on field observations (Drury et al., 2010; Jaeglé et al., 2011) and improvements to the UV–visible refractive indices of dust (Sinyuk et al., 2003).
2.5 Community Earth System Model (CESM)
dis-tributed following brittle fragmentation theory (Kok, 2011a). All aerosols are assumed externally mixed. The aerosol opti-cal properties are based on GADS (Hess et al., 1998a) with improvements to the dust optical properties described in Al-bani et al. (2014). Prescribed size distributions that can be found in Emmons et al. (2010).
2.6 WRF-Chem
The quasi-global configuration of the WRF-Chem (version 3.5.1) model is used in this study, described in detail in Hu et al. (2016). The simulation uses the MOSAIC (Model for Simulation Aerosol Interactions and Chemistry) aerosol module (Zaveri et al., 2008) with the CBM-Z (carbon bond mechanism) photochemical mechanism (Zaveri and Peters, 1999). A sectional approach is used to represent aerosol size distributions with eight discrete size bins and all major aerosol components including sulfate (SO−24 ), nitrate (NO−3),
ammonium (NH+
4), black carbon, organic matter, sea salt, methanesulfonic acid, and mineral dust are simulated. The MOSAIC aerosol scheme includes physical and chemical processes of nucleation, condensation, coagulation, aqueous phase chemistry, and water uptake by aerosols. The model is run at a resolution of 1◦×1◦ (between 180◦W–180◦E and 67.5◦S–77.5◦N) with 35 vertical layers up to 50hPa (Hu et al., 2016). The modeled u andv wind components
and temperature in the free atmosphere above the planetary boundary layer are nudged towards NCEP/FNL reanalyses on 6-hourly time steps (Stauffer and Seaman, 1990). Biomass burning emissions are derived from GFEDv3. Anthropogenic emissions are provided by the REanalysis of the TROpo-spheric (RETRO) chemical composition inventories (http: //gcmd.gsfc.nasa.gov/) except over East Asia, where emis-sions are taken from the inventory developed for the INTEX-B mission in 2006 (Zhang et al., 2009), updated with SO2and carbonaceous emissions from Lu et al. (2011), and the United States, where the National Emissions Inventory (NEI) for 2005 is used. Sea salt emissions are based on Gong (2003), with added emission dependence on sea surface temperature (Jaeglé et al., 2011). Dust emission fluxes are calculated with the GOCART dust emissions scheme (Ginoux et al., 2001) and partitioned into the MOSAIC size bins based on brittle fragment theory (Kok, 2011a). Aerosol optical properties are computed as a function of wavelength for each model grid box. Aerosols are assumed internally mixed (a volumetric mean refractive index) in each bin. The Optical Properties of Aerosols and Clouds (OPAC) dataset (Hess et al., 1998b) is used for the shortwave and longwave refractive indices of aerosols, except that a constant value of 1.53+0.003iis used
for the shortwave refractive index of dust following Zhao et al. (2010, 2011). A detailed description of the aerosol opti-cal properties opti-calculated in WRF-Chem can be found in Fast et al. (2006) and Barnard et al. (2010). The optical proper-ties and direct radiative forcing of individual aerosol species
in the atmosphere are diagnosed following the methodology described in Zhao et al. (2013).
2.7 MERRAero
The NASA Global Modeling and Assimilation Office (GMAO) GEOS-5 Earth system model can be run in a con-figuration that assimilates meteorological and aerosol prop-erties retrieved from NASA Earth observing satellite plat-forms (Rienecker et al., 2011). The resulting aerosol simula-tion is termed MERRAero. The simulasimula-tion is run at a resolu-tion of 0.5◦×0.625◦providing speciated AOD with 3-hourly temporal resolution. The aerosol processes are based on the Goddard Chemistry, Aerosol, Radiation and Transport model (GOCART; Chin et al., 2002) with coupling of chemistry and climate (Colarco et al., 2010). Dust, sulfate, organic carbon, black carbon, and sea salt are simulated as external mixtures. Dust aerosol is partitioned into eight size bins between 0.1 and 10 µm particle radius, and sea salt aerosol is partitioned into five size bins between 0.03 and 10 µm dry radius; all other aerosol is transported in a single size bin per species. Emissions of fossil fuels and biofuel follow the GOCART model (Chin et al., 2002) with updates in the US follow-ing Park et al. (2003). SO2emissions are from the EDGAR-4.1 inventory with altered injection profiles (Buchard et al., 2014) and biomass burning emissions are supplied from the NASA Quick Fire Emission Dataset (QFED) version 2.1. Sea salt aerosol production follows Gong (2003) with added de-pendence on sea surface temperature (Jaeglé et al., 2011). The aerosol optical properties follow GADS, but with mod-ifications to reduce the absorption of dust at short wave-lengths (Sinyuk et al., 2003), and extinction is calculated fol-lowing Mie theory assuming spherical particles (Colarco et al., 2010). MERRAero differs from the other three models used in that the model assimilates AOD information from the MODIS instruments. The assimilation process is explained in detail in Buchard et al. (2016); here we give a brief de-scription. The MODIS reflectances are cloud screened and converted to AOD using a neural net framework. The error covariance between the 2-D MODIS AOD and the model AOD is used to generate 3-D aerosol mass increments. Us-ing a local displacement ensemble methodology, ensembles of isotropic displacements in aerosol mass around a central grid box are weighted based upon the reduction in the error. Different aerosol species can be perturbed in each vertical layer, e.g., to allow a plume to be shifted to better match the MODIS AOD, and therefore aerosol mass can vary indepen-dently for each species.
3 Methodology
3.1 Derivation of dust AOD
Figure 1.The 15 regions considered explicitly in this study are de-fined. Regions are grouped into African (orange), Middle Eastern (red), Asian (blue), and southern hemispheric (green). AERONET sites (gray circles) and Maritime Aerosol Network observations (blue dots) used to bias correct satellite AOD are indicated. The re-gions are identified as (1) mid-Atlantic, (2) northern Africa, (3) Gulf of Guinea, (4) west coast, (5) Mali/Niger, (6) Bodele Depression and Sudan region, (7) northern Middle East, (8) southern Mid-dle East, (9) Kyzyl Kum, (10) Thar, (11) Taklamakan, (12) Gobi, (13) South America, (14) South Africa, and (15) Australia.
dust estimates as possible. The methodology and develop-ment of associated uncertainty estimates are described in de-tail below, but the general methodology is as follows: we rely primarily on satellite retrievals of AOD, which we bias-correct using dust-dominated AERONET AOD retrievals. To partition the retrieved AOD in dusty regions between the component due to dust and the component due to other aerosols, we use simulated estimates of non-dust AOD with several global models in 15 regions that are identified as con-tributing significantly to the global dust AOD. These regions are defined such that they account for most dust AOD, based on model estimates, and are shown in Fig. 1. Finally, model dust AOD is used to estimate the fraction of dust AOD that is outside of the 15 dust-dominated regions, thereby providing global seasonal dust AOD estimates between 2004 and 2008. Our methodology accounts for many uncertainties, includ-ing the satellite retrieval error, estimation of seasonal mean AOD, bias correction, modeled non-dust AOD, and global scaling factors. We discuss potential biases that are not ac-counted for in Sect. 4.4.
We aggregate daily AOD data from MISR and both MODIS instruments (Aqua and Terra) onto a 2◦×2.5◦grid and average over 3-month periods to increase coverage and provide a consistent grid between model and observations. We use bootstrapping (Efron and Gong, 1983) to estimate the random uncertainty in the seasonally averaged AOD due to sampling uncertainty within each grid box. This is achieved by randomly sampling (with replacement) the grid box daily AODntimes, wherenis the number of days with a retrieval
in that 3-month period, and the mean of the samples cal-culated. This is repeated to build a probability distribution of the seasonal AOD for each grid box. We find that a log-normal distribution is a good approximation to the resulting seasonal AOD uncertainty distribution, so we retain the mean and standard deviation of this distribution as the mean and uncertainty on the seasonal log10(AOD) for each grid box.
Although the bootstrapping method quantifies the random error in each grid box’s seasonal AOD, it does not quantify or correct the systematic error (bias) in the AOD. Therefore, we use AERONET AOD as ground truth to apply a bias cor-rection to the satellite-retrieved AOD, with a focus on dust-influenced regions. AERONET hourly AOD (interpolated to 550 nm) is used to produce a morning (10.00–12:00 LT) and afternoon (13.00–15.00 LT) average to compare with daily retrievals from aboard the Terra and Aqua satellites, respec-tively. We compare these at the native satellite retrieval reso-lution and choose a 2-hour window to both cover the approx-imate range of the overpass times and to maximize the num-ber of coincident AERONET and satellite AOD retrievals. We use all AERONET sites within the regions defined in Fig. 1 and aggregate all data in each region for the compar-ison. For the regions encompassing ocean we also use AOD measurements from the AERONET MAN where available (see Fig. 1). We generate histograms of the daily log10(AOD) from AERONET and each satellite instrument using data be-tween 2003 and 2013 (see Figs. S1–S3 in the Supplement) and present the statistics of the bias and linear regression for each region in Table 1. Although 2004–2008 is the main pe-riod of study in this research we use 11 years of AERONET and satellite retrievals to maximize the amount of data and better characterize the biases. More than 100 days of co-located data available are required for the bias correction to be applied to a region – a criterion usually met, except for MISR in some Asian deserts. The standard deviation of the bias correction is derived from each pair of daily log10(AOD) in a region and is used to propagate this uncertainty into the global dust AOD estimate (see below). If not enough data are available, we apply a bias correction of 1.0 (i.e., no bias) with a standard deviation of±50 % to represent the uncertainty.
On average across all sites, both MODIS instruments show a slight high mean annual bias in AOD relative to AERONET retrievals (+10 % for Terra,+4 % for Aqua; see Table 2),
although there is considerable variability between regions and on a day-to-day basis (indicated by the correlation co-efficient, r, in Table 1). MISR is also biased high relative
to AERONET (+16 %), due primarily to retrievals when
Figure 2. Annual non-dust AOD (left) and dust AOD (right) at 550 nm for the four models used in this study. Data are averaged over 2004–2008.
individual satellite instruments into closer agreement. How-ever, the large uncertainty on the bias correction (see Table 1) is a major source of the uncertainty on the global dust AOD (see Table 2).
Although dust aerosol is often the main contributor to the AOD in the regions shown in Fig. 1, other aerosol species can make a significant contribution and need to be accounted for to extract dust AOD from the satellite retrievals of AOD. We use GEOS-Chem, CESM, WRF-Chem, and MERRAero to provide non-dust AOD; using multiple models provides an estimate of the variability in the non-dust portion of the AOD resulting from uncertainty in aerosol emissions and formation mechanisms. Anthropogenic aerosol is generally well characterized by global models, especially on seasonal timescales, and has been regularly evaluated against obser-vations, particularly in the Northern Hemisphere (e.g., Hu et
Table 1.Bias corrections applied to satellite AOD retrievals in each of the regions (see Fig. 1) based on comparison with AERONET daily AOD between 2003 and 2013 (see Figs. S1–S3).
Region AERONET bias correction and correlation coefficient
MODIS (Aqua) MODIS (Terra) MISR NMB r NMB r NMB r
Mid-Atlantic 0.82±0.07 0.93 0.86±0.06 0.93 0.84±0.04 0.93 North Africa 0.91±0.22 0.79 1.01±0.12 0.80 0.99±0.09 0.83 Gulf of Guinea 0.90±0.10 0.84 1.01±0.11 0.83 0.92±0.10 0.82 West coast 1.04±0.17 0.80 1.04±0.19 0.83 0.94±0.10 0.87 Mali/Niger 0.98±0.17 0.86 0.95±0.17 0.87 0.93±0.12 0.83 Bodele/Sudan 1.01±0.19 0.68 0.99±0.19 0.76 0.91±0.07 0.70 Northern Middle East 0.81±0.10 0.75 0.86±0.12 0.73 0.95±0.08 0.77 Southern Middle East 1.01±0.11 0.77 1.06±0.11 0.78 0.88±0.06 0.84 Kyzyl Kum 1.02±0.29 0.83 1.05±0.22 0.82 1.19±0.10 0.80 Thar 1.03±0.12 0.84 1.04±0.15 0.84 1.28±0.14 0.79 Taklamakan 0.82±0.17 0.66 0.98±0.21 0.79 0.77±0.16 0.47 Gobi 0.98±0.41 0.54 0.90±0.42 0.45 0.66±0.28 0.73 South America 0.85±0.15 0.43 0.95±0.22 0.18 0.56±0.15 0.27 South Africa 1.44±0.23 0.73 1.71±0.27 0.74 1.08±0.11 0.89 Australia 1.02±0.32 0.42 1.01±0.28 0.43 0.92±0.10 0.82
significant biomass burning aerosol is present (we consider results with and without these regions, see Table 1). In ad-dition, most regions considered in this study are inland and therefore sea salt aerosol will have a limited impact. Figure 2 displays the climatology of non-dust AOD and dust AOD for each model used, averaged over 2004–2008.
For each 2◦×2.5◦grid box,i, within the 15 regions we ap-ply the AERONET-derived bias correction,α, to the seasonal
satellite AOD,τobs, and subtract the model non-dust AOD, τndmodel, to provide an estimate of the regional dust AOD,τdreg
(Eq. 1). We allow negative values ofτdreg so as not to
intro-duce a positive bias. The uncertainty distribution for each of these three variables – bias correction, satellite log10(AOD), and model non-dust log10(AOD) – is sampled and the aver-age dust AOD is calculated for each region. This process is repeated multiple times to yield a stable distribution of sea-sonal dust AOD (200 times is sufficient for a robust average) for each of the regions between 2004 and 2008. For a sin-gle iteration of the dust AOD calculation we use the same random sampling (sampling the same number of sigma from the mean) for all grid boxes, thereby assuming the worst-case scenario that the uncertainty is correlated spatially. If we use a different sampling of the uncertainty distribution for each grid box, the uncertainty on the global dust AOD drops by approximately a factor of 8.
τdreg= 1 N
N
X
i
αiτiobs−τndmodel,i (1)
The regional dust AOD,τdreg, for the 15 regions is weighted
by surface area,Areg, summed, and scaled by the surface area
of the Earth,AE, to give the total regional contribution to the
global dust AOD (Eq. 2). To obtain the globally averaged dust AOD,τdglob, we calculate the ratio,β, between the
mod-eled dust AOD across all regions and the modmod-eled global dust AOD (Eq. 3).
τdglob=β 1 AE
NXreg
r
Aregτdreg (2)
β= τ
glob,model d
1
AE
NPreg r
Aregτdreg,model
(3)
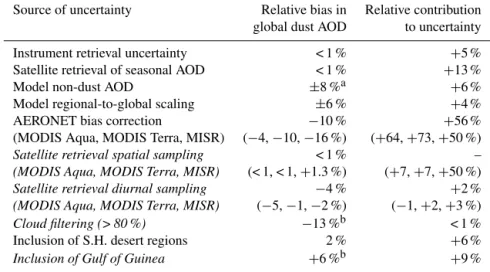
Table 2.Each source of uncertainty is assessed in terms of the impact upon the global dust AOD mean and standard deviation. The sign of the relative uncertainty indicates whether the uncertainty yields a bias about the average or is assumed symmetrical. For the model non-dust AOD and regional-to-global scaling the bias is defined as the difference between the upper and lower estimate of the global dust AOD when the source of uncertainty is isolated. Italicized uncertainties are explored but not incorporated into the global dust AOD uncertainty estimate. Values here are for correlated errors between neighboring 2×2.5◦grid cells; assuming errors within a region are uncorrelated (i.e., a different number of sigma from the mean for each grid cell in an iteration) yields∼8×smaller uncertainty.
Source of uncertainty Relative bias in Relative contribution global dust AOD to uncertainty
Instrument retrieval uncertainty < 1 % +5 % Satellite retrieval of seasonal AOD < 1 % +13 % Model non-dust AOD ±8 %a +6 % Model regional-to-global scaling ±6 % +4 % AERONET bias correction −10 % +56 % (MODIS Aqua, MODIS Terra, MISR) (−4,−10,−16 %) (+64,+73,+50 %)
Satellite retrieval spatial sampling < 1 % –
(MODIS Aqua, MODIS Terra, MISR) (< 1, < 1,+1.3 %) (+7,+7,+50 %)
Satellite retrieval diurnal sampling −4 % +2 %
(MODIS Aqua, MODIS Terra, MISR) (−5,−1,−2 %) (−1,+2,+3 %)
Cloud filtering (> 80 %) −13 %b < 1 %
Inclusion of S.H. desert regions 2 % +6 %
Inclusion of Gulf of Guinea +6 %b +9 %
aMay not be symmetrical about the mean (see Supplement, Fig. S4).bRelative to global dust AOD without
AERONET bias correction.
4 Results
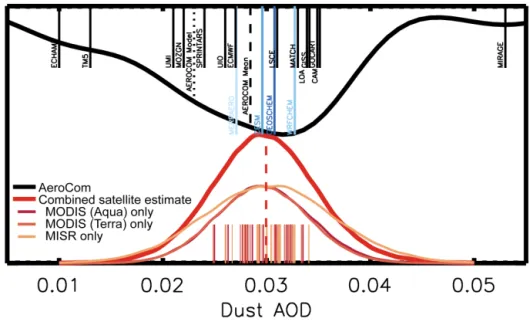
4.1 The observationally constrained global dust AOD Figure. 3 shows the global dust AOD estimates with the asso-ciated probability density function generated using the kernel density estimation method for each satellite and for the entire ensemble. The global dust AOD for the four models used in this study is also displayed, along with the AeroCom models in Huneeus et al. (2011) with the associated probability den-sity function generated using the kernel denden-sity estimation method. Our observational estimate of the global dust AOD is 0.030±0.005 (1σ) and is thus much more narrowly
con-strained than the AeroCom estimate of 0.028±0.011. Over
three-quarters (77 %) of the ensemble members fall above the AeroCom model mean global dust AOD; however, the broadness of the AeroCom model distribution implies that a global dust AOD greater than 0.035 would be required for statistically significant disagreement at the 95 % confi-dence level (i.e.,p <0.05; in this casep=0.63). Relative to
the dust AOD from the four models used in this study (see Fig. 2), all lie within 1σ of the observational estimate. The
average global dust AOD estimates from each satellite instru-ment are remarkably similar (MODIS Aqua: 0.030±0.004;
MODIS Terra: 0.030±0.004; MISR: 0.030±0.006). This is
partially owing to the AERONET bias correction that de-creases the AOD from all satellite instruments and brings them into closer agreement. The AERONET bias correction suggests that the satellite AOD is generally biased high in dusty regions, based on the available data for comparison
Figure 3. The global dust AOD adapted from Huneeus et al. (2011) for 14 AeroCom models (vertical black lines) and the associated probability density function (PDF) (solid black line), mean (dashed black line), and the AeroCom median model (dotted black line) are shown along with the global dust AOD from the four models used in this study (vertical blue lines). The PDF of the observationally constrained dust AOD estimate of this study (red) with the associated mean (dashed red line) is shown on the bottom axis. The PDF of the observationally constrained dust AOD derived from each of the satellite instruments is shown (red hues) with the individual ensemble members (vertical red hue lines).
Figure 4.Annual global dust AOD for 2004–2008 derived from the three satellite instruments (red hues) and from the four models (blue hues). The annual dust AOD from the satellite instruments is an average of the ensemble members for that instrument.
4.2 Uncertainties in the observational estimate of global dust AOD
Table 1 summarizes the uncertainties considered in this study, in terms of both potential bias to the global dust AOD and the contribution to the standard deviation of the esti-mate (0.005). The latter is quantified by assessing the reduc-tion in the spread of the global dust AOD probability density function (PDF) when the uncertainty for a factor is omitted. The leading uncertainty arises from the AERONET bias cor-rection (α, Eq. 1). The bias correction yields a decrease in
the global dust AOD of 10 % and brings the estimates from each satellite instrument into close agreement, but the un-certainty on the bias correction accounts for over half of the ultimate uncertainty on the global dust AOD. The instrument retrieval errors contribute 5 % of the uncertainty, whereas
es-timating the seasonal satellite AOD from a limited number of retrievals contributes 13 % of the total uncertainty. The dif-ference in regional-to-global dust AOD scaling from models and the difference in non-dust AOD from models yield±6
and±8 % uncertainty, respectively, on the estimated global
dust AOD. The latter uncertainty is primarily a consequence of higher non-dust AOD in MERRAero than the other three models and therefore a lower estimate of dust AOD. The un-certainty from non-dust AOD may not be symmetrical about the mean and is discussed further in Sect. 4.4 and in Sup-plement. The regional-to-global scaling factor (β, Eq. 3) is
Figure 5.The absolute change (top) and fractional change (bottom) in the annual MODIS Aqua AOD (averaged over 2004–2008) when applying a filter to remove any Level 3 data that contain more than 80 % cloudy Level 2 pixels.
may not be symmetrical about the mean if the model dust lifetime estimates are biased low, as analysis of dust outflow into the mid-Atlantic suggests (see later discussion).
Other factors that are explored, but not encompassed by the uncertainty estimate on the global dust AOD, are the im-pact of spatial and temporal sampling biases in the satellite data (e.g., overpass timing and frequency, regions of persis-tent cloud, high latitudes), cloud filtering of satellite AOD retrievals, and inclusion of the Gulf of Guinea region. These are also included in Table 1 and discussed below.
Satellite retrieval of AOD is only possible in clear sky con-ditions and at locations that fall within the satellite swath; therefore, the observed dust AOD will not take into account the effect of dust present before or after the satellite overpass and in the presence of clouds. We assess the impact of this sampling bias by processing the AOD from the four mod-els in the same way as the satellite-retrieved AOD, includ-ing maskinclud-ing the daily AOD data where no satellite retrieval is available. By comparing the modeled dust AOD with and without masking, we determine that the impact of satellite sampling upon the global dust AOD estimate is minimal: < 1 % for the MODIS instruments and +1.3 % for MISR.
Masking does, however, increase the uncertainty in the dust AOD estimate by 7 % when sampling is based on MODIS and 50 % when sampling to the sparser MISR retrievals. Be-cause the masking effectively removes cloudy regions, the very small change in the modeled global dust AOD suggests that there is no obvious bias in the global dust AOD when including regions within cloudy air masses, relative to clear-sky only. To explore the clear-clear-sky and all-clear-sky differences further, we calculated GEOS-Chem global dust AOD after masking columns that have > 50 % cloud cover in any grid box, based on MERRA reanalysis. This causes the global dust AOD to increase by 2 %, relative to when no mask-ing is used, indicatmask-ing that the difference between clear-sky and all-sky dust AOD is small. However, we acknowledge that poor representation of clouds in the reanalysis meteo-rology or potential satellite misclassification of heavy dust loading as cloud (Darmenov and Sokolik, 2009) could lead to a stronger perceived relationship between dust loading in cloudy and clear sky conditions.
The sun-synchronous orbit of the Terra and Aqua satel-lites results in overpass at similar morning and afternoon lo-cal time, respectively, each day. Therefore, a significant daily cycle in the AOD would create a bias in the inferred daily AOD. For all dust-influenced AERONET sites, we compare the 10:00–12:00 and 14:00–16:00 LT AOD to the daily AOD (calculated from all available retrievals within the daytime) between 2002 and 2012. We find that, on the days with AE > 0.4 at the AERONET sites used in this study, the AOD during the morning and the afternoon is closely related to the daily AOD, deviating by < 2 % on average. This is in agree-ment with Smirnov et al. (2002), who found that AOD varied diurnally by less than 10 % at dust-influenced AERONET sites. When the satellite-retrieved AOD is bias corrected to the daily AOD, rather than the AOD at time of overpass (as done here), we find that the dust AOD is 4 % lower (see Ta-ble 1).
Figure 6.Observational dust AOD from MODIS Aqua and Terra with (red) and without (blue) filtering of 1◦×1◦daily regions with over 80 % cloud cover. Each line corresponds to a different combination of satellite and model when calculating the dust AOD, indicating the uncertainty. Results are shown without any bias correction from AERONET.
for thin cirrus than for cumulus cloud decks (Levy et al., 2013; Remer et al., 2012). Therefore, removal of large re-gions in which high dust loading is associated with cumulus and stratus clouds may introduce an erroneous negative bias. It is also possible that high AOD retrieval in cloudy regions is the result of hygroscopicity and 3-D cloud effects (Koren et al., 2007; Marshak et al., 2008; Quaas et al., 2010). Indeed, it has been shown in studies using AERONET that AOD can increase dramatically between clouds and may be mistakenly screened as cloud (Eck et al., 2014). While this is a legitimate AOD enhancement, we cannot expect the global models with > 100 km resolution using assimilated meteorology to repro-duce enhancements from near-cloud hygroscopic growth or 3-D cloud effects on scattering. The observational-estimate of dust AOD provided in our analysis does not include the ex-tra cloud filtering; we rely on the screening provided as part of the MODIS retrieval, rather than arbitrarily filtering the cloud-cleared product. However, the AERONET and MAN bias correction does decrease the AOD substantially, espe-cially in the mid-Atlantic (up to a 20 % decrease), and so may
partially account for the higher AOD associated with cloudy regions.
The regions defined around the South American, southern African, and Australian deserts and the outflow cover rela-tively large areas that are only intermittently affected by dust (see Fig. 1). This may increase the likelihood of misattribu-tion of non-dust AOD as dust AOD. We find that including those regions in the analysis does not have a significant im-pact on the global dust AOD, increasing it by 2 %, although it causes a 6 % increase in the uncertainty. In contrast, in-cluding the Gulf of Guinea region increases the dust AOD by
+6 % and increases the uncertainty by 9 %. The dust AOD
is still accounted for in the global dust AOD via the regional-to-global dust AOD scaling (the 14 remaining regions ac-count for 77–87 % of the global dust AOD, depending on the model).
4.3 Comparison of modeled and observed regional dust AOD
Model dust emissions are often tuned to a specific annual global emission mass (Fairlie et al., 2007; Huneeus et al., 2011) or scaled to a global AOD inferred from assimila-tions (Mahowald et al., 2006; Rasch et al., 2001). The an-nual global dust AOD derived from the models in this study shows encouragingly similar interannual variability to the observationally constrained estimates (see Fig. 4). However, tuning the models globally will not necessarily produce the right spatial and seasonal distribution. Here we use the ob-servational constraints developed in this study to highlight regional and seasonal discrepancies between models and ob-servations to isolate potential errors that affect multiple mod-els. We compare the interannual variability globally and the seasonal dust AOD aggregated over broad regions for each of the models with the observational estimates from each satel-lite instrument (Fig. 7a). We also compare the climatological seasonal dust AOD from each model with the range of the observational dust AOD for each region (Fig. 7b). We pro-vide regional disaggregation of these results in Figs. 8 and 9 and summarize the seasonal observational dust AOD for each region in Table 3.
Broadly, in Fig. 7 we see that the models, except MER-RAero, overestimate the amount of dust AOD over Africa with respect to the satellite estimates. The models generally overemphasize winter or spring dust at the expense of sum-mer. This is especially the case for GEOS-Chem (highlighted in Ridley et al., 2014; see Fig. S4 therein) and for CESM, and likely a consequence of the lack of convectively driven dust emissions that will be somewhat alleviated by new param-eterizations (e.g., Pantillon et al., 2016). Switching the dust scheme in GEOS-Chem to a new parameterization that does not rely on an explicit source function (Kok et al., 2014a, b) does not alleviate the seasonality issue in Africa, suggest-ing that the poor performance relative to the other models is likely the result of meteorology rather than the dust param-eterization. Isolating the dust AOD in subregions, we find that the models overestimate dust in the North Africa, West Africa, and Bodele/Sudan regions, while better matching the dust AOD in the mid-Atlantic outflow region, although there is significant variability between the four models (see Figs. 8 and 9 for the subregions).
In the models, dust AOD over North Africa is greater than observed and dust AOD over the mid-Atlantic is often lower than observed (see Fig. 8), even when extra cloud filtering of the satellite retrievals is included. This yields a ratio of the dust AOD over Africa to that over the mid-Atlantic of 3.46±0.25 for the models and 2.30±0.16 based on
observa-Figure 7. (a) Seasonal dust AOD between 2004 and 2008 for observational-based estimates (red hues; each of the 12 lines repre-sents a different ensemble member) and for the models (blue hues). (b) To isolate the seasonality, the difference between model and observational-based seasonal dust AOD, averaged over 2004–2008, is shown. Bar thickness indicates the range of the observational-based estimates for each season; the deviation from zero (dashed line) indicates the bias in model seasonal dust AOD relative to the observations. The regions are based on area-weighted averages over the subset of regions defined in Fig. 1, except Africa, which does not include the mid-Atlantic region (shown separately in Figs. 8 and 9 with other subregions).
tions (2.62±0.16 and 1.63±0.08, respectively, with cloud
re-Table 3.Observational estimates of the seasonal dust AOD in each region of Fig. 1, averaged over 2004–2008. The first three rows show the seasonal dust AOD for the broad regions (grouped by color in Fig. 1; Africa does not include the Gulf of Guinea region)
Region DJF MAM JJA SON
Asia 0.114±0.017 0.237±0.017 0.191±0.027 0.094±0.021 Middle East 0.119±0.012 0.201±0.017 0.250±0.021 0.129±0.014 Africa 0.167±0.007 0.291±0.012 0.298±0.017 0.196±0.015 Northern Africa 0.118±0.011 0.219±0.010 0.207±0.016 0.151±0.016 Mid-Atlantic 0.064±0.013 0.106±0.008 0.143±0.005 0.084±0.006 Mali/Niger 0.257±0.019 0.441±0.022 0.462±0.044 0.277±0.023 Bodele/Sudan 0.191±0.006 0.339±0.023 0.310±0.018 0.212±0.021 West coast 0.180±0.010 0.250±0.019 0.365±0.016 0.233±0.022 Southern Middle East 0.123±0.018 0.204±0.021 0.330±0.044 0.150±0.020 Kyzyl Kum 0.115±0.017 0.176±0.026 0.154±0.034 0.101±0.018 Northern Middle East 0.112±0.011 0.223±0.011 0.164±0.015 0.113±0.019 Thar 0.130±0.029 0.238±0.033 0.319±0.029 0.135±0.037 Gobi 0.093±0.022 0.192±0.022 0.102±0.035 0.047±0.021 Taklamakan 0.119±0.013 0.275±0.027 0.171±0.026 0.104±0.011 South Africa 0.097±0.023 0.073±0.022 0.059±0.021 0.114±0.040 Australia 0.022±0.016 0.008±0.009 −0.005±0.008 0.001±0.023 South America 0.020±0.017 0.000±0.013 −0.012±0.013 0.017±0.013
moval of dust will bias modeled dust lifetime low and re-sult in a conservative observational global dust AOD esti-mate because of the regional-to-global scaling employed in this study. The range of model dust lifetimes results in 13 to 23 % of the global dust AOD coming from regions outside of those considered explicitly in this study and constitutes a
±6 % (0.0018) uncertainty in the observational global dust
AOD estimate (Table 1); therefore, based on the compari-son of dust AOD across the mid-Atlantic it is plausible that the actual global dust AOD is towards the upper limit of this uncertainty bound. While the model representation of trans-port and deposition of mid-Atlantic dust may not be a major factor in the global dust AOD, it could have important impli-cations for the simulation of hurricane genesis and nutrient deposition in the Amazon.
The models consistently underestimate AOD over Asian desert regions throughout most seasons (Fig. 8). The low bias is present across all models and in all seasons except fall, when dust AOD is relatively low. The greatest diver-gence between models and observations occurs in spring AOD peak at the Taklamakan desert and in summer peak in the Thar desert, located between India and Pakistan. Only CESM and MERRAero capture the seasonality in the Thar region. Enhanced summertime coarse mode AOD retrieved at AERONET sites in Karachi and Jaipur, located on either side of the Thar desert, indicates that the models are likely missing dust emissions rather than the observational estimate being biased high. The low bias in modeled dust AOD is less pronounced in the Gobi Desert, where GEOS-Chem and WRF-Chem appear to capture the observed spring peak in dust AOD. However, Fig. 8 indicates that there is
consider-able uncertainty between the observational estimates in the Gobi Desert.
In the Middle East there is a slight low bias in the models relative to the observational dust AOD, through a combina-tion of a substantial low bias in the southern Middle East re-gion and a slightly high bias in the northern Middle East and Kyzyl Kum regions. We find general agreement between the modeled and observed seasonality, with a spring peak in the northern Middle East region and summer peaks in the south-ern Middle East and Kyzyl Kum regions. However, all but MERRAero overemphasize summer dust at the expense of winter in the Kyzyl Kum region. CESM produces too much dust in summer, relative to other seasons, driven by high dust AOD between the southern Middle East and Kyzyl Kum re-gions (the Gulf of Oman) that is present, but weaker, in the satellite observations.
Considering the southern hemispheric regions, our analy-sis indicates that the simulated dust AOD is comparable in Australia and lower than observed in South Africa and South America. However, the uncertainty in the observational dust AOD is too large to draw quantitative conclusions about the model representation of dust in those regions.
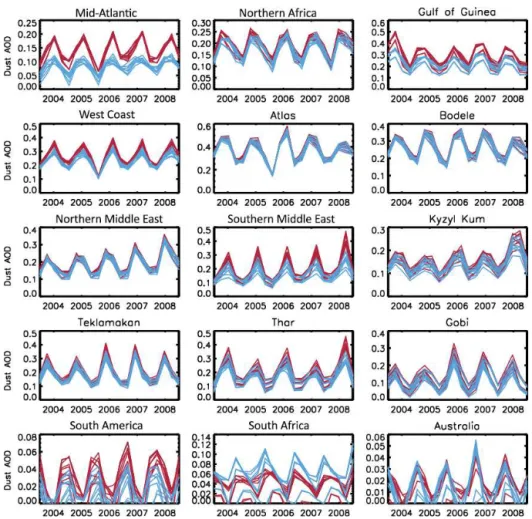
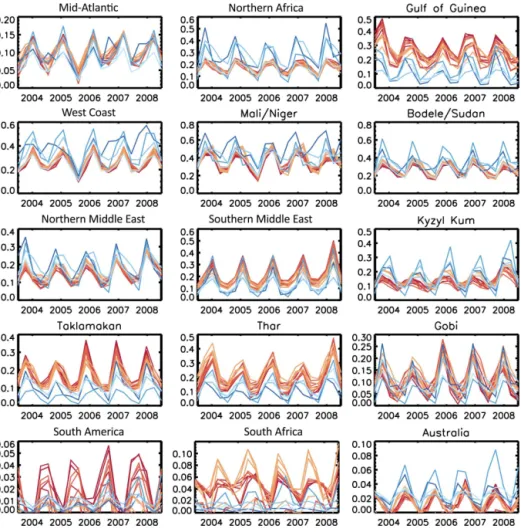
spa-Figure 8.Same as Fig. 7a but for each individual region (in Fig. 1). Observational dust AOD is shown for multiple realizations of MODIS Aqua, MODIS Terra, and MISR (dark to light red). Models are GEOS-Chem, CESM, WRF-Chem, and MERRAero (dark to light blue).
tially resolved surface winds. However, the magnitude of the global dust AOD provided by the MERRAero simulation is the lowest of the four models (0.027) and is 0.003 lower than the observationally constrained estimate presented here (within the 1σ uncertainty bound). The total global AOD
for all species in MERRAero is 5–15 % higher than the other models, while dust accounts for a smaller fraction of the AOD in MERRAero (20 %) than the other models (24– 26 %). This can be interpreted in two ways: either the contri-bution of dust to the total AOD is conservative in MERRAero or the observationally constrained estimates of dust AOD are biased high due to a persistent low bias of non-dust AOD in three of the four models.
4.4 Discussion of the remaining uncertainties
We endeavored to account for the uncertainties and biases in-volved in estimating the global dust AOD from observations; however, uncertainties remain that are difficult to quantify within this study. Potential sources of bias stem from (1) the model non-dust AOD, (2) the model regional-to-global AOD scaling, and (3) treatment of particle morphology and
min-eralogy in models and in the satellite retrievals. These may present additional biases in the observational estimate and contribute to the discrepancies between models and observa-tions.
Figure 9.Same as Fig. 7b but for individual regions (in Fig. 1). Models are GEOS-Chem, CESM, WRF-Chem, and MERRAero (dark to light blue).
Modeled dust AOD is used as a scaling factor to determine the global dust AOD from the regional observational esti-mates. We use multiple models to represent the uncertainty, but there may be a systematic bias present, rather than the
±6 % uncertainty presented (Table 2). If the overzealous
re-moval of dust in models, highlighted in the mid-Atlantic, is a global phenomenon then the models would predict too much dust in the source regions relative to downwind and yield a low regional-to-global scaling factor. Similarly, dust emis-sions schemes currently used in the models are unlikely to reproduce emissions where vegetation cover is variable and will not represent dust from agricultural regions (Ginoux et al., 2012). If those emissions are substantial, then it is possi-ble that tuned emissions in models overestimate emissions from large, permanent dust sources to compensate for the lack of agricultural emissions, which could partially explain model bias towards African emissions.
Some of the discrepancy between the dust AOD from models and observations is likely born out of simplifications in representing particle morphology and mineralogy and the resulting impact on the AOD. The models in this study as-sume a globally fixed refractive index for dust and either
poten-tial biases exist via erroneous filtering of thick dust plumes during the retrieval (Baddock et al., 2016).
5 Conclusions
To provide an observational constraint for the global dust AOD we use three satellite retrievals of AOD over a 5-year period, AERONET observations to correct biases in the satel-lite retrievals, and speciated aerosol AOD from four global chemical transport models to separate the contributions of dust and non-dust AOD. Throughout the analysis we use bootstrapping to retain a robust estimate of the uncertainty on the dust AOD. We determine the global dust AOD to be 0.030±0.005 (1σ), with nearly three-quarters (73 %) of the
ensemble members in this study yielding a larger dust AOD than the mean of the 15 AeroCom models (0.028±0.011)
and all combinations greater than the AeroCom model me-dian (0.023). The observational estimate narrows the likely range of dust AOD by half from that presented by the model estimates. The observational dust AOD is constructed as sea-sonal averages for 5 years (2004–2008) across 15 regions, providing a dataset with which the broad performance of model dust schemes can be evaluated (summarized in Ta-ble 3, with further data availaTa-ble by request to the author).
All four models used in this study are within the one stan-dard deviation uncertainty of the global mean observational estimate. However, it is essential to evaluate models on re-gional and seasonal scales, at which we find considerable dif-ferences. Using the regional and seasonal estimates of dust AOD, we highlight four general discrepancies between the models and observations: (1) the dust AOD across most of North Africa is overestimated in the models; (2) the Asian and Middle Eastern deserts are underrepresented overall; (3) modeled seasonality varies considerably between mod-els, but it generally overestimates winter and spring dust at the expense of summer in Africa and overestimate fall dust at the expense of spring in Asian deserts; and (4) removal of dust exported across the Atlantic appears to be too strong in the models, which may indicate a systematic underesti-mation of dust lifetimes. We have used the observationally constrained estimate of dust AOD to isolate specific regions in which the models disagree with the observations; however, the underlying mechanisms for the discrepancies are unclear and may be driven by the assumed physical characteristics of the surface, by the representation of surface wind, by the subsequent transport and deposition, or likely a combination of all factors. Further research in the areas highlighted in this work is expected to improve model simulations, and hence future estimates of the radiative, human health, and biosphere interactions of mineral dust.
6 Data availability
The GEOS-Chem, WRF-Chem, CESM and MERRAero data used in this study are archived at MIT and avail-able on request from the lead author ([email protected]). The MERRAero speciated aerosol optical depth product can be downloaded from (MERRAero, 2015). The MODIS and MISR Level 3 daily products are available from https: //ladsweb.nascom.nasa.gov/search/ (MODIS, 2015) and https://www-misr.jpl.nasa.gov/getData/accessData/ (MISR, 2015), respectively. AERONET data can be browsed and downloaded from http://aeronet.gsfc.nasa.gov/ (AERONET, 2015) and the Maritime Aerosol Network data is available at http://aeronet.gsfc.nasa.gov/new_web/maritime_aerosol_ network.html (Smirnov et al., 2009).
The Supplement related to this article is available online at doi:10.5194/acp-16-15097-2016-supplement.
Acknowledgements. This work was supported by NASA under grant NN14AP38G. Jasper F. Kok acknowledges support from the National Science Foundation (NSF) under grant 1552519. Chun Zhao is supported by the US Department of Energy (DOE) as part of the Regional & Global Climate Modeling (RGCM) program.
Edited by: Y. Balkanski
Reviewed by: A. Evan and four anonymous referees
References
AERONET: Level 2 “all points” aerosol optical depth, NASA God-dard Space Flight Center, available at: http://aeronet.gsfc.nasa. gov/, last access: May 2015.
Albani, S., Mahowald, N. M., Perry, A. T., Scanza, R. A., Zen-der, C. S., Heavens, N. G., Maggi, V., Kok, J. F., and Otto-Bliesner, B. L.: Improved dust representation in the Commu-nity Atmosphere Model, J. Adv. Model. Earth Syst., 6, 541–570, doi:10.1002/2013MS000279, 2014.
Alexander, B., Park, R. J., Jacob, D. J., Li, Q. B., Yan-tosca, R. M., Savarino, J., Lee, C. C. W., and Thiemens, M. H.: Sulfate formation in sea-salt aerosols: Constraints from oxygen isotopes, J. Geophys. Res.-Atmos., 110, D10307, doi:10.1029/2004JD005659, 2005.
Ångström, A.: The parameters of atmospheric turbidity, Tellus, 16, 64–75, doi:10.1111/j.2153-3490.1964.tb00144.x, 1964. Baddock, M. C., Ginoux, P., Bullard, J. E., and Gill, T.
E.: Do MODIS-defined dust sources have a geomorpho-logical signature?, Geophys. Res. Lett., 43, GL067327, doi:10.1002/2015GL067327, 2016.
Barnard, J. C., Fast, J. D., Paredes-Miranda, G., Arnott, W. P., and Laskin, A.: Technical Note: Evaluation of the WRF-Chem “Aerosol Chemical to Aerosol Optical Properties” Module using data from the MILAGRO campaign, Atmos. Chem. Phys., 10, 7325–7340, doi:10.5194/acp-10-7325-2010, 2010.
Boucher, O., Randall, D., Artaxo, P., Bretherton, C., Feingold, G., Forster, P., Kerminen, V.-M., Kondo, Y., Liao, H., and Lohmann, U.: Clouds and aerosols, in Climate change 2013: The physical science basis, Contribution of working group I to the fifth assess-ment report of the intergovernassess-mental panel on climate change, Cambridge University Press, 571–657, 2013.
Buchard, V., da Silva, A. M., Colarco, P., Krotkov, N., Dickerson, R. R., Stehr, J. W., Mount, G., Spinei, E., Arkinson, H. L., and He, H.: Evaluation of GEOS-5 sulfur dioxide simulations during the Frostburg, MD 2010 field campaign, Atmos. Chem. Phys., 14, 1929–1941, doi:10.5194/acp-14-1929-2014, 2014.
Buchard, V., Silva, A. M. da, Colarco, P. R., Darmenov, A., Ran-dles, C. A., Govindaraju, R., Torres, O., Campbell, J., and Spurr, R.: Using the OMI aerosol index and absorption aerosol opti-cal depth to evaluate the NASA MERRA Aerosol Reanalysis, Atmos. Chem. Phys., 15, 5743–5760, doi:10.5194/acp-15-5743-2015, 2015.
Buchard, V., da Silva, A. M., Randles, C. A., Colarco, P., Ferrare, R., Hair, J., Hostetler, C., Tackett, J., and Winker, D.: Evaluation of the surface PM2.5 in Version 1 of the NASA MERRA Aerosol Reanalysis over the United States, Atmos. Environ. Pt. A„ 125, 100–111, doi:10.1016/j.atmosenv.2015.11.004, 2016.
Cakmur, R. V., Miller, R. L., Perlwitz, J., Geogdzhayev, I. V., Gi-noux, P., Koch, D., Kohfeld, K. E., Tegen, I., and Zender, C. S.: Constraining the magnitude of the global dust cycle by minimiz-ing the difference between a model and observations, J. Geophys. Res.-Atmos., 111, D06207, doi:10.1029/2005JD005791, 2006. Chin, M., Ginoux, P., Kinne, S., Torres, O., Holben, B. N., Duncan,
B. N., Martin, R. V., Logan, J. A., Higurashi, A., and Nakajima, T.: Tropospheric aerosol optical thickness from the GOCART model and comparisons with satellite and Sun photometer mea-surements, J. Atmos. Sci., 59, 461–483, 2002.
Colarco, P., da Silva, A., Chin, M., and Diehl, T.: Online simulations of global aerosol distributions in the NASA GEOS-4 model and comparisons to satellite and ground-based aerosol optical depth, J. Geophys. Res.-Atmos., 115, D14207, doi:10.1029/2009JD012820, 2010.
Darmenov, A. and Sokolik, I. N.: Spatial variability of satellite visible radiances in dust and dust-cloud mixed conditions: Im-plications for dust detection, Geophys. Res. Lett., 36, L14811, doi:10.1029/2009GL038383, 2009.
Dee, D. P., Uppala, S. M., Simmons, A. J., Berrisford, P., Poli, P., Kobayashi, S., Andrae, U., Balmaseda, M. A., Balsamo, G., Bauer, P., Bechtold, P., Beljaars, A. C. M., van de Berg, L., Bid-lot, J., Bormann, N., Delsol, C., Dragani, R., Fuentes, M., Geer, A. J., Haimberger, L., Healy, S. B., Hersbach, H., Hólm, E. V., Isaksen, L., Kållberg, P., Köhler, M., Matricardi, M., McNally, A. P., Monge-Sanz, B. M., Morcrette, J.-J., Park, B.-K., Peubey, C., de Rosnay, P., Tavolato, C., Thépaut, J.-N., and Vitart, F.: The ERA-Interim reanalysis: configuration and performance of the data assimilation system, Q. J. R. Meteorol. Soc., 137, 553–597, doi:10.1002/qj.828, 2011.
Drury, E., Jacob, D. J., Spurr, R. J. ., Wang, J., Shinozuka, Y., Ander-son, B. E., Clarke, A. D., Dibb, J., McNaughton, C., and Weber,
R.: Synthesis of satellite (MODIS), aircraft (ICARTT), and sur-face (IMPROVE, EPA-AQS, AERONET) aerosol observations over eastern North America to improve MODIS aerosol retrievals and constrain surface aerosol concentrations and sources, J. Geo-phys. Res., 115, D14204, doi:10.1029/2009JD012629, 2010. Eck, T. F., Holben, B. N., Reid, J. S., Dubovik, O., Smirnov,
A., O’Neill, N. T., Slutsker, I., and Kinne, S.: Wavelength de-pendence of the optical depth of biomass burning, urban, and desert dust aerosols, J. Geophys. Res.-Atmos., 104, 31333– 31349, doi:10.1029/1999JD900923, 1999.
Eck, T. F., Holben, B. N., Reid, J. S., Arola, A., Ferrare, R. A., Hostetler, C. A., Crumeyrolle, S. N., Berkoff, T. A., Welton, E. J., Lolli, S., Lyapustin, A., Wang, Y., Schafer, J. S., Giles, D. M., Anderson, B. E., Thornhill, K. L., Minnis, P., Pickering, K. E., Loughner, C. P., Smirnov, A., and Sinyuk, A.: Observations of rapid aerosol optical depth enhancements in the vicinity of pol-luted cumulus clouds, Atmos. Chem. Phys., 14, 11633–11656, doi:10.5194/acp-14-11633-2014, 2014.
Efron, B. and Gong, G.: A Leisurely Look at the Bootstrap, the Jackknife, and Cross-Validation, Am. Stat., 37, 36–48, doi:10.1080/00031305.1983.10483087, 1983.
Emmons, L. K., Walters, S., Hess, P. G., Lamarque, J.-F., Pfister, G. G., Fillmore, D., Granier, C., Guenther, A., Kinnison, D., Laepple, T., Orlando, J., Tie, X., Tyndall, G., Wiedinmyer, C., Baughcum, S. L., and Kloster, S.: Description and evaluation of the Model for Ozone and Related chemical Tracers, version 4 (MOZART-4), Geosci. Model Dev., 3, 43–67, doi:10.5194/gmd-3-43-2010, 2010.
Evan, A. T., Flamant, C., Fiedler, S., and Doherty, O.: An analy-sis of aeolian dust in climate models, Geophys. Res. Lett., 41, GL060545, doi:10.1002/2014GL060545, 2014.
Evans, J., van Donkelaar, A., Martin, R. V., Burnett, R., Rainham, D. G., Birkett, N. J., and Krewski, D.: Estimates of global mortal-ity attributable to particulate air pollution using satellite imagery, Environ. Res., 120, 33–42, doi:10.1016/j.envres.2012.08.005, 2013.
Fairlie, T. D., Jacob, D. J., and Park, R. J.: The impact of transpacific transport of mineral dust in the United States, Atmos. Environ., 41, 1251–1266, 2007.
Fast, J. D., Gustafson, W. I., Easter, R. C., Zaveri, R. A., Barnard, J. C., Chapman, E. G., Grell, G. A., and Peckham, S. E.: Evolution of ozone, particulates, and aerosol direct ra-diative forcing in the vicinity of Houston using a fully coupled meteorology-chemistry-aerosol model, J. Geophys. Res.-Atmos., 111, D21305, doi:10.1029/2005JD006721, 2006.
Ford, B. and Heald, C. L.: Exploring the uncertainty associated with satellite-based estimates of premature mortality due to exposure to fine particulate matter, Atmos. Chem. Phys., 16, 3499–3523, doi:10.5194/acp-16-3499-2016, 2016.
Fountoukis, C. and Nenes, A.: ISORROPIA II: a computa-tionally efficient thermodynamic equilibrium model for K+– Ca+
2–Mg+2–NH+4–Na+–SO2−4 –NO3–Cl–H2O aerosols, Atmos. Chem. Phys., 7, 4639–4659, doi:10.5194/acp-7-4639-2007, 2007.
French, N. H. F., Goovaerts, P., and Kasischke, E. S.: Uncertainty in estimating carbon emissions from boreal forest fires, J. Geophys. Res.-Atmos., 109, D14S08, doi:10.1029/2003JD003635, 2004. Ginoux, P., Chin, M., Tegen, I., Prospero, J. M., Holben, B.,
aerosols simulated using the GOCART model, J. Geophys. Res., 106, 20255–20273, 2001.
Ginoux, P., Prospero, J. M., Gill, T. E., Hsu, N. C., and Zhao, M.: Global-scale attribution of anthropogenic and natural dust sources and their emission rates based on MODIS Deep Blue aerosol products, Rev. Geophys., 50, doi:10.1029/2012RG000388, 2012.
Gong, S.: A parameterization of sea-salt aerosol source function for sub- and super-micron particles, Global Biochem. Cy., 17, 1097, 2003.
Heald, C. L. and Spracklen, D. V.: Land Use Change Impacts on Air Quality and Climate, Chem. Rev., 115, 4476–4496, doi:10.1021/cr500446g, 2015.
Heald, C. L., Ridley, D. A., Kroll, J. H., Barrett, S. R. H., Cady-Pereira, K. E., Alvarado, M. J., and Holmes, C. D.: Contrasting the direct radiative effect and direct radiative forcing of aerosols, Atmos. Chem. Phys., 14, 5513–5527, doi:10.5194/acp-14-5513-2014, 2014.
Hess, M., Koepke, P., and Schult, I.: Optical propeties of aerosol and clouds: The software package OPAC, Bull. Am. Meteorol. Soc., 79, 831–844, 1998a.
Hess, M., Koepke, P., and Schult, I.: Optical propeties of aerosol and clouds: The software package OPAC, Bull. Am. Meteorol. Soc., 79, 831–844, 1998b.
Holben, B. N., Eck, T. F., Slutsker, I., Tanré, D., Buis, J. P., Setzer, A., Vermote, E., Reagan, J. A., Kaufman, Y. J., Nakajima, T., Lavenu, F., Jankowiak, I., and Smirnov, A.: AERONET—A Federated Instrument Network and Data Archive for Aerosol Characterization, Remote Sens. Environ., 66, 1–16, doi:10.1016/S0034-4257(98)00031-5, 1998.
Hsu, N. C., Tsay, S.-C., King, M. D., and Herman, J. R.: Aerosol properties over bright-reflecting source re-gions, IEEE Trans. Geosci. Remote Sens., 42, 557–569, doi:10.1109/TGRS.2004.824067, 2004.
Hsu, N. C., Tsay, S. C., King, M. D., and Herman, J. R.: Deep blue retrievals of Asian aerosol properties during ACE-Asia, IEEE Trans. Geosci. Remote Sens., 44, 3180–3195, doi:10.1109/tgrs.2006.879540, 2006.
Hsu, N. C., Jeong, M.-J., Bettenhausen, C., Sayer, A. M., Hansell, R., Seftor, C. S., Huang, J., and Tsay, S.-C.: Enhanced Deep Blue aerosol retrieval algorithm: The second generation, J. Geophys. Res.-Atmos., 118, 9296–9315, doi:10.1002/jgrd.50712, 2013. Hu, Z., Zhao, C., Huang, J., Leung, L. R., Qian, Y., Yu, H., Huang,
L., and Kalashnikova, O. V.: Trans-Pacific transport and evolu-tion of aerosols: evaluaevolu-tion of quasi-global WRF-Chem simula-tion with multiple observasimula-tions, Geosci. Model Dev., 9, 1725– 1746, doi:10.5194/gmd-9-1725-2016, 2016.
Huneeus, N., Schulz, M., Balkanski, Y., Griesfeller, J., Prospero, J., Kinne, S., Bauer, S., Boucher, O., Chin, M., Dentener, F., Diehl, T., Easter, R., Fillmore, D., Ghan, S., Ginoux, P., Grini, A., Horowitz, L., Koch, D., Krol, M. C., Landing, W., Liu, X., Mahowald, N., Miller, R., Morcrette, J.-J., Myhre, G., Penner, J., Perlwitz, J., Stier, P., Takemura, T., and Zender, C. S.: Global dust model intercomparison in AeroCom phase I, Atmos. Chem. Phys., 11, 7781–7816, doi:10.5194/acp-11-7781-2011, 2011. Hurrell, J. W.: 2011 Community Earth System Model (cesm)
Tutorial, 1–5 August 2011, University Corporation for At-mospheric Research, available at: http://www.osti.gov/scitech/ biblio/1096191 (last access: 7 April 2016), 2013.
Jaeglé, L., Quinn, P. K., Bates, T. S., Alexander, B., and Lin, J.-T.: Global distribution of sea salt aerosols: new constraints from in situ and remote sensing observations, Atmos. Chem. Phys., 11, 3137–3157, doi:10.5194/acp-11-3137-2011, 2011.
Jin, Q., Wei, J., Yang, Z.-L., Pu, B., and Huang, J.: Consistent re-sponse of Indian summer monsoon to Middle East dust in obser-vations and simulations, Atmos. Chem. Phys., 15, 9897–9915, doi:10.5194/acp-15-9897-2015, 2015.
Kahn, R. A., Gaitley, B. J., Garay, M. J., Diner, D. J., Eck, T. F., Smirnov, A., and Holben, B. N.: Multiangle Imaging SpectroRa-diometer global aerosol product assessment by comparison with the Aerosol Robotic Network, J. Geophys. Res.-Atmos., 115, D23209, doi:10.1029/2010jd014601, 2010.
Kalashnikova, O. V. and Sokolik, I. N.: Importance of shapes and compositions of wind-blown dust particles for remote sens-ing at solar wavelengths, Geophys. Res. Lett., 29, 38-1–38-4, doi:10.1029/2002GL014947, 2002.
Kalashnikova, O. V. and Sokolik, I. N.: Modeling the radiative prop-erties of nonspherical soil-derived mineral aerosols, J. Quant. Spectrosc. Ra., 87, 137–166, doi:10.1016/j.jqsrt.2003.12.026, 2004.
Kalashnikova, O. V., Kahn, R., Sokolik, I. N., and Li, W.-H.: Abil-ity of multiangle remote sensing observations to identify and distinguish mineral dust types: Optical models and retrievals of optically thick plumes, J. Geophys. Res.-Atmos., 110, D18S14, doi:10.1029/2004JD004550, 2005.
Kok, J. F.: A scaling theory for the size distribution of emitted dust aerosols suggests climate models underestimate the size of the global dust cycle, P. Natl. Acad. Sci., 108, 1016–1021, 2011a. Kok, J. F.: Does the size distribution of mineral dust aerosols depend
on the wind speed at emission?, Atmos. Chem. Phys., 11, 10149– 10156, doi:10.5194/acp-11-10149-2011, 2011b.
Kok, J. F., Parteli, E. J. R., Michaels, T. I., and Karam, D. B.: The physics of wind-blown sand and dust, Rep. Prog. Phys., 75, 106901, doi:10.1088/0034-4885/75/10/106901, 2012.
Kok, J. F., Mahowald, N. M., Fratini, G., Gillies, J. A., Ishizuka, M., Leys, J. F., Mikami, M., Park, M.-S., Park, S.-U., Van Pelt, R. S., and Zobeck, T. M.: An improved dust emission model – Part 1: Model description and comparison against measure-ments, Atmos. Chem. Phys., 14, 13023–13041, doi:10.5194/acp-14-13023-2014, 2014a.
Kok, J. F., Albani, S., Mahowald, N. M., and Ward, D. S.: An im-proved dust emission model – Part 2: Evaluation in the Com-munity Earth System Model, with implications for the use of dust source functions, Atmos. Chem. Phys., 14, 13043–13061, doi:10.5194/acp-14-13043-2014, 2014b.
Kok, J. F., Ridley, D. A., Zhou, Q., Zhao, C., Miller, R. L., Heald, C. L., and Haustein, K.: Integrative analysis of desert dust size and abundance suggests less dust climate cooling, Nat. Geosci., in review, 2016.
Koren, I., Remer, L. A., Kaufman, Y. J., Rudich, Y., and Martins, J. V.: On the twilight zone between clouds and aerosols, Geophys. Res. Lett., 34, L08805, doi:10.1029/2007GL029253, 2007. Lamarque, J.-F., Emmons, L. K., Hess, P. G., Kinnison, D. E.,