HESSD
8, 9173–9227, 2011Characterization of the hydrological functioning of the
Niger basin
V. Pedinotti et al.
Title Page
Abstract Introduction
Conclusions References
Tables Figures
◭ ◮
◭ ◮
Back Close
Full Screen / Esc
Printer-friendly Version
Interactive Discussion
Discussion
P
a
per
|
Dis
cussion
P
a
per
|
Discussion
P
a
per
|
Discussio
n
P
a
per
|
Hydrol. Earth Syst. Sci. Discuss., 8, 9173–9227, 2011 www.hydrol-earth-syst-sci-discuss.net/8/9173/2011/ doi:10.5194/hessd-8-9173-2011
© Author(s) 2011. CC Attribution 3.0 License.
Hydrology and Earth System Sciences Discussions
This discussion paper is/has been under review for the journal Hydrology and Earth System Sciences (HESS). Please refer to the corresponding final paper in HESS if available.
Characterization of the hydrological
functioning of the Niger basin using the
ISBA-TRIP model
V. Pedinotti1,2, A. Boone1, B. Decharme1, J. F. Cr ´etaux3, N. Mognard3, G. Panthou4, and F. Papa3
1
CNRM/GAME, M ´et ´eo-France, CNRS, URA1357, Toulouse, France
2
Centre National d’ ´etudes spatiales (CNES), Toulouse, France
3
Laboratoire d’Etudes en G ´eophysique et Oc ´eanographie Spatiales (LEGOS), Toulouse, France
4
Laboratoire d’ ´etude des Transferts en Hydrologie et Environnement (LTHE), Grenoble, France
Received: 30 September 2011 – Accepted: 6 October 2011 – Published: 14 October 2011
Correspondence to: V. Pedinotti ([email protected])
HESSD
8, 9173–9227, 2011Characterization of the hydrological functioning of the
Niger basin
V. Pedinotti et al.
Title Page
Abstract Introduction
Conclusions References
Tables Figures
◭ ◮
◭ ◮
Back Close
Full Screen / Esc
Printer-friendly Version
Interactive Discussion
Discussion
P
a
per
|
Dis
cussion
P
a
per
|
Discussion
P
a
per
|
Discussio
n
P
a
per
|
Abstract
During the 70s and 80s, West Africa has faced extreme climate variations with ex-tended extreme drought conditions. Of particular importance is the Niger basin, since it traverses a large part of the Sahel and is thus a critical source of water in this semi arid region. However, the understanding of the hydrological processes over this basin 5
is currently limited by the lack of spatially distributed surface water and discharge mea-surements. The purpose of this study is to use the ISBA-TRIP continental hydrologic system to explore key processes related to the hydrological cycle of the Niger Basin. The scheme accounts explicitly for the surface river routing, for the floodplains dy-namic, and for the water storage using a deep aquifer reservoir. In the current study, 10
simulations are done at a 0.5 by 0.5◦ spatial resolution over the 2002–2007 period us-ing the atmospheric forcus-ing provided by the AMMA Land surface Model Intercompari-son Project (ALMIP). The model is intensively compared to in situ discharge measure-ments as well as satellite derived flood extent, total continental water storage changes and river height changes. The flooding scheme leads to a non-negligible increase of 15
evaporation over large flooded areas, which decrease the Niger river flow by 15 % to 50 %, according to the observed station and the rainfall dataset used as forcing. This contributes to improve the simulation of the river discharges confirming for the need to incorporate flood representations into Land Surface Model. The model provides a good estimation of the surface water dynamics and accurately simulates the endorheic prop-20
erty of the Northern part of the basin. Moreover, the deep aquifer reservoir improves Niger low flows and the recession law during the dry season. This study also gives a basic estimation of aquifer recharge and of the total terrestrial water budget. The com-parison with 3 satellite products from the Gravity Recovery and Climated Experiment (GRACE) is really optimistic and show a non negligible contribution of the deeper soil 25
HESSD
8, 9173–9227, 2011Characterization of the hydrological functioning of the
Niger basin
V. Pedinotti et al.
Title Page
Abstract Introduction
Conclusions References
Tables Figures
◭ ◮
◭ ◮
Back Close
Full Screen / Esc
Printer-friendly Version
Interactive Discussion
Discussion
P
a
per
|
Dis
cussion
P
a
per
|
Discussion
P
a
per
|
Discussio
n
P
a
per
|
impacts on the model dynamics which gives perspectives for improving the model in-put parameters using future developments in remote sensing technologies such as the joint CNES-NASA satellite project SWOT (Surface Water Ocean Topography), which will provide water heights and extent at land surface with an unprecedented 50–100 m resolution and precision.
5
1 Introduction
Over the past 5 decades, West Africa has faced extreme climate variations with ex-tended extreme drought conditions most recently during the 70s and 80s. In this re-gion, precipitation is closely linked with the monsoon, and better understanding and prediction are needed for improved water resource management. With an approximate 10
length of 4180 km (2600 miles), the Niger river is the largest river in West Africa. It starts in the Guinea Highlands in southeastern Guinea and ends in Nigeria, discharg-ing through a massive delta into the Gulf of Guinea within the Atlantic Ocean. It is a significant source of water and food for West Africa which, as an agricultural region, is highly dependent on the water availability and management practices.
15
According to several studies (Coe, 1998; Andersen et al., 2005; Dadson et al., 2010), the seasonal and interannual cycle of the Niger river discharge is influenced by the hy-drological processes including overland processes (precipitation, evaporation, stream flows, floods, infiltration etc.) and underground processes (groundwater and/or deep aquifer recharge). These processes are theorized to have feedbacks with the climate, 20
rainfall variability and the carbon cycle (Houwelling et al., 1999; Matthews, 2000; Bous-quet et al., 2006; Taylor, 2010b; Taylor et al., 2011). Thus, a better parameterization of hydrological processes in atmospheric general circulation models (AGCMs) is neces-sary to obtain a better understanding of the feedbacks with the West African monsoon. This could then potentially translate into improved water resource management and 25
HESSD
8, 9173–9227, 2011Characterization of the hydrological functioning of the
Niger basin
V. Pedinotti et al.
Title Page
Abstract Introduction
Conclusions References
Tables Figures
◭ ◮
◭ ◮
Back Close
Full Screen / Esc
Printer-friendly Version
Interactive Discussion
Discussion
P
a
per
|
Dis
cussion
P
a
per
|
Discussion
P
a
per
|
Discussio
n
P
a
per
|
Currently, the representation of the surface component of the hydrological cycle in AGCMs is done using continental hydrological systems (CHSs) composed of land sur-face models (LSMs), which provide the lower boundary conditions for heat, momentum and mass. Some AGCMs go further and include river routing models (RRMs) which are used to convert the runoffsimulated by the LSMs into river discharge. RRMs trans-5
fer the continental freshwater into the oceans at specific locations (as source terms for the ocean model component). The evaluation of LSM-RRM systems is therefore a cru-cial task. This is generally done using offline simulations driven by atmospheric forcing which is as realistic as possible: such forcing are usually generated using a combina-tion of atmospheric model reanalysis or short term forecasts combined with satellite-10
based products which are calibrated or bias corrected using gauge data (Dirmeyer et al., 2006; Sheffield et al., 2006). These simulations are then evaluated with in situ river discharge data, which does not guarantee that the spatiotemporal distribution of water storage over and under the land surface is well represented. Over West Africa especially, measurement data are difficult to access due to geographical, geopolitical 15
and economic issues. In this context, satellite remote sensing techniques (Alsdorf and Lettenmaier, 2003; Alsdorf et al., 2007; Wigneron et al., 2003; Grippa et al., 2004) have become useful tools for hydrologic investigations. For instance, efforts have al-ready been done to quantify the soil water content/groundwater using satellite data (Rodell et al., 2009; Grippa et al., 2011). Satellite altimetry has also been used for 20
systematic monitoring of water levels in large rivers, lakes and floodplains and several studies have demonstrated the capability of using these sensors locally for estimat-ing river discharge in large rivers (still limited to rivers with a width of few kilometers), including the Amazon River (Leon et al., 2006; Calmant et al., 2008; Getirana et al., 2010), the Ganges-Brahmaputra (Papa et al., 2010a) or the Lake Chad Basin (Coe 25
HESSD
8, 9173–9227, 2011Characterization of the hydrological functioning of the
Niger basin
V. Pedinotti et al.
Title Page
Abstract Introduction
Conclusions References
Tables Figures
◭ ◮
◭ ◮
Back Close
Full Screen / Esc
Printer-friendly Version
Interactive Discussion
Discussion
P
a
per
|
Dis
cussion
P
a
per
|
Discussion
P
a
per
|
Discussio
n
P
a
per
|
CNES-NASA Surface Water Ocean Topography (SWOT, to be launched in 2020) mis-sion will measure the surface water height with an unprecedented resolution of 50 m over the globe (Alsdorf et al., 2007; Rodriguez, 2009). This will enable a global scale near real time monitoring of the majority of the worlds rivers, lakes and reservoirs with spatial resolution of about one hectare (Lee et al., 2010; Biancamaria et al., 2010). 5
The need for a better representation of the global water budget has resulted in nu-merous implementations of river routing schemes into LSMs, and they vary widely in their complexity and degree of calibration. For water management applications on the watershed scale, highly parameterized, geographically specific models can be used to provide accurate estimates of streamflow and reservoir status (Zagona et al., 2001; 10
Dai and Labadie, 2001; Habets et al., 2008). For global scale applications, however, computationally efficient, easily parameterized, comparatively simple and physically-based routing methodologies are preferable. An early influential effort at large scale routing was done by Vorosmarty et al. (1989) who prepared a river routing network for the Amazon basin at a 0.5◦ resolution. Runoffproduced by a water balance approach 15
was routed through the network using a linear transfer model, with flow time calculated as a function of flow length, estimated subgrid scale sinuosity, and grid scale velocities estimated on the basis of mean downstream discharge (Leopold et al., 1964). A sim-ilar linear transfer model was adopted by Miller et al. (1994) for application within the Goddard Institute for Space Studies (GISS) General Circulation Model (GCM) at the 20
global scale. In their formulation, runoffproduced by a GCM at 4◦×5◦was routed to the ocean through a 2◦×2.5◦ network in which flow direction was determined by topogra-phy and velocity was a function of the slope. Because the scale of the implementation was quite coarse, slope based estimates of velocity were intentionally calculated to yield low values, providing an implicit correction for subgrid scale sinuosity and the 25
HESSD
8, 9173–9227, 2011Characterization of the hydrological functioning of the
Niger basin
V. Pedinotti et al.
Title Page
Abstract Introduction
Conclusions References
Tables Figures
◭ ◮
◭ ◮
Back Close
Full Screen / Esc
Printer-friendly Version
Interactive Discussion
Discussion
P
a
per
|
Dis
cussion
P
a
per
|
Discussion
P
a
per
|
Discussio
n
P
a
per
|
and Foley (1997) adopted the velocity estimation procedure of Miller et al. (1994). As a refinement, they estimated the sinuosity coefficient independently for each tributary within the Amazon basin, and they adjusted velocities as a function of stream order. Costa and Foley (1997) further divided runoffinto surface and subsurface components and applied differential source retention times to each. Further variants on the Miller 5
et al. (1994) approach include the global hydrological routing algorithm (HYDRA, Coe, 2000), which was implemented at a 5◦ resolution and included variability in surface waters, and made some adjustments to the Miller et al. (1994) method for calculat-ing distributed velocities. Oki and Sud (1998) and Oki et al. (1999) continued this line of application through the development of the topographically corrected integrat-10
ing pathways for routing models, TRIP (Total RunoffIntegrating Pathways). Arora and Boer (1999) implemented a time-evolving velocity that depends on the amount of runoff
generated in the GCM land grid, using Mannings equation to estimate flow velocities for a river chanel with a rectangular section. More recently, Decharme et al. (2008, 2011) used this approach to implement a flood routing scheme into the ISBA (Inter-15
action Soil Biosphere Atmosphere)-TRIP CHS. The scheme accounts explicitly for the river routing, precipitation interception by the floodplains, the direct evaporation from the free water surface, and the possible re-infiltration into the soil in flooded areas. The regional and global evaluations of this scheme at a 1◦ by 1◦ spatial resolution em-phasized the importance of floodplains in the continental part of the hydrologic cycle, 20
through generally improved river discharges and a non-negligible increase of evapo-transpiration. However, it was noticed that over some basins, including the Niger, the discharge was still overestimated (Decharme et al., 2011). A possible identified cause was that these regions might overlie large aquifers that can be relatively uncoupled to the river. The difficulty of modeling the Niger basin and the current concerns about 25
HESSD
8, 9173–9227, 2011Characterization of the hydrological functioning of the
Niger basin
V. Pedinotti et al.
Title Page
Abstract Introduction
Conclusions References
Tables Figures
◭ ◮
◭ ◮
Back Close
Full Screen / Esc
Printer-friendly Version
Interactive Discussion
Discussion
P
a
per
|
Dis
cussion
P
a
per
|
Discussion
P
a
per
|
Discussio
n
P
a
per
|
as recently available satellite derived data over the period 2002–2007, which covers the core observation period of the African Monsoon Multidisciplinary Analysis (AMMA) project (Redelsperger et al., 2006).
In this study, we first examine the routing scheme and its ability to simulate discharge simulated by LSMs from the AMMA Land surface Model Intercomparison Project 5
(ALMIP). For this, TRIP was run in offline mode (default made with no feedbacks with LSMs) with total runofffrom 11 LSMs, including ISBA, as input data in order to explore the impact of routing alone on the river discharge. Secondly, we evaluate the ISBA-TRIP CHS model, in fully coupled LSM-RRM mode and with the addition of an aquifer reservoir. The evaluation is done using a large variety of data, consisting of gauging 10
measurements for discharge and satellite-based products such as water heights and flooded areas. The study also attempts to give quantitative estimates of the different water budget components over the basin using comparisons with the Gravity Recovery and Climate Experiments (GRACE) products. In Sect. 4, sensitivity tests were per-formed to determine the robustness of the model and where the greatest uncertainties 15
exist with respect to model parameters. Finally, the ability of the model to reproduce the endorheic property of the basin is presented in Sect. 5.
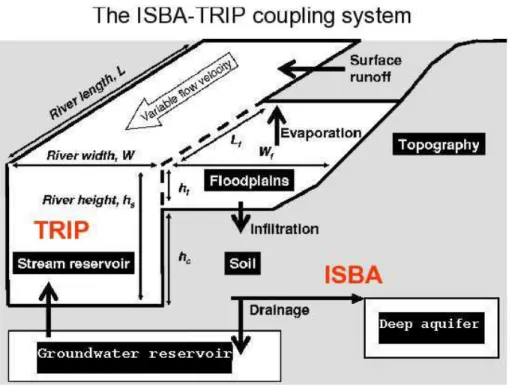
2 The ISBA-TRIP model
2.1 Review of the ISBA-TRIP model
ISBA is a state-of-the-art land surface model which calculates the time evolution of 20
the surface energy and water budgets (Noilhan and Planton, 1989). In this paper, we use the 3-layer force-restore option (Boone et al., 1999). It includes a comprehen-sive sub-grid hydrology to account for the heterogeneity of precipitation, topography and vegetation in each grid cell. A TOPMODEL approach (Beven and Kirkby, 1979) has been used to simulate a saturated fraction,fsat, where precipitation is entirely con-25
HESSD
8, 9173–9227, 2011Characterization of the hydrological functioning of the
Niger basin
V. Pedinotti et al.
Title Page Abstract Introduction Conclusions References Tables Figures ◭ ◮ ◭ ◮ Back Close
Full Screen / Esc
Printer-friendly Version Interactive Discussion Discussion P a per | Dis cussion P a per | Discussion P a per | Discussio n P a per |
sub-grid exponential distributions of rainfall intensity and soil maximum infiltration ca-pacity (Decharme and Douville, 2006).
The TRIP RRM was developed by Oki and Sud (1998) at the University of Tokyo. It was first used at M ´et ´eo-France to convert the model simulated runoffinto river dis-charge using a global river channel network at a 1◦resolution. The original TRIP model 5
is only based on a single surface prognostic reservoir,S (kg), whose discharge is lin-early related to the river mass using a uniform and constant flow velocity.
In the new ISBA-TRIP CHS, TRIP takes into account a simple groundwater reservoir,
G(kg), which can be seen as a simple soil-water storage, and a variable stream flow velocity computed via the Mannings equation (Decharme et al., 2010; Appendix A). 10
In addition, ISBA-TRIP includes a two-way flood scheme in which a flooded fraction,
fflood, of the grid cell can be determinate (Decharme et al., 2008, 2011). The flood dy-namics is indeed described through the daily coupling between the ISBA land surface model and the TRIP river routing model including a prognostic flood reservoir,F (kg). This reservoir fills when the river height exceeds the critical river bankfull height, hc 15
(m), and vice-versa (Appendix B). The flood interacts with the soil hydrology through infiltration,If(kg s−
1
), and with the overlying atmosphere through precipitation intercep-tionPf (kg s−
1
) and free water surface evaporationEf(kg s− 1
). This results in a system of three prognostic equations:
∂G
∂t = Qsb − Q G out
∂S ∂t = Q
S in + Q
G out +
QFout − QFin
−QSout
∂F ∂t = Q
F
in + (Pf − If − Ef) − Q F out
(1) 20
whereQsb(kg s− 1
HESSD
8, 9173–9227, 2011Characterization of the hydrological functioning of the
Niger basin
V. Pedinotti et al.
Title Page Abstract Introduction Conclusions References Tables Figures ◭ ◮ ◭ ◮ Back Close
Full Screen / Esc
Printer-friendly Version Interactive Discussion Discussion P a per | Dis cussion P a per | Discussion P a per | Discussio n P a per |
discharge, whileQinF and QFout (kg s−1) represent the flood inflow and outflow respec-tively. See Appendix A and B for more details.
The global evaluation of the ISBA-TRIP CHS model at a 1◦ by 1◦ resolution sug-gested that the model may not take into account some important process such as the presence of large aquifers in certain regions (Decharme et al., 2011). Also, by com-5
paring the chemical composition of river water and groundwater, Fontes et al. (1991) demonstrated that significant aquifer recharge occurs in the Niger Inland Delta region, especially during summer flooding. For these reasons, a simple linear aquifer reservoir was added to the model. This reservoir was built on the example of the groundwater reservoir, G, but with a significantly longer time delay factor, τaq (s). This results in a 10
new system of four prognostic equations:
∂G
∂t = αQsb − Q G out
∂S ∂t = Q
S in + Q
G out +
QFout − QFin
−QSout
∂F ∂t = Q
F
in + (Pf − If − Ef) − Q F out
∂Aq
∂t = (1 − α)Qsb − Q Aq out
(2)
whereαrepresents the fraction of deep drainage going into the groundwater reservoir while the rest of the drainage (1−α) goes into the aquifer. Unlike the groundwater reservoir, we assume that the aquifer reservoir local feedbacks are negligible, but it 15
contributes to the flow at the mouth of the river. The aquifer outflowQAqout (kg s−1) can be written as follows: QAqout = τAqAq (3) whereτAq(s) is a constant and uniform time delay factor, which represents the time for the aquifer reservoir to drain laterally to the ocean (out of the basin). This simple approach is currently motivated mainly by the lack of data describing the water table, which would be required for a more detailed approach. 20
HESSD
8, 9173–9227, 2011Characterization of the hydrological functioning of the
Niger basin
V. Pedinotti et al.
Title Page
Abstract Introduction
Conclusions References
Tables Figures
◭ ◮
◭ ◮
Back Close
Full Screen / Esc
Printer-friendly Version
Interactive Discussion
Discussion
P
a
per
|
Dis
cussion
P
a
per
|
Discussion
P
a
per
|
Discussio
n
P
a
per
|
2.2 TRIP specific parameters
The baseline parameter values are presented in this section: the sensitivity of the model to these parameters will be investigated in a subsequent section. For the model evaluation, the time delay parameters for the groundwater and deep aquifer reservoirs are fixed to 30 days and 4 years, respectively. The aquifer parameterαis initially fixed 5
at 3/4 (which implies that 1/4 of the drainage flows into the deep aquifer).
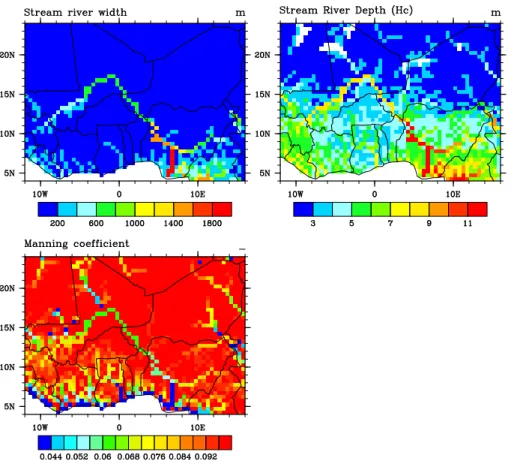
The river width is an important parameter because it modulates both the river flow and the floodplain dynamics. It is computed over the entire TRIP network via an em-pirical mathematical formulation that describes a simple geomorphologic relationship between W and the mean annual discharge at each river cross section (Knighton, 1998; 10
Arora and Boer, 1999; Moody and Troutman, 2002; Decharme et al., 2011):
W = max 30, β × Q0yr,5
(3)
whereQyr0,5(m3s−1) is the annual mean discharge in each grid cell estimated using the global runoffdatabase from Cogley (1998). As discussed in Decharme et al. (2011), theβcoefficient can vary drastically from one basin to another (Knighton, 1998; Arora 15
and Boer, 1999; Moody and Troutman, 2002). Decharme et al. (2011) proposed that
βvaries according to climatic zone and fixedβto 20 for monsoon basins and to 13 for semi-arid and arid basins. As the Niger river flows through both such climate zones, two different values are used within the Niger basin: βis 20 for the branch of the river going from the river mouth (5◦N) to 12◦N andβis fixed to 10 for the remaining branch 20
of the river. The spatial distribution of the river width is shown in Fig. 3a.
The key parameter for the floodplain parameterization ishc, the critical river bankfull height (Decharme et al., 2008, 2011). In this study, as proposed by Decharme et al. (2011), it is computed according to the river width via a simple power function:
hc = W 1/3
(5) The spatial distribution ofhc is shown in Fig. 3b. However, owing to 25
HESSD
8, 9173–9227, 2011Characterization of the hydrological functioning of the
Niger basin
V. Pedinotti et al.
Title Page
Abstract Introduction
Conclusions References
Tables Figures
◭ ◮
◭ ◮
Back Close
Full Screen / Esc
Printer-friendly Version
Interactive Discussion
Discussion
P
a
per
|
Dis
cussion
P
a
per
|
Discussion
P
a
per
|
Discussio
n
P
a
per
|
tests will be carried out using arbitraryhc±20 % (Decharme et al., 2008) leading to an increase or decrease in bankfull height up to 2m.
Finally, as discussed and proposed by Decharme et al. (2010), the Manning friction factornrivvaried linearly and proportionally toW from 0.04 near the river mouth to 0.1 in the upstream grid cells (Fig. 3c): nriv = nmin + (nmax − nmin)
W
mouth−W
Wmouth−Wmin
(6) where 5
nriv represents the Manningnfactor of the grid cell, nmax and nmin the maximum and the minimum values of the Manning friction factor (respectively equal to 0.1 and 0.04),
Wmin (m) the minimum river width value andWmouth (m) the width of the mouth in each basin of the TRIP network.
3 Model setup and experimental design
10
3.1 Methodology
In order to determine the impact of the flooding scheme on simulated discharges, the TRIP routing model is used in offline mode, uncoupled from a LSM and without flood-plains. ALMIP I, which is a part of the AMMA project, was motivated by an inter-est in fundamental scientific issues and by the societal need for improved prediction 15
of the West African Monsoon (WAM) and its impacts on West African nations (Re-delsperger et al., 2006). As part of this project, ALMIP I focused at better under-standing land-atmosphere and hydrological processes over western Africa (Boone et al., 2009). LSMs were run offline with prescribed atmospheric forcing consisting in a combination of observations, satellite products and atmospheric model output data. All 20
of the LSMs used the same computational grid at a 0.50◦ spatial resolution (see the domain on Fig. 2). The advantage of using ALMIP data is that each LSM can simulate a different runoff response, therefore we use an ensemble of inputs. In the current study, 11 simulations are used over the 2002–2006 period. TRIP is used to compute daily outputs of discharges along the river and water mass storage for each activated 25
HESSD
8, 9173–9227, 2011Characterization of the hydrological functioning of the
Niger basin
V. Pedinotti et al.
Title Page
Abstract Introduction
Conclusions References
Tables Figures
◭ ◮
◭ ◮
Back Close
Full Screen / Esc
Printer-friendly Version
Interactive Discussion
Discussion
P
a
per
|
Dis
cussion
P
a
per
|
Discussion
P
a
per
|
Discussio
n
P
a
per
|
In addition, the ISBA-TRIP CHS coupled model is used with and without the flooding scheme to quantify the impact of the scheme on the discharge and the surface energy budget. In the second part of this study, the deep aquifer reservoir is implemented into the ISBA-TRIP CHS model and deep drainage water is then distributed between deep soil layers and this aquifer reservoir (see details in Sect. 2). Comparison with both in-5
situ and remote sensing data will allow us to evaluate the simulated surface processes and the impact of the inclusion of floodplains, and to obtain an estimate of the aquifer annual recharge and river discharge.
3.2 Atmospheric forcing dataset to run ISBA-TRIP
The atmospheric state variables are based on the European Centre for Medium Range 10
Forecasts (ECMWF) ECMWF numerical weather prediction (NWP) model forecasts for the years 2002–2007. The forcing variables consist in the air temperature, specific humidity, wind components at 10 m, and the surface pressure, all at a 3 h time step. Because of the importance of having accurate incoming radiation fluxes and precipi-tation, and because of the potentially significant errors in these variables derived from 15
NWP models over this region (e.g. see Boone et al., 2009), merged satellite products are used. The downwelling longwave and shortwave radiative fluxes are provided by the LAND-SAF project (Geiger et al., 2008). Two products are used for rainfall forcing. The TRMM 3B42 product (Huffman et al., 2007) is used by default.
However, several studies have shown that RFE2 produces rainfall over the Sahel 20
agrees better with observed values than the other available rainfall products (Pierre et al., 2011), but it is at a time step which is not well adapted to land surface modeling (daily time step). Therefore, a second set of rainfall forcing data was created using the RFE2 (Laws et al., 2004) daily rainfall product: the original rainfall is renormalized such that it produces nearly the same monthly averages as RFE2, but the temporal dis-25
HESSD
8, 9173–9227, 2011Characterization of the hydrological functioning of the
Niger basin
V. Pedinotti et al.
Title Page
Abstract Introduction
Conclusions References
Tables Figures
◭ ◮
◭ ◮
Back Close
Full Screen / Esc
Printer-friendly Version
Interactive Discussion
Discussion
P
a
per
|
Dis
cussion
P
a
per
|
Discussion
P
a
per
|
Discussio
n
P
a
per
|
RFEH rainfall, the TRMM dataset will be used to run ISBA-TRIP, only for the compar-ison with ALMIP models discharge (to be coherent with the ALMIP project methodol-ogy). However, all the following studies and evaluations will be done using the RFEH dataset as rainfall forcing.
3.3 Evaluation datasets
5
Over the evaluation period (2002–2006), the simulated discharges are compared with daily gauge measurements along the Niger river from the Niger Basin Authority (ABN) as part of their Niger-HYCOS Project. These data are available in Kandadji, Ansongo and Niamey. Monthly discharge data from the Global Runoff Data Center (GRDC; http://www.grdc.sr.unh.edu/index.html) are also available in Lokoja and Malanville (see 10
Fig. 2).
Satellite-derived inundation estimates are used to evaluate the spatial distribution and the time evolution of the flooded areas. Two different products are used. The first product is based on data from the MODIS multispectral imaging system installed onboard the Terra and Aqua satellites. In this study, the surface reflectance product 15
(MOD09GHK) is used which is defined as the reflectance that would be measured at the land surface if there were no atmosphere. The spatial resolution is 500 m for the corresponding MODIS images. In order to detect open water and aquatic vege-tation in arid and semi arid regions, a classification is performed using the fact that water surfaces do not reflect in the visible and near infra-red part of the spectrum. A 20
threshold value has been estimated for reflectance in the MODIS frequency band-5 1230–1250 nm and for the NDVI index (Table 1) in order to delineate the shallow, sedi-ment laden, and open water over the Inner Niger Delta, and also in order to distinguish between aquatic vegetation and that on dry land. It has been assumed that small val-ues of surface reflectance in band-5 characterize open water, independent of the NDVI 25
HESSD
8, 9173–9227, 2011Characterization of the hydrological functioning of the
Niger basin
V. Pedinotti et al.
Title Page
Abstract Introduction
Conclusions References
Tables Figures
◭ ◮
◭ ◮
Back Close
Full Screen / Esc
Printer-friendly Version
Interactive Discussion
Discussion
P
a
per
|
Dis
cussion
P
a
per
|
Discussion
P
a
per
|
Discussio
n
P
a
per
|
the NDVI is small and surface reflectance in band-5 is large. NDVI has been shown to be a robust index for monitoring temporal changes of the vegetation photosynthetic activity (Lyon et al., 1998; Lunetta et al., 2006). In the arid environment, a high level of vegetation photosynthetic activity can only be sustained by the presence of surface wa-ter or groundwawa-ter discharge. If dense enough, the aquatic vegetation and hydrophilic 5
plants can mask underlying water and should be included in the estimate of the total area of the floodwaters. The NDVI ranges from negative values (open water) to>0.5 for dense vegetation.
The second product consists in global estimates of the monthly distribution of sur-face water extent at about 25 km sampling intervals. These data were generated from 10
complementary multiple satellite observations, including passive (Special Sensor Mi-crowave Imager) and active (ERS scatterometer) miMi-crowaves along with visible and near infrared imagery (advanced very high resolution radiometer; AVHRR). These es-timates were first developed over 1993–2000 (Prigent et al., 2007), adjusted and ex-tended over 1993–2004 (Papa et al., 2010b) and recently recomputed for the entire pe-15
riod 1993–2007. This dataset has been extensively evaluated at the global scale (Papa et al., 2010) and at river basin scale, including the Niger River (Papa et al., 2008). In the present study, this dataset is aggregated to a 0.5◦ resolution and referred to as PP. Because PP does not make distinction between the diverse anthropogenic and/or natural water bodies while the ISBA-TRIP output must be compared only with flooded 20
areas, two additional datasets are used to hybridize PP in order to conserve infor-mation on flood inter-annual variability only: the Global Lakes and Wetland Database (GLWD; Lehner and D ¨oll, 2004) and the Monthly Irrigated and Rainfed Crop Areas (MIRCA2000; Portmann et al., 2010) database. The corresponding final product is named CPP in this study. The methodology is described in detail by Decharme et 25
al. (2011), and so it is not detailed here.
HESSD
8, 9173–9227, 2011Characterization of the hydrological functioning of the
Niger basin
V. Pedinotti et al.
Title Page
Abstract Introduction
Conclusions References
Tables Figures
◭ ◮
◭ ◮
Back Close
Full Screen / Esc
Printer-friendly Version
Interactive Discussion
Discussion
P
a
per
|
Dis
cussion
P
a
per
|
Discussion
P
a
per
|
Discussio
n
P
a
per
|
Seven sites were chosen for the evaluation, one upstream of the Niger inner delta, four downstream of the delta and two in the delta. The data are available at a regular 35 days time step (with occasional missing data) from November 2002 to the end of 2006 (Calmant et al., 2008).
Total Water Storage (TWS) variations over the entire basin are evaluated using data 5
from the Gravity Recovery and Climate Experiment (GRACE; Tapley et al., 2004). GRACE provides monthly TWS variation estimates based on highly accurate maps of the earth’s gravity field at monthly intervals at a resolution of approximately 300– 400-km (Wahr et al., 2004; Swenson et al., 2003). The instrumentation and onboard instrument processing units are described in detail in Haines et al. (2003). Here, we 10
used 48 months (from January 2003 to December 2006, excluding June 2003 and Jan-uary 2004 because products are not available) of the Release 04 data produced by the Center for Space Research (CSR at The University of Texas at Austin), the Release 4.1 data produced by the Jet Propulsion Laboratory (JPL), and the GeoForschungsZen-trum (GFZ) Release 04 (more details concerning GRACE data are available online at 15
http://grace.jpl.nasa.gov/data/). The combination of these data with those datasets de-scribed in the previous paragraphs above will allow us to evaluate the distribution of water in the different TRIP reservoirs and to have a first estimation/validation of the aquifer water storage variations.
4 Results
20
4.1 Improvement of simulated discharges due to river flood
The evaluation of the simulated river discharge is important for hydrological applica-tions as well as for climate studies. Previous studies (Coe et al., 2008; Decharme et al., 2008, 2011; Dadson et al., 2010) have shown that the inclusion of a flooding scheme can impact the hydrological cycle by increasing the average evaporation and reducing 25
HESSD
8, 9173–9227, 2011Characterization of the hydrological functioning of the
Niger basin
V. Pedinotti et al.
Title Page
Abstract Introduction
Conclusions References
Tables Figures
◭ ◮
◭ ◮
Back Close
Full Screen / Esc
Printer-friendly Version
Interactive Discussion
Discussion
P
a
per
|
Dis
cussion
P
a
per
|
Discussion
P
a
per
|
Discussio
n
P
a
per
|
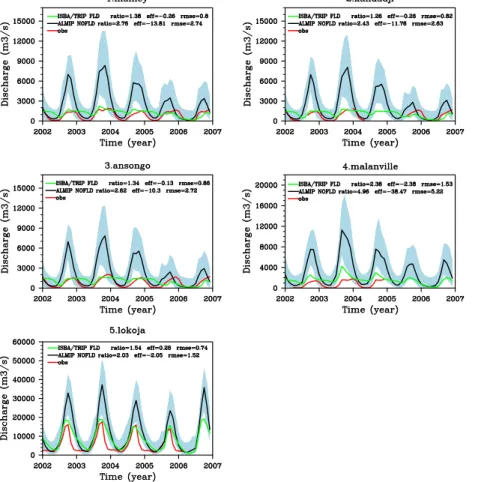
an increasing number of LSMs used for large scale hydrological or GCM applications use river routing, most of these models do not represent floodplains. Flooded zones can be significant sources of evaporation and have a role of surface water keepers, and their exclusion can result in an overestimation of the discharge for basins with sig-nificant annual flooding. To generalize this result, the TRIP RRM model was used in 5
offline mode and without the flooding scheme (or aquifers), to convert simulated runoff
and drainage from 11 LSMs into discharge. The LSMs considered for this study were part of the ALMIP I project (Boone et al., 2009). The Fig. 4 shows the mean monthly discharges simulated by the ALMIP models (black line) for several locations along the river. The blue range is the difference between the minimum and the maximum value of 10
discharges simulated by the models and the red line is the observed discharge. All of the ALMIP land surface models clearly overestimate the discharge. In Malanville, the mean simulated discharge is around 5 times higher than that observed over this period. At the other sites (Niamey, Kandadji, Ansongo, and Lokoja), the mean simulated dis-charge is 2 to 2.8 times higher than observed. However, the variability of the disdis-charge 15
is well captured by the models with a correlation going from 0.59 (Kandadji) to 0.85 (Lokoja) over the period. The green line represents the discharge simulated by the ISBA-TRIP CHS model with the flooding scheme activated. The discharge decreases considerably with a reduction of 50 % in Niamey, Kandadji, Ansongo and Malanville and 26 % in Lokoja. Indeed, part of the water in the floodplains evaporates, while part 20
infiltrates into the flooded soil thereby reducing the stream reservoir water storage and discharge. The Nash-Sutcliffe coefficient or efficiency (eff) is also improved.
Figure 5 shows the monthly discharge simulated by ISBA-TRIP when forced by the RFEH rainfall dataset with and without using the flooding scheme. Indeed, as said in the methodology section, the RFEH rainfall dataset generally giving better simulated 25
HESSD
8, 9173–9227, 2011Characterization of the hydrological functioning of the
Niger basin
V. Pedinotti et al.
Title Page
Abstract Introduction
Conclusions References
Tables Figures
◭ ◮
◭ ◮
Back Close
Full Screen / Esc
Printer-friendly Version
Interactive Discussion
Discussion
P
a
per
|
Dis
cussion
P
a
per
|
Discussion
P
a
per
|
Discussio
n
P
a
per
|
using this forcing dataset. However, the model still has a difficulty simulating the dis-charge behavior during the low flow season. In fact, the disdis-charge remains relatively high during the dry season compared to the observations which implies that there is too much water in the river. Several reasons for this can be identified, such as under-estimated evaporation, an underestimation of the water in flooded areas or the neglect 5
of aquifers. Anthropologic activities (dams, agriculture and water use for domestic con-sumption) are not precisely quantified and can also explain the bias between observed and simulated discharge especially during the dry season when the population might need to extract more water from the river due to the lack of rain. The next section will show the improvement of the low flow season modeling owing to the consideration of 10
deep aquifer storage. The impact of the flooding scheme on the surface energy budget was also investigated where the total evaporation includes evaporation from the soil and flooded areas and transpiration. The flooding scheme contributes to an increase in the evaporation mainly over the inland delta and in the southern part of the basin (+280 % with TRMM rainfall and +200 % with RFEH) which are areas which generally 15
experience significant floods (see Sect. 5.2.b). These results emphasize the impor-tance of modeling flood-feedbacks over regions with seasonal flooding such as the Niger delta region.
4.2 Impact of a deep aquifer reservoir and estimate of aquifer recharge
As already said, a fourth reservoir was added to the ISBA-TRIP model to represent 20
deep aquifer processes (Sect. 2). Indeed, the model simulates too much water in the river that could be due to the presence of large aquifers (Fontes et al., 1991; Decharme et al., 2011). Different values of the aquifer recharge factor (1-α) were tested and only the most relevant result is kept for the evaluation (see sensitivity tests in Sect. 6 for further details).
25
HESSD
8, 9173–9227, 2011Characterization of the hydrological functioning of the
Niger basin
V. Pedinotti et al.
Title Page
Abstract Introduction
Conclusions References
Tables Figures
◭ ◮
◭ ◮
Back Close
Full Screen / Esc
Printer-friendly Version
Interactive Discussion
Discussion
P
a
per
|
Dis
cussion
P
a
per
|
Discussion
P
a
per
|
Discussio
n
P
a
per
|
by the fact that the river empties faster after the rainy season which results to a more realistic discharge during the dry season. In terms of statistics, the scores (ratio, rmse, eff) are similar or slightly deteriorated except in Malanville and Lokoja where they are improved (relative bias is 0.31 without aquifers and reduced to 0.04 with aquifers). The correlation score, however, is improved at all of the sites. In addition to improving the 5
recession law, the aquifer contributes to a decrease in surface evaporation by 6 to 16 % for the main flooded regions (Fig. 7) since there is less water at the surface available for evaporation. The sensitivity of the model to the choice of the time delay factorτAq and the fractionαwill be presented in Sect. 5.
Vouillamoz et al. (2007) used magnetic resonance sounding to give recharge es-10
timate in semiarid Niger in order to better constraint hydrogeological models. If this method presents some uncertainties, they showed that it remains useful for character-izing the unconfined aquifer of south-western Niger. In this study, the aquifer recharge rate (recent rate due to vegetation clearance) is estimated to be 23 mm 5 mm per year. The ISBA-TRIP CHS gives a mean aquifer recharge rate of 26 mm per year 15
over the period of simulation 2002–2006 which is coherent with the study of Vouil-lamoz et al. (2007). Even if the estimate from VouilVouil-lamoz et al. (2007) was done over a much smaller area than in this study, this result emphasizes the ability of the model to distribute the water between the different hydrological components. This result shows the need for representing aquifer processes in the model to get a more realistic water 20
distribution in the basin.
4.3 Flooded areas
The quantification of wetland extent is an important step towards a better represen-tation of surface water dynamics. In this study, the time and spatial distribution of wetlands were evaluated over the inner delta region, which is a large inundated area, 25
HESSD
8, 9173–9227, 2011Characterization of the hydrological functioning of the
Niger basin
V. Pedinotti et al.
Title Page
Abstract Introduction
Conclusions References
Tables Figures
◭ ◮
◭ ◮
Back Close
Full Screen / Esc
Printer-friendly Version
Interactive Discussion
Discussion
P
a
per
|
Dis
cussion
P
a
per
|
Discussion
P
a
per
|
Discussio
n
P
a
per
|
and the maximum Modis derived (JFC) flooded fraction. The simulated flooded frac-tion is generally included in this range although it tends to be on the low end. This is reasonable since the Modis classification (JFC) fraction includes wetted vegetation an near-surface saturated soils. However, as shown in the figures, the CPP product is around 3 times higher than the modeled values over the basin and 10 times higher 5
over the delta. This can be explained by the fact that the multi-satellite method can encounter some difficulties in accurately discriminating between very moist soils and standing open water and likely overestimates the actual fraction of inundations (Papa et al., 2010a,b).
Figure 8c and 8d show the time series of de-seasonalized anomalies (obtained by 10
subtracting the 12-year mean monthly value from individual months and then divided by the standard deviation) over the delta and over the basin. Over the delta, the Fig. 8c suggests that the model and the data are in good agreement in their time variations, with a better phasing between CPP and ISBA/TRIP. Over the basin, the CPP and model anomalies globally corroborate in phase and amplitude.
15
The spatial distribution of the inundated areas, as well as their seasonal variability, are well represented by the model. Indeed, for both of the CPP products and the simulation, the most important inundations occur between August and October and over two main regions, i.e. the inner delta in Mali and in the eastern part of the basin at the border between Niger and Nigeria.
20
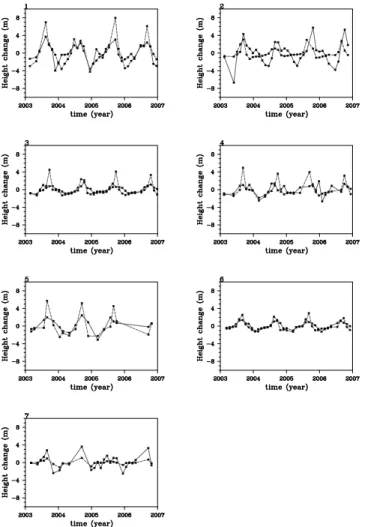
4.4 River height change
To complete the evaluation of surface water dynamics, the river height time changes are compared to estimates from the HYDROWEB hydrological database developed by the LEGOS/GOHS (Calmant et al., 2008) which gives estimations of height changes at several points along the Niger river (Fig. 9). The seven locations used for comparison 25
HESSD
8, 9173–9227, 2011Characterization of the hydrological functioning of the
Niger basin
V. Pedinotti et al.
Title Page
Abstract Introduction
Conclusions References
Tables Figures
◭ ◮
◭ ◮
Back Close
Full Screen / Esc
Printer-friendly Version
Interactive Discussion
Discussion
P
a
per
|
Dis
cussion
P
a
per
|
Discussion
P
a
per
|
Discussio
n
P
a
per
|
this error is considered as reasonable for evaluating water height changes. Globally, the water height changes are well represented by the model, with a slight phase delay for location 2. The model also overestimates the peaks of positive height changes which might be due to forcing anomalies (rain) or to model deficiencies. Indeed, the surface runoffstream function might be false in some areas and, if overestimated, results in an 5
overestimation of water height variation during rain events. Also, uncertainties in the river bed slope can also result in an overestimation of the water height changes in the valleys. However, no attempt is made to calibrate these parameters here, which would be a long and difficult process and which is not necessary for use in a GCM.
4.5 Total terrestrial water storage
10
Figure 10 shows the comparison between 3 GRACE satellite products that estimate the total water storage (TWS) change globally at 1◦ resolution (the blue range in the lower panels represents the difference between the maximum and minimum monthly obser-vation values) and the water storage change in all of the reservoirs of the ISBA-TRIP model, averaged over the basin. The left panels represent the inter-annual variations 15
(monthly means) and the right panels are the intra-annual variations (2003–2006 aver-age for each month). The blue curve on the lower panels represents the mean water storage change of the Niger basin in all of the ISBA-TRIP reservoirs. The upper pan-els contain the water storage change in each reservoir (averaged over the basin) and the middle panels present the time evolution of the rain, drainage, runoffand evapo-20
ration over the basin. The comparison of ISBA-TRIP water storage change with the GRACE products over the Niger basin shows a good correlation between the simula-tion and observasimula-tions. The contribusimula-tions of each reservoir to the total water storage change appear in the legend. Although the uppermost soil layers (approximately 1 to a few meters) comprise most of the total water storage change over the basin (56 %), 25
HESSD
8, 9173–9227, 2011Characterization of the hydrological functioning of the
Niger basin
V. Pedinotti et al.
Title Page
Abstract Introduction
Conclusions References
Tables Figures
◭ ◮
◭ ◮
Back Close
Full Screen / Esc
Printer-friendly Version
Interactive Discussion
Discussion
P
a
per
|
Dis
cussion
P
a
per
|
Discussion
P
a
per
|
Discussio
n
P
a
per
|
results emphasize the need for considering all such reservoirs in LSMs in order to close the water budget. Generally, studies compare the GRACE water storage change to the water storage change in the hydrologic soil layers only i.e. the first soil meters (green curve in the last panel). However, this approximation is likely less valid for regions with significant storage in flooded zones and deeper soil layers since the contribution of 5
these two reservoirs to the total water storage is no more negligible.
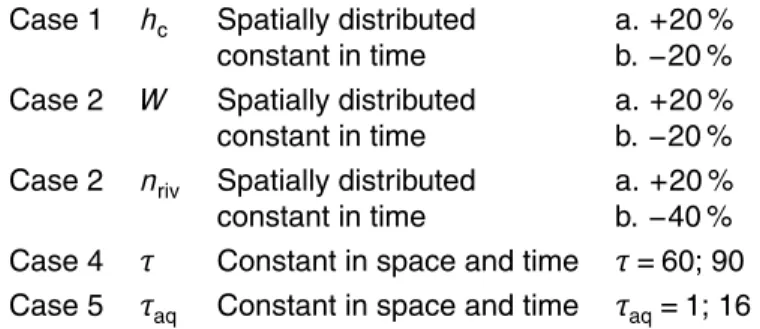
4.6 Sensitivity tests
Sensitivity tests were performed to determine the input parameters which have the most significant impact on the simulations. For global simulations, it is preferable that the model is not sensitive to too many parameters since tuning is a long and fastidious 10
process at the global scale and spatially distributed global scale observational data is currently rather limited. Generally, physiographic relationships or the derivation of secondary parameters are preferred. The sensitivity of the ISBA-TRIP model to several key input parameters was investigated in this study. The Table 1 presents the key input parameters and the variations applied.
15
We first investigate the impact of the river critical height, hc, on the simulated dis-charge. The river widthW is kept the same as in previous simulations. Increasing the critical height by 20 % leads to 5 % less flooded fraction over the inner delta and in the south of the basin. The evaporation also decreases over the flooded zones by 4 to 12 % (relative bias). Conversely, when decreasing the river height by 20 %, the flooded 20
fraction is 5 % more over the same areas and the evaporation is increased by 14 to 24 %.The water height changes are also influenced by the critical height modification. Over the 7 virtual sites, an increase ofhc globally increases the water height changes (+30 %), while a decrease ofhcdecreases the water height changes (−16 %). This can be explained by the fact that a river with a smallhcwill be flooded earlier and the water 25
will spread more rapidly over the surrounding area, making the river water level less sensitive to rain events. In terms of inter-annual discharge, increasing or decreasing
HESSD
8, 9173–9227, 2011Characterization of the hydrological functioning of the
Niger basin
V. Pedinotti et al.
Title Page
Abstract Introduction
Conclusions References
Tables Figures
◭ ◮
◭ ◮
Back Close
Full Screen / Esc
Printer-friendly Version
Interactive Discussion
Discussion
P
a
per
|
Dis
cussion
P
a
per
|
Discussion
P
a
per
|
Discussio
n
P
a
per
|
(Fig. 11a and b). However, the annual variability of the discharge is not changed by a modification of the critical height. In Niamey, Ansongo and Kandadji, the increase of
hc leads to better statistical scores which might suggest that the model overestimates the inundations in these areas. In contrast, in Malanville, the scores are better when reducing the critical height which suggests an underestimation of flooding at this site. 5
In Lokoja however, the scores are better for the standard simulation. The impact of the river width,W, was also investigated. The critical height is not changed. IncreasingW
increases the amplitude of the discharge by around 6 % while decreasing arbitraryW
by 20 % decreases the discharge by 9 % (Fig. 11c and d). The water height changes vary differently according to the site. For example, for location 1 (see Fig. 2 for loca-10
tions) a 20 % reduction of the river width reduces the mean water height changes by 35 % over the studied period. However, for locations 2, 4, 5, 6 and 7 the mean water height changes increase by 15 % to 28 % and there is no change for location 3. Indeed, water height changes depend on the topography which is modified with river width vari-ations. Evaporation over the flooded areas is reduced by 3 to 9 % whenW increases 15
and increased by 4 to 16,% when W decreases. There are no significant impacts of
W andhcon the total water storage change. Indeed, the storage of the different reser-voirs and the amount of drainage are only slightly changed by the modification of these parameters.
The mean value of the Manning coefficient is around 0.075 and the frequency distri-20
bution of the Manning coefficient shows that most of the pixels have values above 0.06 (91 out of 110). As the Niger basin covers a large area, the soil properties are very heterogeneous all over the basin, making it necessary to use spatial distributions of soil parameters. Two new distributions ofnrivwere created and used to run the model: one distribution in whichnrivcoefficient is arbitrary reduced by 40 % and the other one 25
HESSD
8, 9173–9227, 2011Characterization of the hydrological functioning of the
Niger basin
V. Pedinotti et al.
Title Page
Abstract Introduction
Conclusions References
Tables Figures
◭ ◮
◭ ◮
Back Close
Full Screen / Esc
Printer-friendly Version
Interactive Discussion
Discussion
P
a
per
|
Dis
cussion
P
a
per
|
Discussion
P
a
per
|
Discussio
n
P
a
per
|
the river to rain events. Indeed, small values of the coefficient speed the rise in water level and increase discharge amplitude. Also, the decrease of the discharge after the rainy season is faster whennriv is smaller. We can also notice that when nriv is big-ger, the model is better able to dissociate the different rain events and two peaks of discharge appear. Flooded areas and evaporation are higher for large values ofnrivas 5
the water flows more slowly in the river bed, generating smaller river height changes, and flooded areas empty to the river more slowly. The evaporation increases by 14 % over main evaporation areas whennriv is 20 % higher and decreases by 18 % when it is 40 % smaller. Flooded areas are 15 % higher over the inner delta area when the Manning coefficient increases and 30 % smaller when it decreases. The increase of 10
nrivalso delays the water height changes while small values ofnrivdecrease the peaks of river height changes. However, the impact of this coefficient on the water height change is more or less significant according to the observation sites and for most of them this impact is not obvious. Finally, these modifications ofnriv have no significant impact on the total water storage change. Thus, the current distribution used in the 15
model is the most reasonable according to the scores.
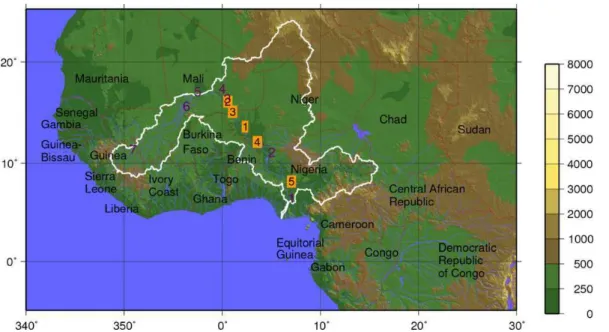
5 Endorheism of the northern Niger basin
The monitoring of the Niger basin started in 1907 when two observation stations were built in Koulikoro, Mali and in Jebba, Nigeria. The current observation network contains about 200 stations and has improved the general knowledge of the hydrological func-20
tioning of the basin. The 2005 annual report of the World Bank Group underscored the endorheic property of the northern part of the Niger basin, where surface runoffand stream flow do not reach the river (Andersen et al., 2005). This endorheic area covers almost half of the area of the Niger basin (Fig. 13a, from Descroix et al., 2009). Fig-ure 13b represents the ratio of the sum of the runoffand drainage calculated by ISBA, 25
HESSD
8, 9173–9227, 2011Characterization of the hydrological functioning of the
Niger basin
V. Pedinotti et al.
Title Page
Abstract Introduction
Conclusions References
Tables Figures
◭ ◮
◭ ◮
Back Close
Full Screen / Esc
Printer-friendly Version
Interactive Discussion
Discussion
P
a
per
|
Dis
cussion
P
a
per
|
Discussion
P
a
per
|
Discussio
n
P
a
per
|
there is almost no runoffor drainage in this area and thus no water flowing to the river simulated by the model. Moreover, the dark blue pattern on Fig. 13b (corresponding to a ratio inferior to 0.1) is close to the pattern of the endorheic region from Descroix et al. The ratio of evaporation over precipitation is superior to 0.9 (Fig. 13c) in this region which means that most of the water from precipitation evaporates. The land surface 5
model is then able to qualitatively reproduce the endorheic behaviour of the northern Niger basin without modification of the scheme or the input parameters.
6 Discussion
The results suggest that the coupled land surface and river routing model provides a reasonable estimation of inland hydrological processes of the Niger basin when the 10
flood scheme is activated and a deep aquifer is considered. The flooding scheme contributes to decrease streamflow and increase evaporation over flooded areas. The impacts of floods on the water fluxes and storage terms are found to be coherent with other studies (Coe et al., 2008; Decharme et al., 2008, 2011; Dadson et al., 2010) and emphasize the need for representing these processes in GCMs.
15
Several diverse datasets have been used for model evaluation such as river dis-charge, spatial and temporal evolution of flooded areas and water height changes measured by satellite (see Sect. 5). These data provide constraints for estimating the sub-surface water storage and dynamics, but also the shallow soil water content and the groundwater storage which are linearly related to the surface water. With three 20
reservoirs out of four being constrained by measurement data, the GRACE total water storage dataset permits a preliminary estimation of the water storage change in the aquifer reservoir. Moreover, the aquifer reservoir recharge rate has been later found to be coherent with the estimate from Vouillamoz et al. (2007) which is a valuable result for the validation of the water cycle simulation. This is of interest since there are hardly 25
HESSD
8, 9173–9227, 2011Characterization of the hydrological functioning of the
Niger basin
V. Pedinotti et al.
Title Page
Abstract Introduction
Conclusions References
Tables Figures
◭ ◮
◭ ◮
Back Close
Full Screen / Esc
Printer-friendly Version
Interactive Discussion
Discussion
P
a
per
|
Dis
cussion
P
a
per
|
Discussion
P
a
per
|
Discussio
n
P
a
per
|
its contribution to the total water budget is not negligible and thus, the consideration of aquifer processes is necessary to better distribute water between the water cycle components.
Evapotranspiration is the remaining water budget component, but large scale ob-servations are not available. The evaluation of this variable has been done within the 5
context of several other studies. The ISBA surface temperature was evaluated using brightness temperatures from AMSR (deRosnay et al., 2009) which is related to the surface energy budget and near surface soil moisture, and the monthly sensible heat fluxes aggregated from local scale observations to the ALMIP grid square were eval-uated for a semi-arid region within the Niger basin (net radiation was imposed, thus 10
monthly Bowen ratios can be estimated; Boone et al., 2009). Finally, regional scale water budget studies were performed over West Africa using ISBA evaporation esti-mates (Meynadier et al., 2010): all of the aforementioned studies imply that monthly scale evaporation estimates are reasonable.
Moreover, Mahe et al. (2009), estimated the water losses of the inner delta of the 15
Niger river and their evolution from 1924 to 1996. They estimated the total evapotran-spiration from the delta to be about 800 mm yr−1 over the period 1924–1996, varying between 400 mm yr−1 (1984) and 1300 mm yr−1 (1924). The total evapotranspiration calculated by ISBA over the period 2002–2006 is 662 mm yr−1 which is contained in the range estimated by the previous study. They also related the water losses in the 20
delta to the expansion of the floodplains, highlighting the importance of considering floods in a LSM.
Sensitivity tests have shown that a good routing model is required to optimize the simulation errors. For example, Fig. 11 shows that while increasinghcin the delta re-gion (Niamey, Kandadji, Ansongo) would improve the simulation score, it would have 25
HESSD
8, 9173–9227, 2011Characterization of the hydrological functioning of the
Niger basin
V. Pedinotti et al.
Title Page
Abstract Introduction
Conclusions References
Tables Figures
◭ ◮
◭ ◮
Back Close
Full Screen / Esc
Printer-friendly Version
Interactive Discussion
Discussion
P
a
per
|
Dis
cussion
P
a
per
|
Discussion
P
a
per
|
Discussio
n
P
a
per
|
relations used currently to describe these parameters, or they will either be assimilated into the model to correct simulation errors.
In GCMs, the input parameters, such as the Manning coefficient, critical height, river width and depth are defined by empirical relationships which might not give the best results for all modeled basins, however the objective is to give the best overall global 5
results. However, for regional or basin scale studies, these relationships lead to non-negligible known errors which could be reduced using satellite data. Indeed, satellite data could be used to spatially distribute parameters by basin and then could contribute to the development of a global database describing the major river characteristics, at least as the stream width and the river bankfull height. This is an important step if GCM 10
climate scenario output is to be used for water resource management at the regional scale.
We also investigated the impact of increasing the groundwater reservoir’s time delay factor on discharge, which extends the time of exchange between the groundwater reservoir and the river. Decharme et al. (2010) estimated that a time delay factor of 15
the order of 30–60 days is generally suitable for global simulations. The increase of
τimpacts the discharge on the descending phase by deteriorating the recession law. The scores are not significantly changed by the increase ofτ. The total water storage is not highly dependant onτeither (the mean variation represents about 5 % of the mean water storage change). However, previous results emphasized that this parameter is 20
important since it increases the residence time of water storage in the basin and allows a more realistic simulation of the discharge.
The aquifer reservoir time delay factor has also no impact on the discharge as aquifers are assumed to be too deep and too slow to impact directly the river dis-charge. Modifications of τAq have a negligible impact on the total water storage of 25
HESSD
8, 9173–9227, 2011Characterization of the hydrological functioning of the
Niger basin
V. Pedinotti et al.
Title Page
Abstract Introduction
Conclusions References
Tables Figures
◭ ◮
◭ ◮
Back Close
Full Screen / Esc
Printer-friendly Version
Interactive Discussion
Discussion
P
a
per
|
Dis
cussion
P
a
per
|
Discussion
P
a
per
|
Discussio
n
P
a
per
|
the ocean has a significant impact on the water budget, and thusτAqcould be one key parameter contributing to the water balance.
Input rainfall uncertainties can also be the cause of biases in the simulations as shown in Sect. 4.1 where the model, forced by two different rain datasets gives sig-nificantly different results. In this paper, only the TRMM-RFE2-hybrid rain dataset, 5
RFEH, resulting in better simulation results was used for the bulk of the valida-tion. However, other rain datasets were used as input rainfall to run the ISBA-TRIP model, such as PERSIANN (Precipitation Estimation from Remotely Sensed Informa-tion using Artificial Neural Networks, http://chrs.web.uci.edu/persiann/) from the Center for hydrometeorology and remote sensing (CHRS) and CMORPH (CPC MORPHing 10
technique, http://www.cpc.ncep.noaa.gov/products/janowiak/cmorph.shtml) from the United States National Oceanic and Atmospheric Administration (NOAA). The results of the simulations using both of these rainfall datasets showed a significant overes-timation of the discharge (about 5 times higher than with the RFEH forcing for both CMORPH and PERSIANN forcing and twice higher for the TRMM forcing) at all dis-15
charge observation sites even with the representation of floods and aquifers. This is consistent with the work of Pierre et al. (2011) who showed that CMORPH dataset clearly overestimates precipitations over the Sahel.
7 Conclusions and perspectives
This study describes the evaluation of the ISBA-TRIP Continental Hydrologic System 20
(CHS) over the Niger river basin, using a prognostic flooding scheme and a linear deep aquifer reservoir. The simulations are done at a 0.5◦by 0.5◦resolution over the 2002– 2006 period. The flood scheme accounts explicitly for the precipitation interception by the floodplains, the direct evaporation from the free water surface and the possi-ble re-infiltration into the soil. The deep aquifer reservoir has no feedback with the 25


![Fig. 7. Spatial distribution of the relative di ff erence ([AQ-NOAQ]/AQ) between the AQ (without aquifers) and the AQ (with aquifers) evaporations (%) averaged for each month over the period 2002–2006 when forced with RFE2.0.](https://thumb-eu.123doks.com/thumbv2/123dok_br/18176386.330551/49.918.102.618.67.524/spatial-distribution-relative-aquifers-aquifers-evaporations-averaged-forced.webp)