Vol-7, Special Issue-Number4-June, 2016, pp665-672 http://www.bipublication.com
Research Article
Standardization of revised scale- Children's Manifest Anxiety, in 15-18 year
old mathematic students of Karaj City
Asghar Torkian
M.A. Assessment and Measuring in Education (Psychometric), College of Education and Psychology,
Allama Tabatabai, Tehran, Iran
ABSTRACT
The aim of this study is to evaluate the psychometric properties of the scale of multidimensionality of anxiety students. The research is descriptive, using multi-stage cluster sampling method from among 443 high school students of Karaj city. The questionnaire has been used in relation to the test anxiety scale. The questionnaire was distributed among the students of mathematics, through random sampling, by age, and instruction guide to the test expressed in the written questionnaire and we wanted to express what they feel and they're thinking about themselves. Lie detector test of analysis of variance was used to compare the results of tests carried include school age, according to the total and subscales of anxiety and physiological tests. Construct validity was used to check the validity of the test. For this purpose, the correlation between test scores and test RCMAS Anxiety Inventory (STAI) was calculated on 64 students who were as representatives of society (boys and girls, at different ages in mathematics). Obtained correlation coefficient was equal to 0.27 which is located at a lower level compared to other tests. Among the factors that have affected the credibility (reliability) testing, we can mention the following factors.
Keywords: anxiety, polygraph test, analysis of variance, credit
1. INTRODUCTION
According to Human history shows that they are in the human response to stress and to a great extent, from birth and his emergence. Twentieth century is called as the century of anxiety. Because, humans are exposed to technology, fragmentation of social relations, unhealthy competition lack of safe environment, the rule of criteria, upbeat lack of personal future, lack of access to facilities reserved for prosperity, economic and social problems, unemployment discrimination, population growth, migration, environmental pollution and other various events. And they are worried about their present and future. This is causing anxiety to deal with accidents and their severity (Mashhad, 2012) Anxiety in small amounts is essential for life, but too much anxiety efficiency is reduced, and in some cases it is Mkhly of thinking and decision-making . Creates anxiety, changes in physiology, and chemistry in person, and its
anxiety, apprehension concerns him, and the general disruption of the normal regulation of the body. Anxiety intensity has different situations of time and space, and psychological development of the individual. It seems, started a major consideration when considering the social pressures and psychologists to the anxiety is the group, the result of social pressures on the individual is undeniable.
Psychologists have proven that stress can, alone, cause hormonal changes in the body deplorable. Namely, hormonal interactions in the body, increase blood pressure, increase in atherosclerosis and a host of physical problems and emotional dysregulation of normal (Taghavi, 2005)
Freud, the role of culture and excitement increased anxiety, important. Modern life is eventful day, every day more and more, more and more victims of anxiety and anxiety are prevalent, skirt stuck rich and poor, educated and illiterate, large and small, and this place and any other place (singular, 2011)
Reynolds (1994) defines a condition or state of anxiety is an emotional state, along with fear, fear and tension. It is an immediate and urgent response, that is, unstable and temporary nature. And possibly, the extent and severity vary with time, be a certain anxiety, a feeling of tension objectively, fear and unrest, excitement and activity of the autonomic nervous system. However, we emphasize that we, the anxiety state the obvious, and trait anxiety or hidden . Other authors have mentioned, the anxiety, the "anxiety exogenous" and "endogenous" and "anxiety to normal" and "abnormal anxiety", respectively (Taghavi, 2013). Goldberg (1984) writes, «Anxiety» is mainly impaired young people, usually, it starts in the middle of the third decade of life, and the patient is, on average, before going for treatment, five years Symptoms of anxiety. The prevalence of anxiety states is estimated to be in the normal 2 to 4.7 percent, in Britain and America. However, this figure is mentioned, 21 percent, in an assessment Ramingham area .There are differences of opinion about the source and nature of anxiety in psychoanalysis. For example Aotoranak makes the emergence of anxiety to the process of Birth Trauma.
Herry Stach Sullivan emphasizes on the early relationship of mother and child, and mother-to-child transmission of anxiety. Horney believes that the adoption of means to reduce excitement, and anxiety. The most important of which is to relieve tension and psychological thrillers and Alienation. Alienation is the result of efforts to achieve the ideal self, the person is forced to prove his ideal Infobox (Mashhadi, 2011). Today's generation is more preoccupied with events anxiety. Because, technology and modern life surrounds, this generation, and each are, according to their ability, among a host of obstacles, in the wake of a better tomorrow. The resulting stress on the family, the community
and the physical environment they create, in the person of a better tomorrow, anxiety. That is, this anxiety is the result of unknown events, that person may face in the future or face not being involved in any accidents causing anxiety (Reynolds, 1978). The accident has more to adolescence, which is one of the most critical periods of life, because, in addition to the problems mentioned above, the course is combined with the rapid developments of growth, and the person feels themselves in flux fast, and radical physical, psychological and social. On the other hand, this period is a critical time in learning, creation and creativity. It is incumbent upon educators and counselors, that they recognize the problems of people who have these problems (anxiety) and use a tool that can be separated, anxious students, from students Normal. Hence, the importance of which is clear and obvious. Therefore, the test used in this study, test anxiety and children's point of view is new, it has used for ages 19.6 years. The research finding will be the norm, for ages 18-15 years.
2. The survey questions
1. does the reliability; test Tjdydh Children's Manifest Anxiety opinion, the mathematics student's city Karaj?
2. Do not valid, Tjdydh opinion Children's Manifest Anxiety test, the student's mathematics city Karaj? What is the correlation between the performances of the test subject's anxiety, Spielberger test?
3. Is there a difference between the performance of girls and boys, test anxiety in children? 4. Is there a difference between the performance of students of different ages 15-6 and 17 and 18?
3. METHODS
The aim of this study is essential, and how to collect data that is descriptive (non-experimental) and solidarity, and it is for the analysis of structural equation modeling. In this research, we use library studies, and a questionnaire to collect data.
1.3 community sample
Sample: The sample group are, including 443 male and female high school students in maths, city Karaj, that they had attended in the years
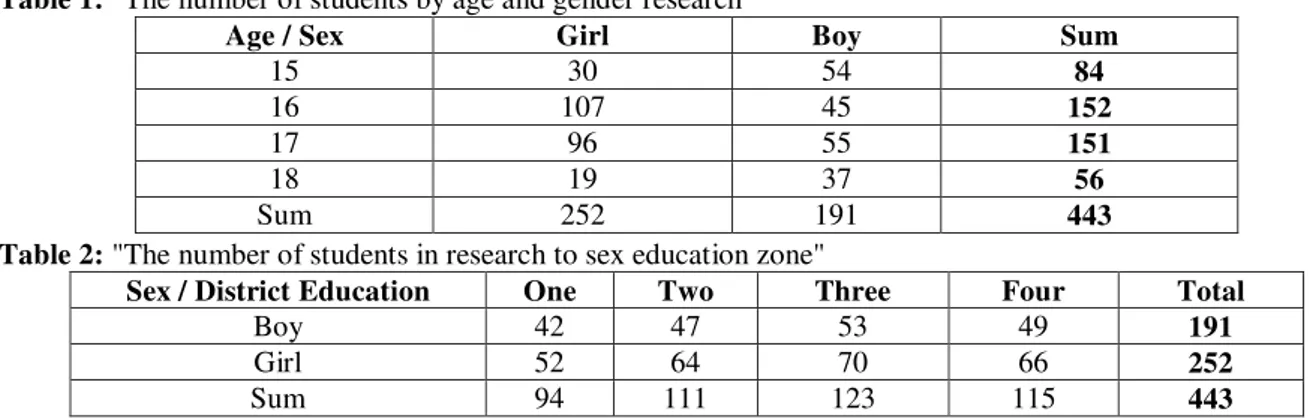
2000 to 1999 and analyzes the performance of 443 students (191 boys and 252 girls) done. The number of students has been shown, according to sex and age, in the following table. Table 1: "The number of students by age and gender research"
Sum Boy
Girl Age / Sex
84
54 30
15
152
45 107
16
151
55 96
17
56
37 19
18
443
191 252
Sum
Table 2: "The number of students in research to sex education zone"
Total Four
Three Two
One Sex / District Education
191
49 53
47 42
Boy
252
66 70
64 52
Girl
443
115 123
111 94
Sum 3.2 Samples and sampling
Given that, Karaj city is composed of four areas of education. And each area is representative of economic class, social and cultural. Boys and girls ages 15 to 18 were selected, using cluster sampling method, according to population density mathematics students in every region. We have been using this method, the sampling unit school. And as such, we initially chose to girls and boys, as they have in mathematics, into a random, from four areas of education, Karaj, and then we were selected, students are required to take, by way of random Between high school. (The number of students sampled represented, according to sex and area of education in Table 1) as they respond to the questionnaire. The number of students sampled the ages of 15-18 years are included Mathematics 191, and the number of girls are sampled in four areas, including 252 people, we are a total population sample consisting of 443 students of mathematics, from four areas of training and Education Karaj.
3.3 Measuring instruments and methods of grading
A questionnaire with 37 questions children anxiety is instrument used in this study, which is included in the test, 28 questions that relate to issues of anxiety, as well as 28 questions divided into three sub-test sub-anxiety, it is of concern physiology, concern / sensitivity before, too, and social concerns / focus. Subtest is composed of 10 questions (physiology concerns), the following criteria are concerned, the emergence
of physiology, concerns poor sleep, nausea and fatigue. In subtests concerns / hypersensitivity is composed of 11 questions, which are related to factors such as obsession with obsession and concern different issues that most of these issues are relatively vague and meaningless, in the child's mind, and they are combined with the fear of injury or emotional rejection. Subtests social concerns / Focus is consists of seven questions, which of the following two criteria are shorter than the other, it significantly. But this small test of "psychological anxiety" is comparable in terms of reliability, and in particular, it is useful in identifying children, that they have academic problems, this criterion is associated with confused thoughts, and sloppy personal fears, and many the nature of the character, or social, that they are leading to problems with concentration and attention. Reply to Questions scale is to double the value yes or no. There is no time limit for the implementation of this scale; it usually takes less than 20 minutes to answer the questions high school students. Yes is on this scale means that the subjects have anxiety, and response is not the absence of fear "anxiety". We do, score one, the questions and answers that they indicate the presence of anxiety and worry, and otherwise, they are zero. The test is designed for ages 6 to 19 years old, the age group 15 to 18 years of mathematics is considered in this study, and the three sub-tests do not conform to each other. 3-4-way test
questionnaire. It was the questionnaire, the students of mathematics, through random sampling, by age. And recipes and a guide to the test is written at the top of the questionnaire, and asked them, which is what they feel and think about themselves, of course, run this test to be done, the questions orally, by an examiner experienced, for primary and earlier ages. Students must respond, for yes and no questions, the test run was carried out to the extent possible by crushing researcher, and the researcher was not possible in places, by teaching the correct way to try a test run to the consultant or educators the level of education, which is run in accordance with instructions and tips test, was also asked of all, that they will certainly note your age, gender and education in the test sheet.
4. RESULTS
Statistical methods were used in this study, that they are formed from two parts. The first part is included descriptive statistics such as mean, standard deviation, standard error, and also set the standard scores Z and convert the scores to T scores was performed, using the formula T= 10Z+50 for the worry, or anxiety in general, and for retailers test scores become the standard Z score T using the formula T = 10Z + 3. Also, we used one-way analysis of variance to compare the results of different ages, education, given the overall scale and subscales of anxiety and physiological, social concerns / focus and in test anxiety / hypersensitivity / and in lie detector test.
Table 3: independent test results between girls and boys in general anxiety
T SE
Standard deviation Mean
NO. Gender / demographic indicator
-3.35
0.491 6.781
16.062 19
Boy
0.578 9.178
18.710 252
Girl F = 1.189 P = 0.279
Is shown in the table above, T test results between boys and girls in general of anxiety, the results are
characterized as absolute value greater than 3.35 T = T is calculated from the table (T degrees
Liberty is 441. Therefore, we conclude with a 0.99 confidence, that there is a significant difference between the mean of comparison, according to data collected with regard to the significant differences between the means of comparison, we conclude, with 0.99 reliability anxiety is generally higher in girls than boys.
Table 4: Comparison of physiological anxiety subscale scores for boys and girls
P dF
T SE
Standard deviation Mean
NO. Gender / demographic indicator
0.560 441
1.85
0.226 3.126
4.016 191
Boy
0.179 2.84
4.544 252
Girl
In the table above, total T (T = 1.85) was smaller than the table (T , is 441 degrees of freedom.
Therefore, we conclude with 0.91 reliability is no significant difference between the means of comparison, the information collected and given the lack of significant difference between the averages of the comparison, we conclude assurance 0.99, significant difference there, between the average scores of girls and boys physiological anxiety concerns.
Table 5: Comparison of scores of boys and girls of concern / Social
dF T
SE Standard deviation
Mean NO.
Gender / demographic indicator
441 1.19
0.153 2.120
2.670 191
Boy
0.177 2.813
2.960 252
Girl
Because, in the above table, calculated absolute value T (T = 1.91) is smaller, the value of T table 441 degrees of freedom, therefore, we conclude that the 0.99 confidence, that there is no significant difference between the average of compared, according to the data collected, and due to the lack of significant difference between the mean of comparison, there is no significant difference between boys and girls.
Table 6: Compare the scores of boys and girls of hypersensitivity
T SE
Standard deviation Mean
NO. Gender / demographic indicator
2.94
0.247 3.418
5.704 191
Boy
0.240 3.804
6.730 252
In the above table, calculated absolute value T (T = 2/94) is greater than the table (T degrees of
freedom at 441. Thus, we conclude with 0.99 ensure that there is a significant difference between the average of compared. According to the data collected, and with regard to the significant differences between the means of comparison, we conclude, that have the girls compared with boys of hypersensitivity.
Table 7: Compare the scores of boys and girls in a Polygraph
T SE
Standard deviation Mean
NO. Gender / demographic indicator
2.53
0.164 2.264
3.675 191
Boy
0.246 3.908
3.908 252
Girl
In the above table, because the absolute value of the calculated T, is T = 2.53, and the value (T larger
table, therefore, we conclude with 0.99% confidence, that there is a significant difference between the average of compared, according to the data collected, and with regard to the significant differences between the means of comparison, we conclude, that showed girls compared with boys, better, and they have expressed more lies.
Analytical ANOVA
According to the analytical analysis of variance, the variation observed in the experimental data it will be split into several segments. And each of the sources identified and known to have obtained, the relative amount of change is examined. (Ferguson Yoshio Takanh translation Delavar 77)
In other words, the analysis of variance is used to test the significance of the difference between average and calculations are done, based on the analysis of variance of scores of different groups, in this manner.
The logic of this approach is the fact that the total variance of scores is divided into two parts between-group variance and within-between-group variance. Variance between between-groups is the average variance in total. The group is represented within-group variance and variance around the mean. In this test the following null hypothesis, the sample was selected from a population, or there is a significant difference between the means of comparison, the population variance is estimated by dividing the mean square between groups (MSB), the mean square within groups (MSW). These estimates form, the ratio of F. (MSB) is indicative independent variable change, and (MSW) is characteristic of the error or mistake.
If the ratio is equal to or greater than the F table F is calculated, the null hypothesis is rejected.
If the difference is not significant between the mean, mean square value of the ratio between the mean square within groups close to one, meaning it is the difference between not mean so much, that we know it, a The real difference, in other words, the difference between the averages is due to the implementation of the independent variable, but it is a random variation or chance, therefore, the null hypothesis is confirmed (Delavar 1996).
Table 8: Mean ± SD age of anxiety separation anxiety general
SE standard deviation
Mean Number
Age / statistical indicators
.8865
8.1247 16.964
84 15
.5514
6.7978 17.671
152 16
.7848
9.6440 17.887
151 17
1.1653
8.7205 17.339
56 18
SE
8.3263 17.5688
443 Total
Table (9): the ANOVA between the ages of 16-15, 17 and 18; in general anxiety factor
Probability of F Mean sum of squares
Total squares Degrees of freedom
Age / indices
.8671
16.8550 50.5650
3 Intergroup
69.6858 30592.0852
439 Intergroup
Mean sum of squares 30642.6501
442 Age / indices
difference between the average of comparable students in mathematics city Karaj, we can not determine that there is a significant difference between the mean of the anxiety, ages 15, 16, 17, 18.
Table (10): physiological anxiety average standard deviation of boys and girls in mathematics by age
SE standard deviation Mean Number Statistical indicators 0.3528 2.2338 3.9762 84 15 0.2206 2.7192 4.3082 152 16 0.2651 3.2571 4.5563 151 17 0.3207 2.4001 4.1964 56 18 0.1413 2.9749 3.3160 443 Sum
Table 11: ANOVA between the different ages of physiological anxiety
Probability of F Mean sum of
squares Total squares
Degrees of freedom Sources variance / Shas
statistics 0.5388 6.4086 19.2259 3 Intergroup 8.8668 3892.5303 439 Intergroup 3911.7562 442 Sum
In the table above, the results of ANOVA between the ages of girls and boys in mathematics physiological factors are anxiety, based on the results obtained, as calculated F (F = 0.7228) is smaller than 0.01 degrees F table Freedom 3 and 439. We conclude with 0.99 ensure that there is no significant difference between the means of comparison. According to the data collected, and due to the lack of significant difference between the mean of comparison, therefore, we can conclude with 0.99% confidence, that there is a significant difference between the mean of anxiety physiological mathematics students ages 15 -16-17-18 years.
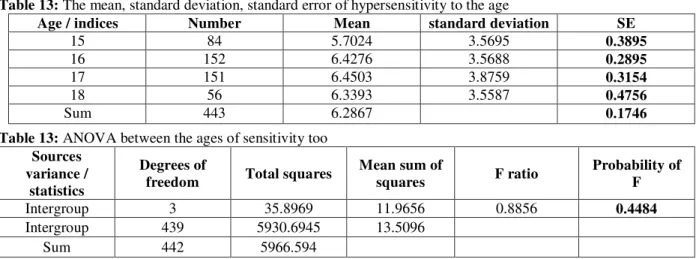
Table 13: The mean, standard deviation, standard error of hypersensitivity to the age
SE standard deviation
Mean Number
Age / indices
0.3895 3.5695 5.7024 84 15 0.2895 3.5688 6.4276 152 16 0.3154 3.8759 6.4503 151 17 0.4756 3.5587 6.3393 56 18 0.1746 6.2867 443 Sum
Table 13: ANOVA between the ages of sensitivity too
Probability of F F ratio
Mean sum of squares Total squares Degrees of freedom Sources variance / statistics 0.4484 0.8856 11.9656 35.8969 3 Intergroup 13.5096 5930.6945 439 Intergroup 5966.594 442 Sum
The table above results are ANOVA between the ages of girls and boys in mathematics in sensitivity too, based on the results obtained, as calculated F (F = 0.8856) is smaller than the value of F table 0.01 Badrjat release level 3 and 439. We conclude with 0.99 reliability that there is no significant difference between the means of comparison. According to the data collected, and not significant with regard to the means of comparison, therefore, we can not conclude, with 99/0 percent confidence, that there is a significant difference between the averages of the sensitivity too, in age mathematics students.
Table 14: The mean and standard deviation, standard error of girls and boys in the age of social concern
SE standard deviation
Mean Number
Age / indices
0.3644 3.3394 3.1310 84 15 0.1918 2.3645 2.8421 152 16 0.1846 2.7684 2.7285 151 17 0.3103 2.3220 2.6607 56 18 0.1206 2.5388 2.8352 443 Sum
Table 15: ANOVA between the ages of social concern
Probability of F F ratio
Mean sum of squares Total squares
Degrees of freedom Sources variance /
ANOVA results table is different between male and female students in mathematics, the sensitivity factor too. Based on the results obtained, as calculated F (F = 0.5558) is smaller than 0.01 degrees of freedom, F table 3 and 439. We conclude and 0.99 percent certainty, that there is no significant difference between the social concern, of different ages mathematics students.
5. CONCLUSION
Tables (1 to 5) show information about the mean, variance, correlation and Cronbach's alpha coefficient and corrected, by the removal of the question. Also, they showed Cronbach alpha values, for general anxiety, and each of the factors, and gender segregation.
Questions that have more reliability coefficient of reliability of the whole, in this way, they are not effective in increasing reliability, and we can not remove it, and we consider an asterisk (*) multiplied, in the table related to this section, in addition to the questions that they had no effect on the test, or remove them was to increase the reliability of the test. Questions that were not effective in reliability, they are consistent with a lie detector in this study, and they should be removed from the test to reliability. Cronbach's alpha value is 0.7485 for general anxiety, it is 0.4399 for psychological stressor, it is 0.7029 for hypersensitivity, it is 0.4366 to social concerns, and it is 0.4295 to a lie detector. This factor is obtained at an average level of general anxiety, compared to rates achieved by the test makers. Test builders have gained a coefficient, which has been fluctuating, for different age groups from 0.79 to 0.84. The reliability of the test is about gender tests indicate stability compared with the reliability of the manufacturers, the Sex 0.72 for girls, 0.75 per cent for boys.
More information can be found backing and a considerable impact on the sub-sense agents (Reynolds and Asloinski 1985).
We used a retest to verify the reliability of the test. For this purpose, the test was performed again after 25 days of its first performance, on 45 students, that they represent the different ages of the samples, which were obtained by
multiplying the reliability of 0.875, which corresponds to reliability Report by the test makers. The main test coefficient is 0.9.
We used to check the validity of Sarah validity. For this purpose, the correlation between test scores and test anxiety (STAI) was calculated RCMAS on 64 students, that they represent the community (boys and girls ages Mathematics). The correlation coefficient is 0.27, which is obtained at a lower level compared to other tests, including factors that have affected the credibility (reliability) testing; we can mention the following factors.
1. consistent with the culture of Iranian students have some questions
2. Error in the absence and lack of clarity about some questions
These factors have led to the validity of the test is somewhat lower than the initial test reliability (r = 0.35 primary factor authentication out) In the analysis, there is still value 5 actions, the 5 factors explaining 31.7% of the total variance of scores, given that, RCMAS test consists of a physiological anxiety, social anxiety, hypersensitivity and a lie detector too special. Anxiety and concern were generally more physiological factors other platforms, and this is the first factor 5.59 for the second factor is 2.1342.
6. Limitations of the study
This standardization was in America on children 16 to 19 years. However, this research has been standardized due to lack of time on the ages of 15 and 18 years of mathematics, and therefore, the results are not generalizable to other age groups.
Home
1. Because the sample is limited to students in mathematics city Karaj, Considering the need for the country to such a diagnostic test mice, which are implemented in the overall duration, standardized tests are necessary RCMAS appear in other areas.
2. It is necessary to run the test for other age groups, to Mansour RCMAS test application in other ages.
REFERENCES
1. Taghavi Seyed Mohammad Reza, Alishahi Mohammad Javad. 2013. Children's Manifest Anxiety Scale reliability and validity study. Journal of Psychology: 7 (4); 342-357. 2. Taghavi, Seyed Mohammad Reza. 2005.
Standardization Children's Manifest Anxiety Scale (RCMAS) for students of different levels of education in Shiraz. Journal of Social Sciences and Humanities, University of Shiraz in 2005 (45): 179-188.
3. Delavar, Ali (1999) Probability and Statistics Applied Psychology and Educational Sciences Publishing growth.
4. Mashhadi, Ali. Soltani Shal, Reza. Mirdorghi, Fatemeh. Bahrami, Batool. 2011. psychometric characteristics of the Multidimensional Scale of anxiety for children. Applied Psychology, 6 (1): 70-87. 5. Mofrad, Sakineh. Atefvahid, Mohammad
Kazem. Bayanzadeh, Seyed Akbar. 2012. Comparison of anxious concern and normal children in city schools dashtestan. Journal of Psychiatry and Clinical Psychology, 8 (2): 65-72.
6. Reynolds‚ C. R.‚ & Richmond‚ B. O. (1978). What I Think and Feel: A Revised measure ofChildren’s Manifest Anxiety. Journal of Abnormal Child Psychology‚ 6‚ 271–280. 7. Reynolds‚ C. R.‚ & Richmond‚ B. O. (1994).
Revised Children’s Manifest Anxiety Scale (RCMAS)Manual. Western Psychological Services‚ Los Angeles
8. Reynold C.R (1985). MULTITRAIT Validation of the Revised children’s manifest Anaxiety scale for children of nigh intelligence.