www.atmos-chem-phys.net/13/791/2013/ doi:10.5194/acp-13-791-2013
© Author(s) 2013. CC Attribution 3.0 License.
Chemistry
and Physics
Technical Note: New methodology for measuring viscosities in small
volumes characteristic of environmental chamber particle samples
L. Renbaum-Wolff, J. W. Grayson, and A. K. Bertram
Department of Chemistry, University of British Columbia, 2036 Main Mall, Vancouver, BC, V6T 1Z1, Canada
Correspondence to:A. K. Bertram ([email protected])
Received: 6 September 2012 – Published in Atmos. Chem. Phys. Discuss.: 15 October 2012 Revised: 3 January 2013 – Accepted: 10 January 2013 – Published: 22 January 2013
Abstract. Herein, a method for the determination of vis-cosities of small sample volumes is introduced, with im-portant implications for the viscosity determination of par-ticle samples from environmental chambers (used to simu-late atmospheric conditions). The amount of sample needed is<1 µl, and the technique is capable of determining viscosi-ties (η) ranging between 10−3and 103Pascal seconds (Pa s) in samples that cover a range of chemical properties and with real-time relative humidity and temperature control; hence, the technique should be well-suited for determining the vis-cosities, under atmospherically relevant conditions, of par-ticles collected from environmental chambers. In this tech-nique, supermicron particles are first deposited on an inert hydrophobic substrate. Then, insoluble beads (∼1 µm in di-ameter) are embedded in the particles. Next, a flow of gas is introduced over the particles, which generates a shear stress on the particle surfaces. The sample responds to this shear stress by generating internal circulations, which are quanti-fied with an optical microscope by monitoring the movement of the beads. The rate of internal circulation is shown to be a function of particle viscosity but independent of the particle material for a wide range of organic and organic-water sam-ples. A calibration curve is constructed from the experimen-tal data that relates the rate of internal circulation to particle viscosity, and this calibration curve is successfully used to predict viscosities in multicomponent organic mixtures.
1 Introduction
Atmospheric particles may play an important role in the Earth’s climate by scattering and absorbing solar and terres-trial radiation and by acting as ice and liquid cloud droplet
nuclei (IPCC, 2007). These particles may also influence at-mospheric chemistry through heterogeneous interactions be-tween particles and gas-phase compounds (P¨oschl, 2005; George and Abbatt, 2010; Rudich et al., 2007). Despite their importance, many of their fundamental properties, includ-ing basic physical properties such as their phases and vis-cosities, remain poorly understood (P¨oschl, 2005; Hallquist et al., 2009; Kanakidou et al., 2005; Vaden et al., 2011; Vir-tanen et al., 2010; Saukko et al., 2012). However, the par-ticle viscosity can influence the ability of these parpar-ticles to act as ice or liquid cloud droplet nuclei, uptake water and non-reactive gases, and undergo reactions with atmospheric oxidants (Zobrist et al., 2008, 2011; Renbaum and Smith, 2009; Murray, 2008; Murray et al., 2010, 2012; Vaden et al., 2011; Katrib et al., 2005; Mikhailov et al., 2009; Shiraiwa et al., 2011; Bones et al., 2012; Knopf et al., 2005; Virta-nen et al., 2010; Wang et al., 2012). Likewise, the forma-tion and growth of secondary organic aerosol (SOA) par-ticles may be influenced by particle viscosity (Cappa and Wilson, 2011; Koop et al., 2011; Perraud et al., 2012; Shi-raiwa et al., 2011; Vaden et al., 2011). In order to accurately predict the role of atmospheric particles in various atmo-spheric processes, the particle viscosities under various rel-ative humidity (RH) and temperature conditions should be known; yet, to date, no direct measurements of these viscosi-ties have been made. Atmospheric particles may potentially vary from liquids, which typically have viscosities ranging from 10−3
−102Pa s, to solids, which typically have
corresponds to milligrams) assuming reasonable collection times (You et al., 2012). Hence a technique is required that can measure viscosities in small volumes (≤1 µl) and over a wide range of viscosities.
While many viscometers are able to accommodate small sample volumes (0.6–10 µl), they may not be well suited to studying many atmospherically relevant samples since they are limited to viscosities<1×10⁻¹Pa s (Han et al., 2007; Lin et al., 2007; Pipe and McKinley, 2009; Srivastava et al., 2005; Srivastava and Burns, 2006; Silber-Li et al., 2004). Atomic force microscopy can also be used to determine vis-cosities in small (≤200 µl) samples, but is also limited to low viscosities (<5×10⁻²Pa s) due to the strong dissipative ef-fects which exist at higher viscosities (Ahmed et al., 2001; Bergaud and Nicu, 2000). Various fluorescence microscopy techniques can be used to determine diffusion constants in samples as small as single cells (Hess et al., 2002; Reits and Neefjes, 2001; Rossow et al., 2010; Spiller et al., 2010), and the viscosities of the samples may then be estimated with some foreknowledge of the hydrodynamic radius of the flu-orescent dye. Fluorescence recovery after photobleaching, which allows the highest viscosity measurements of these techniques, is typically limited to viscosities<10 Pa s (this limit was calculated assuming a hydrodynamic radius of
∼1 nm for the fluorescent dye (Nagy et al., 1989) and a data collection time of 10 min). In addition to being limited to rel-atively low viscosities, fluorescence microscopy techniques require specialized equipment that is not available in many laboratories.
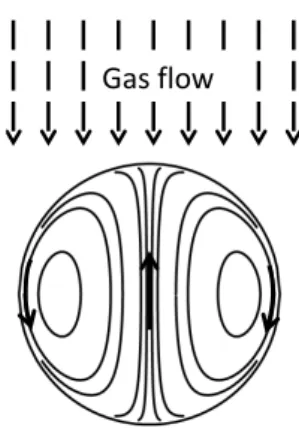
A viscosity-dependent phenomenon in the area of cloud microphysics that has received significant attention in the past is the internal circulation within a water droplet as it falls through air. Internal circulations develop due to the flow of the gas past the drop surface, which imposes shear stress on the drop (LeClair et al., 1972). Consistent with experi-ments (Abdel-Alim and Hamielec, 1975; LeClair et al., 1972; Pruppacher and Beard, 1970; Szak´all et al., 2009; Garner and Haycock, 1959), theory predicts that the internal circulation flow patterns resemble circular vortices (Hadamard, 1911; LeClair et al., 1972). A two dimensional representation of the flow patterns predicted by theory are illustrated in Fig. 1 (Hadamard, 1911; LeClair et al., 1972). In three dimensions the circulation should envelop a circle of radius r=a/√2 that lies in a plane perpendicular to the image in Fig. 1, where
a is the radius of the falling droplet. Theory (Spells, 1952; Hadamard, 1911) also predicts that the rate of internal circu-lations within the droplets will depend on the viscosity of the drop – as the viscosity increases the circulation will decrease (Hadamard, 1911; LeClair et al., 1972; McDonald, 1954).
Here, we outline a simple technique for measuring vis-cosities that is based in part on the phenomenon described above (i.e. internal circulation in a particle due to a shear stress by a gas) and show that the technique may be applied to measure the viscosity of multicomponent, complex mix-tures. Supermicron particles of the sample material are first
Gas flow
Fig. 1.2-Dimensional representation (cross-sectional view though the center of the drop and parallel with the gas flow) of the theoreti-cal internal flow patterns for a liquid spheritheoreti-cal drop as it falls at ter-minal velocity through a stationary fluid (Hadamard, 1911; LeClair et al., 1972). The dashed arrows represent the direction of the gas flow and the solid arrows represent the direction of the internal flow (i.e. streamlines). The 3-dimensional flow is axisymmetric about an axis directed towards the pole of the sphere along which the gas moves.
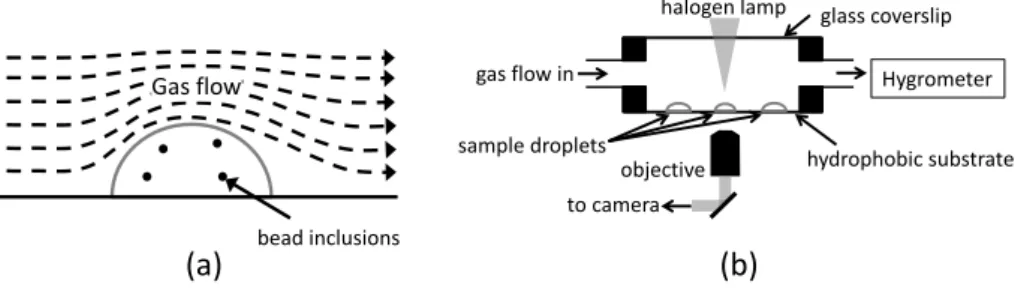
deposited on an inert hydrophobic substrate. Then insoluble beads (∼1 µm in diameter) are embedded in the supermi-cron particles. Next a flow of gas is introduced over the par-ticles, which generates a shear stress on the particle surfaces (Fig. 2a). The sample responds to this shear stress by gener-ating internal circulations, the speed of which is quantified with an optical microscope by monitoring the movement of the beads (Fig. 2b). The rate of internal circulation is related to the gas flow rate and the viscosity of the particles. It fol-lows that at a given gas flow rate, the rate of internal circu-lation can be related to the particle viscosity. Since viscosity is not particle size dependent except under very atypical cir-cumstances (Malik et al., 2010) the results obtained with this technique should be applicable to particles at least as small as 0.1 µm.
The amount of sample needed to prepare the supermicron particles using the technique described herein is <1 µl. In practice, only one supermicron particle with a volume of 10s of picoliters is needed for viscosity measurement although on the order of∼1 mg of sample is needed to generate the solutions from which particles are made using the techniques described here. In addition to the small sample volumes re-quired, the technique allows viscosities ranging at least be-tween 10−3< η <103Pa s to be measured in particles that
gas flow in Hygrometer glass coverslip
hydrophobic substrate sample droplets
halogen lamp
objective
to camera
(b)
Gas flow
bead inclusions
(a)
Fig. 2. (a)Illustration of flow around a sample particle.(b)Schematic of instrumental setup where the hydrophobic substrate was either siliconized glass or Teflon. The gas flow was N2, either introduced as a dry flow or as a humidified flow.
Table 1.Types of material studied as well as the molecular formula, molecular weight (MW), oxygen-to-carbon (O:C) atomic ratio and viscosity (20◦C) of the material. The materials have been arranged by increasing O:C ratio.
Particle material Range of Molecular formula of MW of O:C of Range of References for
concentrations organic organic organic viscosities viscosities
studied (g mol−1) studied (Pa s)
(wt % organic)
Oleic Acid ∼100 C18H34O2 282 0.11 0.04 Noureddini et al. (1992);
Valeri and Meirelles (1997)
TergitolTMNP-7a ∼100 C29H52O8 528 0.28 0.307b Dow Chemical Company (2004)
1,2,6-hexanetriol ∼100 C6H14O3 134 0.50 2.63 Aldrich Chemical Company (1996)
Polyethylene ∼100 H(OCH2CH2)nOHn=12–14 600c 0.54 0.17d Zhang et al. (2011)
glycol-600
Polyethylene ∼100 H(OCH2CH2)nOHn=8–9 400c 0.56 0.134 Heymes et al. (2006)
glycol-400
Polyethylene ∼100 H(OCH2CH2)nOHn=6–7 300c 0.58 0.075 Heymes et al. (2006)
glycol-300
Tetraethylene ∼100 C8H15O5 194 0.63 0.055 Dow Chemical Company (2007);
glycol Moumen et al. (2006)
Sucrose+Water 55–84 C12H22O11 342 0.92 0.047–343 See Supplement
Glycerol+Water 35–∼100 C3H8O3 92 1.00 2.91×10⁻³−1.41 See Supplement
(20◦C data)
Glycerol+Water 21–92 C3H8O3 92 1.00 3.63×10⁻³−1.89 See Supplement
(0◦C data)
aα-(4-nonylphenyl)-ω-hydroxy-poly(oxy-1,2-ethanediyl), branched.>97 wt%,
bViscosities extrapolated from the cited literature viscosity data at 25◦C to 20◦C using the
temperature dependence for TergitolTMNP-7 predicted by the Joback group contribution method,
cAverage molecular weight,
dCalculated based on polynomial fit to cited viscosity vs. temperature data between 25–50◦C.
2 Experimental
2.1 Types of particles studied
For these experiments we focused on particles consisting of organics and mixtures of organics and water (i.e. aqueous or-ganic solutions), since oror-ganics comprise a large fraction of atmospheric aerosol particles (Jimenez et al., 2009; Kanaki-dou et al., 2005). The specific organics (purchased from Sigma Aldrich in all cases with purities≥99% unless oth-erwise noted) studied are listed in Table 1. Also included in Table 1 are the molecular formula, molecular weight (MW) and oxygen-to-carbon (O:C) atomic ratio of the organic ma-terial and the viscosities of the samples studied based on lit-erature data. The specific species were chosen to cover the range of O:C values and molecular weights expected for or-ganic particles found in the atmosphere. As a large fraction
of organic particles in the atmosphere are expected to be hy-groscopic (i.e. take up water as the RH increases from 0 to 100 %), it was also important to study aqueous organic solu-tions. Aqueous solutions of glycerol and sucrose were cho-sen because these solutions cover a wide range of viscosities (nearly six orders of magnitude) and because they have well-established viscosity data in the literature across large con-centration ranges (0–100 wt % glycerol and 0–85 wt % su-crose).
In addition to the species studied in Table 1, particles of virgin olive oil were also investigated using the technique described herein in to show that the technique is applicable to complex mixtures.
2.2 Production of particles
Dilute aqueous (or methanol in the cases of oleic acid and olive oil) solutions of the standards were prepared and neb-ulized to form supermicron particles on a hydrophobic glass or Teflon slide. A dilute aqueous suspension of∼1 µm hy-drophilic melamine beads (actual diameter ∼930±50 nm, Sigma Aldrich Cat# 86296) was then nebulized over the slide containing the supermicron particles, which resulted in the beads being incorporated into the particle bulk. Melamine beads were chosen as they are prepared by the manufac-turer without the use of surfactants and are not susceptible to swelling or aggregation in solution. The slide containing the sample particles with bead inclusions was then placed in a flow cell with relative humidity control (see Fig. 2b). All particles were between 30–50 µm in diameter.
For particles studied in the absence of water, experiments were carried out with the relative humidity of the carrier gas set to<0.5 % RH. For particles consisting of aqueous or-ganic solutions, RH values ranging from 25 to 95 % RH were used. To calculate the composition of the particles for a given RH, relationships between RH and composition were used (for aqueous solutions of sucrose see Zobrist et al. (2011) and for aqueous solutions of glycerol see Table S1 in the Supple-ment).
2.3 Viscosity of the particles
In order to explore the relationship between internal circula-tion and particle viscosity, viscosities of the standards listed in Table 1 were needed. For the single component organics (at<0.5 % RH), viscosities were assumed to be well approx-imated by the viscosity of the pure organic and were taken from the references shown in Table 1, last column. For aque-ous solutions of sucrose and glycerol, we used relationships between RH and viscosity developed in the Supplemental In-formation (see Table S2 in the Supplement) to calculate vis-cosity in the experiments. For the virgin olive oil samples we used a rotational viscometer (Haake RotoVisco 550) to de-termine the viscosity of the bulk sample (see Supplement).
2.4 Microscopy/flow cell
The flow cell is similar to those described in detail else-where (Bodsworth et al., 2010; Parsons et al., 2004) except the flow cell used herein had an internal volume of 0.1 cm3. Briefly, the slide is mounted in the flow cell where the rel-ative humidity is controlled by using a water bubbler in a temperature-controlled bath. The flow of ultra-high purity ni-trogen through the high purity water (18 Mcm) is main-tained at a constant flow rate (1.2 standard liters per minute,
slpm, or ∼100 cm s−1 through the cell except in Sect. 3.3
where the effect of flow rate was explored) and the RH in the cell is adjusted by controlling the bath temperature. A hy-grometer (General Eastern, Model 1311DR) in line after the flow cell was used to determine the dew point temperature of the flow and a thermocouple was used to determine the tem-perature of the sample cell, which was maintained at room temperature unless otherwise noted.
The Reynolds number for flow around the particle, Reparticle, can be calculated by the equation Reparticle= (ρgUgdp)/ηgwhereUg is the speed of the gas far from the particle surface,ρgandηgare the density and viscosity of the gas, and dp is the particle diameter (Reist, 1984). Reparticle
was typically between 0.03–7 across the flow rate range de-scribed in Sect. 3.3 and between 2–3 for the remainder of the experiments described herein. Thus the flow across the par-ticles is at the upper limit of the laminar flow regime or the lower limit of the intermediate flow regime for a fluid flowing around a particle.
The flow cell was mounted to a light-transmitting micro-scope (63x objective, Zeiss Axio Observer) or reflectance mi-croscope (50x objective, Zeiss Axiotech) and images were collected every 0.2–40 s, depending on the rate of move-ment of the beads within the particles. During an experimove-ment the frame rate was adjusted in order to observe measureable movement in each frame. Images were exported to ImageJ software and the average speed of bead movement in the x and y directions was determined by observing the movement of 3–10 beads over 50–100 frames. The focus of the micro-scope was adjusted roughly to mid-height in the particle. At this height, it was possible to observe all beads within the particle, although some of the beads were outside the depth of focus of the microscope objective and thus were not in perfect focus. The beads also move in the z direction within the particle matrix, but since we are interested only in a cor-relation between viscosity and some measure of the speed of movement of the beads and because the z position is not finely resolvable in these experiments, we consider only bead movement in the x and y directions, which we refer to as bead speed.
Fig. 3.Movement of beads “A” and “B” and “C” in an aqueous glycerol particle at 85 % RH(a)t=0 s,(b)t=0.20 s, and(c)t=0.40 s. The x and y coordinates of the beads are included in brackets. Four other circular spots are also evident in the droplets but not labeled. These unlabeled spots are due to either beads that are stuck on the substrate surface that do not move during the experiment or due to dust on the microscope optics. Immobile beads are not included in the data collection. The gas flow is in the direction of negative x values.
2.5 Contact angles of particles on substrate
Contact angles were determined by photographing a large particle (∼3–4 mm diameter) of the standard on the same substrate as used during the bead experiments and then mea-suring the contact angle using ImageJ software.
3 Results and discussion
3.1 Example of data
Shown in Fig. 3a–c is a glycerol particle at∼85 % RH under a shear flow of humidified N2 at a flow rate of 100 cm s−1.
Shown in Movie S1 is the same glycerol particle over 90 frames. From Fig. 3a–c, one can determine that the beads are moving 4–7 µm every 0.20 s in the x–y plane.
The average speed of individual beads in a single particle vary by a factor of 2–4 depending at least in part on their lo-cation within the particle; however, by considering the aver-age bead speed of several beads (3–10) in many particles (3– 5) over 50–100 frames, an average is obtained and this aver-age can be correlated to the particle viscosity (see Sect. 3.4). The average bead speed results are very reproducible from experiment to experiment (typically varying by a factor of two or less), suggesting that the flow fields around the par-ticles are reproducible from experiment to experiment. For example, no significant difference (at 95 % confidence) be-tween average bead speeds measured on different days but with the same gas flow speed, relative humidity, tempera-ture, and particle type was observed for the particle sizes used herein (30–50 µm).
3.2 Internal circulation patterns
The internal circulation patterns in the x–y plane can be roughly visualized by tracing the 2D projected path of the beads as they move over time. Between frames, the beads
!"#$%&'$$
Fig. 4.Internal circulation patterns observed within a glycerol par-ticle at 85 % RH. The focus of the microscope was set at approxi-mately half of the particle height, from which point all of the beads in the particle were visible and their x and y coordinates were de-termined. The red lines are the circulation patterns from monitoring three beads during one cycle of circulation within the particle where the circulation patterns are a 2-D projection of the bead movement in the x–y plane. The circulation patterns have been overlaid on the particle image.
move from one location in the particle (x0,y0) to another
(x1,y1) to another (x2,y2), and so on, as observed in Fig. 3. By
connecting these points with lines for one entire cycle of cir-culation, the circulation patterns in Fig. 4 were constructed. Similar to a particle falling through a gas (Fig. 1), vortices develop within the particles.
3.3 Effect of gas flow rate
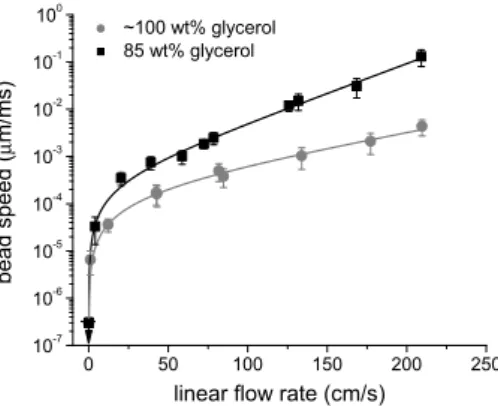
Shown in Fig. 5 are the average bead speeds (±1σ) within glycerol and aqueous glycerol particles (diameter=30– 50 µm). At a flow rate of∼1 cm s−1, the bead movement was
0 50 100 150 200 250 10-7
10-6 10-5 10-4 10-3 10-2 10-1 100
b
e
a
d
s
p
e
e
d
(
µ
m
/m
s
)
linear flow rate (cm/s) ~100 wt% glycerol
85 wt% glycerol
Fig. 5. Bead speed in glycerol particles vs. gas flow rate for ∼100 wt% glycerol and 85 wt% glycerol where the symbols rep-resent the average bead speed and the error bars reprep-resent 1σ.
As discussed above the movement of the melamine beads inside the particle matrix was caused by the shear stress of the gas flow across the particle surface, which causes inter-nal mixing within the particle. Increasing the shear stress by increasing the flow rate of the gas in turn causes an in-crease in the speed of mixing where the magnitude of the speed change depends on the particle viscosity (McDonald, 1954; Song et al., 2003). The shape of the curves in Fig. 5 are roughly consistent with the shape expected for a spher-ical droplet in an axisymmetric gas flow (McDonald, 1954; Song et al., 2003).
3.4 Effect of particle viscosity
In order to investigate the effect of particle viscosity on the speed of the beads, standards (Table 1) of known vis-cosity were tested under a constant linear gas flow rate of 100 (±5) cm s−1and at room temperature (20–21.5◦C). As shown in Fig. 6a, bead speeds correlated well with the parti-cle viscosity over the range of 10−3< η <103Pa s. The data were fit to a power functions=a×ηbwheresis the average bead speed in µm/ms,ηis the particle viscosity in Pa s, anda
andbare the best-fit parameters. The fit to this function gave a best fitR2=0.988 witha=2.73×10⁻⁴andb= −0.955. According to theory for a spherical particle moving through a gas under laminar flow conditions, the speed of internal cir-culation should be inversely proportional to the particle vis-cosity at a constant gas flow rate. Thus, if a power function,
s=a×ηb, is used to describe internal circulation within a spherical particle moving through a gas under laminar flow conditions, the theoretical value of the parameterbshould be
−1 (Hadamard, 1911; LeClair et al., 1972; Milne-Thomson, 1968). The best fit parameterb= −0.955 for our experiments is very close to this theoretical value.
Shown in Fig. 6b are results for glycerol aqueous solutions recorded at room temperature and 0◦C. The overlap in the two data sets indicates that the change in bead speed upon cooling the flow-cell to 0◦C can be explained by a change
in viscosity of the particle. In other words, the bead speed is dependent only on the viscosity of the particle matrix so one calibration curve may be used to determine the viscosities of particles at different temperatures using this technique.
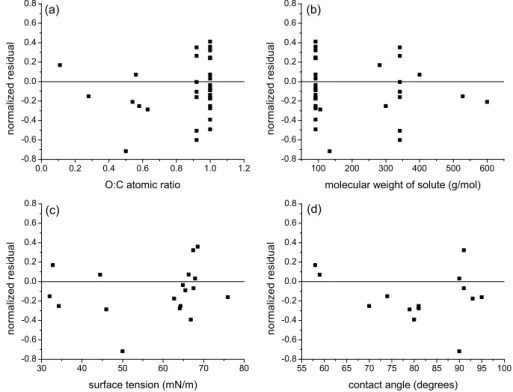
Whether the properties of the organic material have any systematic effect on the relationship between bead speed and viscosity was explored. To do this, the normalized residu-als are calculated: normalized residual=(ηp−ηl)/ηp, where ηpandηl are the predicted viscosities using the calibration
curve in Fig. 6 and the literature viscosities of the standard solutions, respectively. In Fig. 7, these normalized residuals are plotted vs. O:C (Fig. 7a), molecular weight (Fig. 7b), sur-face tension (Fig. 7c) and contact angle between the particle and the hydrophobic glass or Teflon substrate (Fig. 7d). If these physical parameters influence the viscosity measure-ments, systematic positive or negative values or a trend in the residuals is expected. See Supplement and Table S3 for the surface tension values used to generate Fig. 7c. No clear trend is discernible in Fig. 7a–d, suggesting that neither O:C ratio, molecular weight of the organic, surface tension, nor contact angle influences the bead speed vs. viscosity rela-tionship over the ranges studied herein. In order to rule out any contribution to a change in bead speed due to heating by the incandescent light source on the microscope, the bead speed in both glycerol and olive oil particles (<0.5 % RH) was determined at a variety of lamp powers. The change in bead speed with a change in light intensity was less than the uncertainty in the measurements suggesting heating of the particle by the incandescent light source had negligible ef-fect on the speed of the beads inside the particle matrix even in olive oil samples where visible light absorption is apparent by its yellow color. The bead concentration was maintained so that they constituted much less than 1 % (typically 0.01– 0.1 %) of the total particle volume and the bead speed was independent of bead concentration in this regime. See Fig. 8a for bead speed vs. light intensity and Fig. 8b for bead speed vs. bead concentration.
3.5 Predictions of viscosity of complex, multicomponent particles using calibration data
To display the utility of this technique for measuring the vis-cosities of complex particles, the bead speeds in 30–50 µm virgin olive oil particles were used along with the calibration curve shown in Fig. 6a to determine the viscosity of the olive oil particles. Like in the measurement of bead speeds for the standard particles, the average bead speed of many (5) beads in multiple (3) particles was determined.
10-3 10-1 101 103 10-8 10-7 10-6 10-5 10-4 10-3 10-2 10-1 100
10-3 10-2 10-1 100 10-5 10-4 10-3 10-2 10-1 best-fit function
95% prediction limits
m e a n b e a d s p e e d (µ m /m s )
viscosity (Pa s)
glycerol sucrose PEG300 PEG400 PEG600 oleic acid Tergitol NP-7 1,2,6 hexanetriol tetraethylene glycol glycerol, 0 oC (a)
best-fit function 95% prediction limits
glycerol glycerol, 0 o
C m e a n b e a d s p e e d ( µ m /m s )
viscosity (Pa s)
(b)
Fig. 6. (a)Average bead speed (±1σ) vs. viscosity for the standard compounds listed in Table 1. (b)Average bead speed (±1σ) vs. viscosity for aqueous solutions of glycerol at 0◦C and room temperature in order to display the effect of temperature on the bead speed vs. viscosity results. A calibration line was fit to all of the standard mean bead speed data from the standard compounds. Unless indicated in the figure legend all data correspond to room temperature (20–21.5◦C). Polyethylene glycols with average molecular weights of 300, 400, and 600 g mol−1are abbreviated as PEG300, PEG400, and PEG600, respectively.
55 60 65 70 75 80 85 90 95 100 -0.8 -0.6 -0.4 -0.2 0.0 0.2 0.4 0.6 0.8
30 40 50 60 70 80
-0.8 -0.6 -0.4 -0.2 0.0 0.2 0.4 0.6 0.8
100 200 300 400 500 600 -0.8 -0.6 -0.4 -0.2 0.0 0.2 0.4 0.6 0.8
0.0 0.2 0.4 0.6 0.8 1.0 1.2 -0.8 -0.6 -0.4 -0.2 0.0 0.2 0.4 0.6 0.8 n o rm a liz e d r e s id u a l
contact angle (degrees)
(d) n o rm a liz e d r e s id u a l
surface tension (mN/m)
(c) n o rm a liz e d r e s id u a l
molecular weight of solute (g/mol)
(b) n o rm a liz e d r e s id u a l
O:C atomic ratio
(a)
Fig. 7.Normalized residuals from the data presented in Fig. 6, plotted as a function of(a)O:C atomic ratio,(b)molecular weight of solute, (c)surface tension and(d)contact angle.
Fasina et al. (2006) measured the viscosity of olive oil to be 0.087 Pa s at 20◦C. The viscosity of the same sample of
vir-gin olive oil as used in the bead movement technique was measured using a conventional rotational viscometer (see Supplement). The viscosity value obtained with the viscome-ter was 0.097 (±0.006) Pa s, in excellent agreement with the viscosity obtained with the bead technique.
0 10 20 30 40 50 60 70 80 90 100 1x10⁻⁴
1x10⁻³
1x10⁻²
0 20 40 60 80 100 120 140 160 180 1x10⁻⁴
2x10⁻⁴
3x10⁻⁴
4x10⁻⁴
5x100.000-4 0.001 0.002 0.003 0.004 0.005 0.006
m
e
a
n
b
e
a
d
s
p
e
e
d
(
µ
m
/m
s
)
Light intensity (Watts)
(a)
m
e
a
n
b
e
a
d
s
p
e
e
d
(
µ
m
/m
s
)
beads/ particle
(b)
bead volume fraction
Fig. 8. (a)Mean melamine bead speed vs. light intensity of the halogen light source on the microscope in particles composed of∼100 wt% glycerol (black squares) and∼100 wt% olive oil (grey triangles) at room temperature,(b) Mean melamine bead speed vs. number of beads/particle or bead volume fraction in particles composed of∼100 wt% glycerol. In(a)and(b), the solid lines represent the best fit functions and the dashed lines represent the upper and lower 95 % prediction intervals.
solutions, the resulting viscosity of the complex particles of olive oil was calculated to be 0.11 (+0.09/−0.05) Pa s, equiv-alent to the viscosity determined using all of the standard so-lutions above.
3.6 Implications for environmental chamber samples
Above, the rate of internal circulation was shown to be a function of particle viscosity but independent of the parti-cle material for organic and organic-water samples, with O:C values ranging from 0.1–1.0, surface tensions values ranging from 32–75 mN m−1, and molecular weights ranging from
92–600 g mol−1 and the utility of this technique was dis-played by determining the viscosity of a complex mixture, virgin olive oil. Consequently, this technique should be well suited for studying the viscosity of many types of secondary organic aerosol particles collected in environmental cham-bers. For example, typical average O:C ratios of secondary organic particles from environmental chambers are in the range of 0.3–0.6 (Chen et al., 2011; Nguyen et al., 2010; Shilling et al., 2009; Walser et al., 2008). While the surface tensions of secondary organic particles collected in environ-mental chambers are largely unknown in the subsaturated RH regime,α-pinene secondary organic particles generated in environmental chambers are expected to have surface ten-sions of 40–75 mN m−1assuming the surface tension at
sub-saturated RH is well approximated by an aqueous mixture of pinonic acid, pinic acid, and pinonaldehyde (Huff Hartz et al., 2006; Hyv¨arinen et al., 2006; Tuckermann and Cam-menga, 2004). The molecular weights and structures of par-ticulate secondary organic material formed in environmen-tal chambers vary widely with precursor and oxidant iden-tities as well as with reaction conditions and reaction time; however, for a variety of systems, products with molecular
weights<600 g mol−1make up a significant portion to a ma-jority of the particle mass (Gao et al., 2004; Kalberer et al., 2004; Hamilton et al., 2011; Nguyen et al., 2010, 2011).
The ability to control the relative humidity and tempera-ture of the sample cell allows the viscosity of particles to be measured under atmospherically relevant conditions. Since water may act as a plasticizer in atmospheric particles (Koop et al., 2011; Mikhailov et al., 2009), understanding how the viscosity of particles changes with relative humidity (and thus equilibrium water content) is important in understand-ing the importance of particle viscosity in atmospheric pro-cesses.
3.7 Advantages and disadvantages of bead technique
The bead technique currently suffers from fairly poor accu-racy with average upper and lower 95 % prediction inter-vals of +184 % and −55 % of the measured viscosity. Be-cause the bead technique is a relative technique relying on the known viscosities of standards, the accuracy may be im-proved by utilizing certified viscosity standards for the cal-ibration curve construction. However, one of the purposes of this study was to ensure the technique was reliable under changing relative humidity conditions and to use viscosity standards with a wide variety of O:C values, surface tensions, molecular weights, and contact angles in order to show that the technique is applicable to environmental chamber parti-cle samples and this detailed chemical information is often not available for certified viscosity standards.
>1000 Pa s, the beads no longer move on a reasonable exper-imental timescale<0.2 µm /10 min and thus this technique is currently limited to studying the viscosities of relatively fluid particles (i.e. 10−3< η <103Pa s). While this is considered a wide range of viscosities compared to existing microviscom-etry techniques (Han et al., 2007; Lin et al., 2007; Srivas-tava et al., 2005; SrivasSrivas-tava and Burns, 2006; Silber-Li et al., 2004), it should be noted that secondary organic matter from chamber oxidation of pinene may potentially range from the viscosity of water (10−3Pa s) at 100 % RH to the viscosity of glasses (≥1012Pa s) under dry conditions at or near room temperature (Koop et al., 2011).
There are several advantages of the bead technique for measuring sample viscosities. First, the amount of sample needed to prepare the supermicron particles is <1 mg. In practice, only the material in a single particle (on the order of 10 s of picoliters) is needed to perform a viscosity mea-surement with this technique. However, in order to generate the particles with the technique described above, on the or-der of one or more milligrams (or microliters) of sample is required. Also, the experiment is simple, inexpensive and re-quires only a microscope equipped with an objective of suffi-cient magnification to detect the beads in the particle matrix and a gas flow to initiate mixing within the particle. Addi-tionally, inherent in the instrumental design is the ability to have real-time control over the relative humidity and thus the water content of the sample particles, an important attribute for measuring the viscosities of particles under atmospheri-cally relevant conditions.
4 Conclusions
A new viscosity measurement technique is developed. Us-ing particles of known viscosity, a relationship between the rate of internal circulation and the particle viscosity is deter-mined. The dependence of this relationship on particle prop-erties such as O:C ratio, surface tension, molecular weight, and contact angle is explored. We display the utility of this technique for determining the viscosity of complex, multi-component particles by determining the viscosity of olive oil particles. The viscosity obtained with this technique is in excellent agreement with literature values and with rota-tional viscometer results. The applicability of this technique for studying environmental chamber samples is discussed in detail. While the focus of this paper is the establishment of the viscosity measurement technique, future work will focus on viscosity measurements of secondary organic particulate matter from environmental chamber experiments (in prepa-ration) and extending the applicability of this technique to atmospheric samples, which also contain a significant inor-ganic fraction.
Supplementary material related to this article is
available online at: http://www.atmos-chem-phys.net/13/ 791/2013/acp-13-791-2013-supplement.zip.
Acknowledgements. This research was supported by the National
Sciences and Engineering Research Council of Canada and the Canadian Foundation for Innovation. The authors thank Dan Cziczo for helpful discussions and Leopoldo Gutierrez for viscometer training and use.
Edited by: T. Koop
References
Abdel-Alim, A. H. and Hamielec, A. E.: Theoretical and ex-perimental investigation of the effect of internal circulation on the drag of spherical droplets falling at terminal veloc-ity in liquid media, Ind. Eng. Chem. Fundam., 14, 308–312, doi:10.1021/i160056a004, 1975.
Ahmed, N., Nino, D. F., and Moy, V. T.: Measurement of solu-tion viscosity by atomic force microscopy, Rev. Sci. Instrum., 72, 2731–2734, doi:10.1063/1.1368856, 2001.
Aldrich Chemical Company: 1,2,6-hexanetriol technical bul-letin AL-128, available at: http://www.sigmaaldrich.com/etc/ medialib/docs/Aldrich/Bulletin/al techbull al128.Par.0001.File. tmp/al techbull al0128.pdf (last access: 27 July 2012), 1996. Bergaud, C. and Nicu, L.: Viscosity measurements based on
ex-perimental investigations of composite cantilever beam eigenfre-quencies in viscous media, Rev. Sci. Instrum., 71, 2487–2491, doi:10.1063/1.1150640, 2000.
Bodsworth, A., Zobrist, B., and Bertram, A. K.: Inhibition of ef-florescence in mixed organic-inorganic particles at temperatures less than 250 K, Phys. Chem. Chem. Phys., 12, 12259–12266, doi:10.1039/C0CP00572J, 2010.
Bones, D. L., Reid, J. P., Lienhard, D. M., and Krieger, U. K.: Com-paring the mechanism of water condensation and evaporation in glassy aerosol, Proc. Natl. Acad. Sci. USA, 109, 11613–11618, doi:10.1073/pnas.1200691109, 2012.
Cappa, C. D. and Wilson, K. R.: Evolution of organic aerosol mass spectra upon heating: implications for OA phase and partitioning behavior, Atmos. Chem. Phys., 11, 1895–1911, doi:10.5194/acp-11-1895-2011, 2011.
Chen, Q., Liu, Y., Donahue, N. M., Shilling, J. E., and Mar-tin, S. T.: Particle-phase chemistry of secondary organic mate-rial: modeled compared to measured O:C and H:C elemental ra-tios provide constraints, Environ. Sci. Technol., 45, 4763–4770, doi:10.1021/es104398s, 2011.
Coupland, J. N. and McClements, D. J.: Physical properties of liquid edible oils, J. Am. Oil Chem. Soc., 74, 1559–1564, doi:10.1007/s11746-997-0077-1, 1997.
Dow Chemical Company: Tergitol NP-7 surfactant techni-cal data sheet, available at: http://msdssearch.dow.com/ PublishedLiteratureDOWCOM/dh 00ae/0901b803800ae909. pdf?filepath=surfactants/pdfs/noreg/119-01915.pdf&fromPage= GetDoc (last access: 12 August 2012), 2004.
http://msdssearch.dow.com/PublishedLiteratureDOWCOM/ dh 007e/0901b8038007e5a5.pdf?filepath=ethyleneglycol/pdfs/ noreg/612-00005.pdf&fromPage=GetDoc (last access: 12 August 2012), 2007.
Fasina, O. O., Hallman, H., Craig-Schmidt, M., and Clements, C.: Predicting temperature-dependence viscosity of vegetable oils from fatty acid composition, J. Am. Oil Chem. Soc., 83, 899– 903, doi:10.1007/s11746-006-5044-8, 2006.
Gao, S., Keywood, M., Ng, N. L., Surratt, J., Varutbangkul, V., Bahreini, R., Flagan, R. C., and Seinfeld, J. H.: Low-molecular-weight and oligomeric components in secondary organic aerosol from the ozonolysis of cycloalkenes and α-Pinene, J. Phys. Chem. A, 108, 10147–10164, doi:10.1021/jp047466e, 2004. Garner, F. H. and Haycock, P. J.: Circulation in
liquid drops, Proc. R. Soc. A., 252, 457–475, doi:10.1098/rspa.1959.0166, 1959.
George, I. J. and Abbatt, J. P. D.: Heterogeneous oxidation of atmo-spheric aerosol particles by gas-phase radicals., Nat. Chem., 2, 713–722, doi:10.1038/nchem.806, 2010.
Hadamard, J.: Mouvement permanent lent d’une sphere liquide et visqueuse dans un liquide visqueux, C. R. Acad. Sci., 152, 1735– 1738, 1911.
Hallquist, M., Wenger, J. C., Baltensperger, U., Rudich, Y., Simp-son, D., Claeys, M., Dommen, J., Donahue, N. M., George, C., Goldstein, A. H., Hamilton, J. F., Herrmann, H., Hoffmann, T., Iinuma, Y., Jang, M., Jenkin, M. E., Jimenez, J. L., Kiendler-Scharr, A., Maenhaut, W., McFiggans, G., Mentel, Th. F., Monod, A., Pr´evˆot, A. S. H., Seinfeld, J. H., Surratt, J. D., Szmigielski, R., and Wildt, J.: The formation, properties and im-pact of secondary organic aerosol: current and emerging issues, Atmos. Chem. Phys., 9, 5155–5236, doi:10.5194/acp-9-5155-2009, 2009.
Hamilton, J. F., Rami Alfarra, M., Wyche, K. P., Ward, M. W., Lewis, A. C., McFiggans, G. B., Good, N., Monks, P. S., Carr, T., White, I. R., and Purvis, R. M.: Investigating the use of secondary organic aerosol as seed particles in simulation chamber exper-iments, Atmos. Chem. Phys., 11, 5917–5929, doi:10.5194/acp-11-5917-2011, 2011.
Han, Z., Tang, X., and Zheng, B.: A PDMS viscometer for micro-liter Newtonian fluid, J. Micromech. Microeng., 17, 1828–1834, doi:10.1088/0960-1317/17/9/011, 2007.
Hess, S. T., Huang, S., Heikal, A. A., and Webb, W. W.: Biological and chemical applications of fluorescence corre-lation spectroscopy : a review, Biochemistry, 41, 697–705, doi:10.1021/bi0118512, 2002.
Heymes, F., Manno-Demoustier, P., Charbit, F., Fanlo, J. L., and Moulin, P.: A new efficient absorption liquid to treat ex-haust air loaded with toluene, Chem. Eng. J., 115, 225–231, doi:10.1016/j.cej.2005.10.011, 2006.
Huff Hartz, K. E., Tischuk, J. E., Chan, M. N., Chan, C. K., Don-ahue, N. M., and Pandis, S. N.: Cloud condensation nuclei acti-vation of limited solubility organic aerosol, Atmos. Environ., 40, 605–617, doi:10.1016/j.atmosenv.2005.09.076, 2006.
Hyv¨arinen, A.-P., Lihavainen, H., Gaman, A., Vairila, L., Ojala, H., Kulmala, M., and Viisanen, Y.: Surface tensions and densities of oxalic, malonic, succinic, maleic, malic, and cis-pinonic acids, J. Chem. Eng. Data, 51, 255–260, doi:10.1021/je050366x, 2006. IPCC: IPCC Fourth Assessment Report: Climate Change 2007:
The Physical Science Basis: Contribution of Working Group I
to the Fourth Assessment Report of the Intergovernmental Panel on Climate Change, edited by: Solomon, S., Qin, D., Man-ning, M., Chen, Z., Marquis, M., Averyt, K. B., Tignor, M., and Miller, H. L., Cambridge University Press, Cambridge Univer-sity Press, Cambridge, UK and New York, NY, USA, 996 pp., 2007.
Jimenez, J. L., Canagaratna, M. R., Donahue, N. M., Pre-vot, A. S. H., Zhang, Q., Kroll, J. H., DeCarlo, P. F., Allan, J. D., Coe, H., Ng, N. L., Aiken, A. C., Docherty, K. S., Ulbrich, I. M., Grieshop, A. P., Robinson, A. L., Duplissy, J., Smith, J. D., Wil-son, K. R., Lanz, V. A., Hueglin, C., Sun, Y. L., Tian, J., Laakso-nen, A., RaatikaiLaakso-nen, T., RautiaiLaakso-nen, J., Vaattovaara, P., Ehn, M., Kulmala, M., Tomlinson, J. M., Collins, D. R., Cubison, M. J. E., Dunlea, J., Huffman, J. A., Onasch, T. B., Alfarra, M. R., Williams, P. I., Bower, K., Kondo, Y., Schneider, J., Drewnick, F., Borrmann, S., Weimer, S., Demerjian, K., Salcedo, D., Cot-trell, L., Griffin, R., Takami, A., Miyoshi, T., Hatakeyama, S., Shimono, A., Sun, J. Y., Zhang, Y. M., Dzepina, K., Kim-mel, J. R., Sueper, D., Jayne, J. T., Herndon, S. C., Trim-born, A. M., Williams, L. R., Wood, E. C., Middlebrook, A. M., Kolb, C. E., Baltensperger, U., and Worsnop, D. R.: Evolution of organic aerosols in the atmosphere, Science, 326, 1525–1529, doi:10.1126/science.1180353, 2009.
Kalberer, M., Paulsen, D., Sax, M., Steinbacher, M., Dommen, J., Prevot, A. S. H., Fisseha, R., Weingartner, E., Frankevich, V., Zenobi, R., and Baltensperger, U.: Identification of polymers as major components of atmospheric organic aerosols, Science, 303, 1659–1662, doi:10.1126/science.1092185, 2004.
Kanakidou, M., Seinfeld, J. H., Pandis, S. N., Barnes, I., Den-tener, F. J., Facchini, M. C., Van Dingenen, R., Ervens, B., Nenes, A., Nielsen, C. J., Swietlicki, E., Putaud, J. P., Balkan-ski, Y., Fuzzi, S., Horth, J., Moortgat, G. K., Winterhalter, R., Myhre, C. E. L., Tsigaridis, K., Vignati, E., Stephanou, E. G., and Wilson, J.: Organic aerosol and global climate modelling: a review, Atmos. Chem. Phys., 5, 1053–1123, doi:10.5194/acp-5-1053-2005, 2005.
Katrib, Y., Biskos, G., Buseck, P. R., Davidovits, P., Jayne, J. T., Mochida, M., Wise, M. E., Worsnop, D. R., and Martin, S. T.: Ozonolysis of mixed oleic-acid/stearic-acid particles: reaction kinetics and chemical morphology, J. Phys. Chem. A, 109, 10910–10919, doi:10.1021/jp054714d, 2005.
Knopf, D. A., Anthony, L. M., and Bertram, A. K.: Reactive uptake of O3 by multicomponent and multiphase mixtures
containing oleic acid, J. Phys. Chem. A, 109, 5579–5589, doi:10.1021/jp0512513, 2005.
Koop, T., Bookhold, J., Shiraiwa, M., and P¨oschl, U.: Glass tran-sition and phase state of organic compounds: dependency on molecular properties and implications for secondary organic aerosols in the atmosphere., Phys. Chem. Chem. Phys., 13, 19238–19255, doi:10.1039/c1cp22617g, 2011.
LeClair, B. P., Hamielec, A. E., Pruppacher, H. R., and Hall, W. D.: A theoretical and experimental study of the in-ternal circulation in water drops falling at terminal veloc-ity in air, J. Atmos. Sci., 29, 728–740, doi:10.1175/1520-0469(1972)029<0728:ATAESO>2.0.CO;2, 1972.
Malik, R., Burch, D., Bazant, M., and Ceder, G.: Particle size de-pendence of the ionic diffusivity, Nano. Lett., 10, 4123–4127, doi:10.1021/nl1023595, 2010.
McDonald, J. E.: The shape and aerodynamics of large raindrops, J. Meteorol., 11, 478–494, doi:10.1175/1520-0469(1954)011<0478:TSAAOL>2.0.CO;2, 1954.
Mikhailov, E., Vlasenko, S., Martin, S. T., Koop, T., and P¨oschl, U.: Amorphous and crystalline aerosol particles interacting with water vapor: conceptual framework and experimental evidence for restructuring, phase transitions and kinetic limitations, At-mos. Chem. Phys., 9, 9491–9522, doi:10.5194/acp-9-9491-2009, 2009.
Milne-Thomson, L. M.: Theoretical Hydrodynamics, Macmillan Publishing Group, London, UK, 743 pp., 1968.
Moumen, N., Subramanian, R. S., and McLaughlin, J. B.: Ex-periments on the motion of drops on a horizontal solid sur-face due to a wettability gradient, Langmuir, 22, 2682–2690, doi:10.1021/la053060x, 2006.
Murray, B. J.: Inhibition of ice crystallisation in highly viscous aqueous organic acid droplets, Atmos. Chem. Phys., 8, 5423– 5433, doi:10.5194/acp-8-5423-2008, 2008.
Murray, B. J., Wilson, T. W., Dobbie, S., Cui, Z., Al-Jumur, S., M¨ohler, O., Schnaiter, M., Wagner, R., Benz, S., Niemand, M., Saathoff, H., Ebert, V., Wagner, S., and K¨archer, B.: Heteroge-neous nucleation of ice particles on glassy aerosols under cir-rus conditions, Nat. Geosci., 3, 233–237, doi:10.1038/ngeo817, 2010.
Murray, B. J., Haddrell, A. E., Peppe, S., Davies, J. F., Reid, J. P., O’Sullivan, D., Price, H. C., Kumar, R., Saunders, R. W., Plane, J. M. C., Umo, N. S., and Wilson, T. W.: Glass for-mation and unusual hygroscopic growth of iodic acid solution droplets with relevance for iodine mediated particle formation in the marine boundary layer, Atmos. Chem. Phys., 12, 8575–8587, doi:10.5194/acp-12-8575-2012, 2012.
Nagy, J. A., Herzberg, K. T., Masse, E. M., Zientara, G. P., and Dvorak, H. F.: Exchange of macromolecules between plasma and peritoneal cavity in ascites tumor-bearing, normal, and serotonin-injected mice, Cancer Res., 49, 5448–5458, 1989.
Nguyen, T. B., Bateman, A. P., Bones, D. L., Nizkorodov, S. A., Laskin, J., and Laskin, A.: High-resolution mass spectrom-etry analysis of secondary organic aerosol generated by ozonolysis of isoprene, Atmos. Environ., 44, 1032–1042, doi:10.1016/j.atmosenv.2009.12.019, 2010.
Nguyen, T. B., Roach, P. J., Laskin, J., Laskin, A., and Nizko-rodov, S. A.: Effect of humidity on the composition of isoprene photooxidation secondary organic aerosol, Atmos. Chem. Phys., 11, 6931–6944, doi:10.5194/acp-11-6931-2011, 2011.
Noureddini, H., Teoh, B. C., and Davis Clements, L.: Viscosities of vegetable oils and fatty acids, J. Am. Oil Chem. Soc., 69, 1189– 1191, doi:10.1007/BF02637678, 1992.
Parsons, M. T., Mak, J., Lipetz, S. R., and Bertram, A. K.: Deliques-cence of malonic, succinic, glutaric, and adipic acid particles, J. Geophys. Res., 109, D06212, doi:10.1029/2003JD004075, 2004. Perraud, V., Bruns, E. A., Ezell, M. J., Johnson, S. N., Yu, Y., Alexander, M. L., Zelenyuk, A., Imre, D., Chang, W. L., Dab-dub, D., Pankow, J. F., and Finlayson-Pitts, B. J.: Nonequi-librium atmospheric secondary organic aerosol formation and growth., Proc. Natl. Acad. Sci. USA, 109, 2836–2841, doi:10.1073/pnas.1119909109, 2012.
Pipe, C. J. and McKinley, G. H.: Microfluidic rheometry, Mech. Res. Commun., 36, 110–120, doi:10.1016/j.mechrescom.2008.08.009,2009.
P¨oschl, U.: Atmospheric aerosols: composition, transformation, cli-mate and health effects., Angew. Chem. Int. Ed., 44, 7520–7540, doi:10.1002/anie.200501122, 2005.
Pruppacher, H. R. and Beard, K. V.: A wind tunnel investigation of the internal circulation and shape of water drops falling at terminal velocity in air, Q. J. Roy. Meteor. Soc., 96, 247–256, doi:10.1002/qj.49709640807, 1970.
Reist, P. C.: Introduction to aerosol science, Macmillan Publishing Company, New York, NY, USA, 1984.
Reits, E. A. and Neefjes, J. J.: From fixed to FRAP: measuring pro-tein mobility and activity in living cells., Nat. Cell Biol., 3, 145– 147, doi:10.1038/35078615, 2001.
Renbaum, L. H. and Smith, G. D.: The importance of phase in the radical-initiated oxidation of model organic aerosols: reactions of solid and liquid brassidic acid particles, Phys. Chem. Chem. Phys., 11, 2441–2451, doi:10.1039/b816799k, 2009.
Rossow, M. J., Sasaki, J. M., Digman, M. A. and Gratton, E.: Raster image correlation spectroscopy in live cells., Nat. Protoc., 5, 1761–1774, doi:10.1038/nprot.2010.122, 2010.
Rudich, Y., Donahue, N. M., and Mentel, T. F.: Aging of organic aerosol: Bridging the gap between laboratory and field studies, Annu. Rev. Phys. Chem., 58, 321–352, doi:10.1146/annurev.physchem.58.032806.104432, 2007. Saukko, E., Lambe, A. T., Massoli, P., Koop, T., Wright, J. P.,
Croas-dale, D. R., Pedernera, D. A., Onasch, T. B., Laaksonen, A., Davidovits, P., Worsnop, D. R., and Virtanen, A.: Humidity-dependent phase state of SOA particles from biogenic and an-thropogenic precursors, Atmos. Chem. Phys., 12, 7517–7529, doi:10.5194/acp-12-7517-2012, 2012.
Shilling, J. E., Chen, Q., King, S. M., Rosenoern, T., Kroll, J. H., Worsnop, D. R., DeCarlo, P. F., Aiken, A. C., Sueper, D., Jimenez, J. L., and Martin, S. T.: Loading-dependent elemental composition of a-pinene SOA particles, Atmos. Chem. Phys., 9, 771–782, doi:10.5194/acp-9-771-2009, 2009.
Shiraiwa, M., Ammann, M., Koop, T., and P¨oschl, U.: Gas uptake and chemical aging of semisolid organic aerosol particles., Proc. Natl. Acad. Sci. USA, 108, 11003–11008, doi:10.1073/pnas.1103045108, 2011.
Silber-Li, Z. H., Tan, Y. P., and Weng, P. F.: A microtube viscometer with a thermostat, Exp. Fluids, 36, 586–592, doi:10.1007/s00348-003-0730-x, 2004.
Song, H., Tice, J. D., and Ismagilov, R. F.: A microfluidic system for controlling reaction networks in time, Angew. Chem. Int. Ed., 42, 767–772, doi:10.1002/anie.200390203, 2003.
Spells, K.: A study of circulation patterns within liquid drops moving through a liquid, Proc. Phys. Soc. B, 65, 541–546, doi:10.1088/0370-1301/65/7/310, 1952.
Spiller, D. G., Wood, C. D., Rand, D. A., and White, M. R. H.: Measurement of single-cell dynamics, Nature, 465, 736–745, doi:10.1038/nature09232, 2010.
Srivastava, N., Davenport, R. D., and Burns, M. A.: Nanoliter vis-cometer for analyzing blood plasma and other liquid samples, Anal. Chem., 77, 383–392, doi:10.1021/ac0494681, 2005. Srivastava, N. and Burns, M. A.: Analysis of non-Newtonian
Szak´all, M., Diehl, K., Mitra, S. K., and Borrmann, S.: A wind tun-nel study on the shape, oscillation, and internal circulation of large raindrops with sizes between 2.5 and 7.5 mm, J. Atmos. Sci., 66, 755–765, doi:10.1175/2008JAS2777.1, 2009.
Tuckermann, R. and Cammenga, H. K.: The surface ten-sion of aqueous solutions of some atmospheric water-soluble organic compounds, Atmos. Environ., 38, 6135–6138, doi:10.1016/j.atmosenv.2004.08.005, 2004.
Vaden, T. D., Imre, D., Ber´anek, J., Shrivastava, M., and Ze-lenyuk, A.: Evaporation kinetics and phase of laboratory and am-bient secondary organic aerosol., Proc. Natl. Acad. Sci. USA, 108, 2190–2195, doi:10.1073/pnas.1013391108, 2011.
Valeri, D. and Meirelles, A. J. A.: Viscosities of fatty acids, triglyc-erides, and their binary mixtures, J. Am. Oil Chem. Soc., 74, 1221–1226, doi:10.1007/s11746-997-0048-6, 1997.
Virtanen, A., Joutsensaari, J., Koop, T., Kannosto, J., Yli-Piril¨a, P., Leskinen, J., M¨akel¨a, J. M., Holopainen, J. K., P¨oschl, U., Kul-mala, M., Worsnop, D. R., and Laaksonen, A.: An amorphous solid state of biogenic secondary organic aerosol particles., Na-ture, 467, 824–827, doi:10.1038/nature09455, 2010.
Walser, M. L., Desyaterik, Y., Laskin, J., Laskin, A., and Nizkorodov, S. A.: High-resolution mass spectrometric anal-ysis of secondary organic aerosol produced by ozonation of limonene, Phys. Chem. Chem. Phys., 10, 1009–1022, doi:10.1039/B712620D, 2008.
Wang, B., Lambe, A. T., Massoli, P., Onasch, T. B., Davidovits, P., Worsnop, D. R., and Knopf, D. A.: The deposition ice nucle-ation and immersion freezing potential of amorphous secondary organic aerosol: pathways for ice and mixed-phase cloud forma-tion, J. Geophys. Res., 117, D16209, doi:10.1029/2012jd018063, 2012.
You, Y., Renbaum-Wolff, L., Carreras-Sospedra, M., Hanna, S. J., Hiranuma, N., Kamal, S., Smith, M. L., Zhang, X., Weber, R. J., Shilling, J. E., Dabdub, D., Martin, S. T., and Bertram, A. K.: Im-ages reveal that atmospheric particles can undergo liquid-liquid phase separations., Proc. Natl. Acad. Sci. USA, 109, 13188– 13193, doi:10.1073/pnas.1206414109, 2012.
Zhang, K., Yang, J., Yu, X., Zhang, J., and Wei, X.: Densities and viscosities for binary mixtures of poly ( ethylene glycol) 400+dimethyl sulfoxide and poly (ethylene glycol) 600+water at different temperatures, J. Chem. Eng. Data, 56, 3083–3088, doi:10.1021/je200148u, 2011.
Zobrist, B., Marcolli, C., Pedernera, D. A., and Koop, T.: Do atmo-spheric aerosols form glasses?, Atmos. Chem. Phys., 8, 5221– 5244, doi:10.5194/acp-8-5221-2008, 2008.