www.solid-earth.net/7/1537/2016/ doi:10.5194/se-7-1537-2016
© Author(s) 2016. CC Attribution 3.0 License.
On the mechanical behaviour of a low-angle normal fault: the Alto
Tiberina fault (Northern Apennines, Italy) system case study
Luigi Vadacca1,2, Emanuele Casarotti2, Lauro Chiaraluce2, and Massimo Cocco2
1MOX, Dipartimento di Matematica “F. Brioschi”, Politecnico di Milano, Milan, Italy 2Istituto Nazionale di Geofisica e Vulcanologia, Rome, Italy
Correspondence to:Luigi Vadacca ([email protected])
Received: 4 March 2016 – Published in Solid Earth Discuss.: 8 March 2016
Revised: 14 October 2016 – Accepted: 18 October 2016 – Published: 8 November 2016
Abstract. Geological and seismological observations have been used to parameterize 2-D numerical elastic models to simulate the interseismic deformation of a complex exten-sional fault system located in the Northern Apennines (Italy). The geological system is dominated by the presence of the Alto Tiberina fault (ATF), a large (60 km along strike) low-angle normal fault dipping 20◦in the brittle crust (0–15 km). The ATF is currently characterized by a high and constant rate of microseismic activity, and no moderate-to-large mag-nitude earthquakes have been associated with this fault in the past 1000 years. Modelling results have been compared with GPS data in order to understand the mechanical behaviour of this fault and a suite of minor syn- and antithetic normal fault segments located in the main fault hanging wall.
The results of the simulations demonstrate the active role played by the Alto Tiberina fault in accommodating the on-going tectonic extension in this sector of the chain. The GPS velocity profile constructed through the fault system cannot be explained without including the ATF’s contribution to de-formation, indicating that this fault, although misoriented, has to be considered tectonically active and with a creeping behaviour below 5 km depth.
The low-angle normal fault also shows a high degree of tectonic coupling with its main antithetic fault (the Gubbio fault), suggesting that creeping along the ATF may control the observed strain localization and the pattern of microseis-mic activity.
1 Introduction
The mechanical behaviour of low-angle normal faults (LANFs; dip angle < 30◦) is a critical issue in fault mechan-ics (Jackson and White, 1989; Buck, 1993; Westaway, 1999; Collettini and Sibson, 2001; Collettini, 2011), and it repre-sents a paradox if the paradigm of faulting in a brittle, elas-tic, homogenous crust holds. Frictional fault reactivation the-ory (Anderson, 1951; Sibson, 1985) predicts that in exten-sional settings the maximum principal stress is vertical and no motion is possible on faults dipping less than 30◦and slid-ing with a friction coefficient (µs)in the range of 0.6–0.85
(Byerlee, 1978). This theory is supported by the evidence that no moderate-to-large magnitude earthquakes have been documented worldwide nucleating on LANFs using posi-tively discriminated slip planes from the focal mechanisms (Jackson and White, 1989; Collettini and Sibson, 2001). On the contrary, observations of large displacements (Lis-ter and Davis, 1989; John and Fos(Lis-ter, 1993; Hayman et al., 2003; Collettini and Holdsworth, 2004; Jolivet et al., 2010; Mirabella et al., 2011) and the well-identified microseismic activity (Chiaraluce et al., 2007; Rietbrock et al., 1996) asso-ciated with these structures suggest that the LANFs are tec-tonically active, accommodating crustal extension and possi-bly formed at low angle. For these reasons, the LANFs can-not be excluded from the assessment of seismic hazard, al-though their inclusion still represents a debated issue.
The LANFs mechanical paradox could be solved if one of the two basic hypotheses of the Anderson’s theory is not veri-fied: that is, if the orientation of the maximum principal stress on the fault plane is not vertical and/or ifµsis much smaller
in-Figure 1. (a)Map of the study area located in the inner sector of the Northern Apennines (see inset at the bottom). Grey points represent the epicentral location (from the catalogue of the INGV national network available at: http://iside.rm.ingv.it/iside/standard/index.jsp) of the earthquakes (M<3.5) that occurred between 1995 and 2010. The beach ball is the mechanism solution of theMw5.1 1984 Gubbio earthquake (Westaway et al., 1989; Collettini et al., 2003). The red lines represent the projection at surface of the Alto Tiberina fault system (after Mirabella et al., 2011). The yellow arrows represent GPS velocities vectors in the last 10 years (Vadacca et al., 2014). Blue line represents the cross section used for the 2-D models.(b)Cross section used for the numerical simulations on the basis of seismic profiles (after Mirabella et al., 2011). The grey points represent the microseismicity in a range of 10 km from the cross section (dashed blue line in
a).
dicate that friction drops to very small values (µs≈0.2) at
high sliding velocity, suggesting that large portions of crustal faults are significantly weak (e.g. San Andreas Fault; Zoback et al., 1987). Moreover, depending on the amount of clay minerals in the fault core, the coefficient of friction may be significantly lower than 0.6 (Saffer et al., 2001; Brown et al., 2003; Collettini et al., 2009a; Lockner et al., 2011). Laboratory experiments on slipping zones rocks sampled on exhumed low-angle normal fault zones (e.g. Zuccale fault, Italy) have shown very low values of sliding friction
The frictional behaviour of faults is commonly modelled in terms of rate- and state-dependent constitutive laws (Di-eterich, 1994) in which friction depends on slip rate, state variables and normal stress. Spatial variations of frictional properties can explain the heterogeneity of crustal faulting and the frictional response to tectonic loading (both perma-nent and transient changes in loading conditions; Boatwright and Cocco, 1996). Velocity weakening and velocity strength-ening frictional regimes are commonly used to identify dy-namic instabilities (i.e. earthquakes) and stable sliding (aseis-mic or creeping), respectively.
Another way to approach the seismic behaviour of ac-tive fault systems is modelling the crustal rheology of the volume containing the active fault segments to explain the deformation observed at surface. Cianetti et al. (2008) per-formed a 2-D plane strain finite element analysis to fit the GPS and geomorphology data to constrain the role and defor-mation mechanisms of the active faults bordering the Gulf of Corinth in Greece undergoing tectonic extension. Cianetti et al. (2008) recognize that only by introducing an elasto-visco-plastic rheology for the crustal volume (defined by a power law constitutive model) can they explain geodetic (GPS) ob-servations. In our modelling, we adopt a simpler approach that relies on an elastic crust. Our assumption is motivated by the presence of a deeper brittle–ductile transition, located at about 15–20 km depth (Pauselli and Federico, 2002), with respect to the one proposed for the Gulf of Corinth (about 5– 10 km depth; Rigo et al., 1996; Harzfeld et al., 2000). For this reason we do not expect a relevant effect of a visco-plastic lower crust on the interseismic deformation processes.
In this paper we integrate geological, seismological and geodetic data with 2-D numerical simulations of faulting to model the state of stress and strain of an active normal fault system located in the Northern Apennines of Italy. The sys-tem is dominated at depth by the presence of a large low-angle normal fault (dip low-angle 15–20◦), named the Alto Tibe-rina fault (ATF; Barchi et al., 1998; Boncio et al., 2000; Fig. 1). The high-resolution 2-D model we use is the one pub-lished by Mirabella et al. (2011) and constrained by geolog-ical and structural cross sections based on the interpretation of seismic profiles, kilometres-deep borehole data and geo-logical observations at the Earth’s surface. We will use and interpret the ongoing deformation inferred from GPS data to understand the tectonic role played by the LANF and to study the effects of the interseismic tectonic loading on the state of stress and deformation of the whole ATF system together with possible strain partitioning and coupling in between the distinct active fault segments.
2 The Alto Tiberina fault system
The investigated fault system is located at the Tuscany– Umbria–Marche regional boundary within the Northern Apennines (Fig. 1a), a NE-verging thrust–fold belt
under-going NE-trending extension at a rate of about 3 mm yr−1
(Serpelloni et al., 2005). The system is composed of a mas-ter≈60 km long and 40 km wide NNW-trending fault plane
dipping at 15–20◦toward ENE called the Alto Tiberina fault (ATF; see fault trace at surface in Fig. 1a). On the ATF hang-ing wall a set of minor syn- and antithetic splay faults sole into the detachment at 4–6 km depth (Fig. 1b). The depth range of the whole fault system is 0–15 km (Fig. 1b). The synthetic and antithetic structures characterized by higher dip angles compared to the ATF have generated small–moderate magnitude earthquakes; the largest one was MW5.1 that
occurred in 1984, currently called the Gubbio earthquake (Fig. 1a; Westaway et al., 1989; Collettini e al., 2003). Sev-eral authors suggest that this seismic event, originally called the Perugia earthquake (Haessler et al., 1988), nucleated on the Gubbio fault plane (GuF; Haessler et al., 1988; Pucci et al., 2003) while Collettini et al. (2003), by interpreting a set of multidisciplinary data, argued against this hypothesis.
Following Chiaraluce et al. (2007), only microseismic events (< 2.3ML) have been located along a 500–1000 m
thick fault zone cross-cutting the upper crust from 4–5 km down to 14–16 km depth and coinciding with the geometry and location of the ATF (Fig. 1b) as derived from geological observations and interpretation of depth-converted seismic reflection profiles (Mirabella et al., 2011). However, in the hanging wall of the ATF the distribution of earthquakes high-lights the presence of higher-angle (40–60◦of dip) synthetic and antithetic minor normal faults (4–5 km long) that sole into the detachment. The seismicity nucleating along the ATF is characterized by a nearly constant rate of earthquake pro-ductionr=7.30e−04earthquakes day−1
×km2 (Chiaraluce
et al., 2009), corresponding to about three events per day withML< 2.3. This seismic activity is cinematically
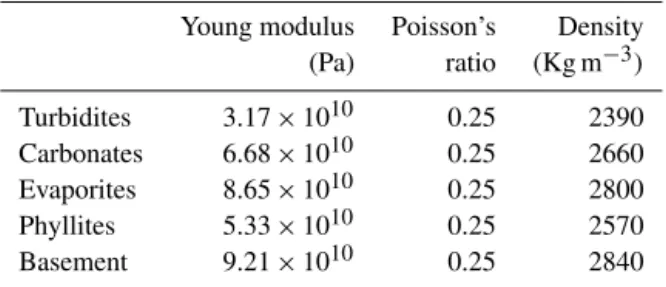
con-Table 1. Adopted parameters for the various rock formations (Pauselli and Federico, 2003; Mirabella et al., 2011).
Young modulus Poisson’s Density (Pa) ratio (Kg m−3)
Turbidites 3.17×10¹⁰ 0.25 2390
Carbonates 6.68×10¹⁰ 0.25 2660
Evaporites 8.65×10¹⁰ 0.25 2800
Phyllites 5.33×10¹⁰ 0.25 2570
Basement 9.21×10¹⁰ 0.25 2840
ditions (0.05 <µs< 0.23; Moore and Lockner, 2008), have
been in fact observed to form interconnected foliated net-works within the Zuccale fault core, resulting in a velocity strengthening behaviour (Smith and Faulkner, 2010; Collet-tini et al., 2009b).
3 Numerical simulations
We perform 2-D finite element numerical simulations with plain-strain approximation by means of the commercial soft-ware COMSOL Multiphysics (http://www.comsol.com/). In order to parameterize the numerical model, we use a NE– SW geological cross section cutting the central part of the ATF system (Fig. 1a), thus considering the whole set of as-sociated fault segments defined by Mirabella et al. (2011; see Fig. 1b).
The mesh consists of approximately 270 000 triangular elements with the finest resolution of 25 m near the fault zones and decreases in resolution down to 2000 m along the boundaries. The crust is characterized entirely by an elastic rheology and we include those layers representing the main lithological units characterized by homogeneous competence (Pauselli and Federico, 2003; Mirabella et al., 2011; Table 1). We prolong the layers in order to avoid boundary effects dur-ing the simulation. Hence in proximity to the boundaries, the layers are kept flat because no information is available about their realistic setting (Fig. 1b).
In order to facilitate the convergence of the solution, the simulations were performed in two subsequent stages. In the initial stage, the model was subject only to the gravity load; this means that no velocity at the boundaries was imposed to simulate extension. In this way, the model compacts under the weight of the rocks and it is brought in a stable equilib-rium with gravity. In this first step, the boundary conditions, applied to all models, are the following: (a) the upper bound-ary of the mesh is free to move in all directions, and (b) the lateral boundaries of the mesh and the bottom are kept fixed in the perpendicular direction. This means that slip parallel to these boundaries is allowed. In the second stage (interseismic phase) we start stretching the model (e.g. crustal extension) for 10 years, applying a constant horizontal velocity of 0.5 and 3.5 mm yr−1 on the SW and NE lateral boundaries,
re-spectively, according to the present-day strain rate and kine-matics of the region (Serpelloni et al., 2005). The stress field resulting from the first stage is defined as uniaxial strain ref-erence frame following Engelder (1993). This state of stress is characterized by vertical stress:
Sv=ρgz, (1)
whereρis the density,gis the gravity acceleration andzis the depth. The horizontal stress can be calculated as follows: SH=
ν
1−ν
Sv, (2)
whereνis Poisson’s ratio. In this way forν=0.25, the verti-cal stress is 3 times larger than the horizontal stress, mimick-ing the extensional tectonic regime of the study area (Mon-tone et al., 2004).
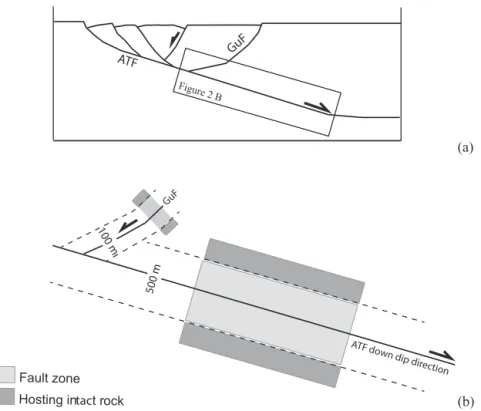
In the simulations the faults (see illustration in Fig. 2a) are defined as 100 m thick shear zones (Fig. 2b). Only the ATF zone is represented by a thickness of 500 m, as pro-posed by Chiaraluce et al. (2007). The weaker rheology of the fault zones is modelled by considering a variation of the elastic properties with respect to the hosting intact rocks (e.g. Gudmundsson, 2004; Faulkner et al., 2006). In this way, when a fault is considered locked the Young modulus of the corresponding fault zone is set to 10 GPa (Fig. 2b), mean-ing that the deformation associated with that structure will depend mainly on the intensively fractured rocks typically, for instance, of the damage zone. Otherwise, when creeping faults are considered, the Young modulus of the correspond-ing fault zone is reduced by 3 orders of magnitude lower than the intact rocks (0.01 GPa, see Fig. 3). In this case the deformation associated with the causative fault will depend mainly on the creeping layer and on minor contributions from the damage zone. This abrupt mechanical contrast be-tween the fault zones and the surrounding intact rocks along the hanging wall and footwall blocks simulates a slip similar to those observed when creep motion is modelled along fault planes. However, the adoption of the creeping fault equiva-lent method results in reaching more easily a numerical con-vergence in solving the problem and a reduction of the com-putational costs.
Figure 2 B
ATF GuF
ATF do wn dip dir
ection
500 m GuF
100 m
Fault zone
Hosting intact rock
A
B
(a)
(b)
Figure 2. (a) Illustration of the ATF system highlighting the ATF and GuF fault segments. Rectangle showing the zoomed area of(b).
(b) Sketch of the ATF and GuF faults zones where different fault mechanical behaviours are modelled using different Young modulus parameters and fault zone thickness (see text for details).
the understanding of the physics of earthquakes and faulting (Chiaraluce et al., 2014). To retrieve the 2-D displacement profile we use 11 GPS stations whose distance from the cross section is less than 10 km (from SW to Ne they are SIO1, REPI, CSSB, VALC, UMBE, ATLO, MVAL, PIET, ATFO, ATBU, FOSS; Fig. 1a).
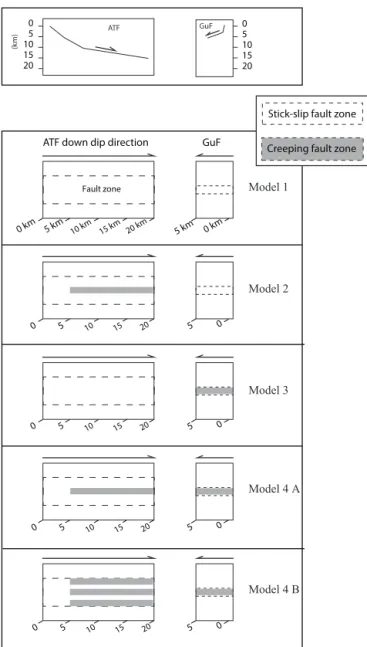
Thus, in order to quantify the interseismic stress build-up in the last 10 years we compute the Von Mises stress, a parameter that expresses the difference between the princi-pal components of stress giving indication of the amount of shearing (e.g. Pauselli and Federico, 2003), and four different types of simulations have been performed (see Fig. 3). In the first model all faults are considered locked (Model 1). In the second model (Model 2), creeping is simulated only along the ATF considering a (5 km) locking depth we derived from our tests (see next paragraph).In the third model (Model 3), we simulate creeping only along the GuF, whereas the ATF is considered locked. However, in the fourth model (Model 4A) creeping behaviour is simulated both along the ATF and GuF. This last model has been further complicated by considering within the ATF fault zone a set of multi-creeping layers, as proposed by Chiaraluce et al. (2014).
3.1 Fault segment locking depth
In this section we discuss the effects of assuming different locking depths, identifying the depth at which creeping
ATF down dip direction GuF
0 km 5 km 10 km 15 km 20 km 5 km 0 km Fault zone
0 5 10 15 20 5 0
0 5 10 15 20
(k
m)
Model 1
Model 2
Model 3
Model 4 A
Model 4 B 0
5 10 15 20
0 5 10 15 20
0 5 10 15 20
0 5 10 15 20
5 0
5 0
5 0
ATF GuF
Stick-slip fault zone
Creeping fault zone
Figure 3.The different model configurations used to compute the
interseismic stress build-up. First line: schematic sketch of the ATF (left column) and GuF fault zone (right column). The dashed ar-eas represent the ATF and GuF zones. The creeping deformation is modelled in the grey layers.
the ATF plane basically starting from the same 5 km depth (Chiaraluce et al., 2007) and the model resulting from re-gional geodetic data by Hreinsdottir and Bennett (2009). In this best model we cannot exclude the creeping deformation characterizing also a portion of the Gubbio fault. For this rea-son, this model configuration will be analysed more in detail in the next section.
3.2 Modelling results
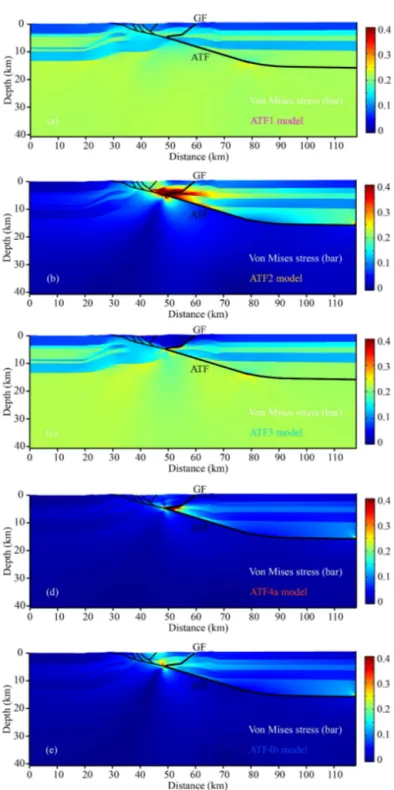
Figure 5 shows the interseismic stress build-up for all the tested models represented in terms of Von Mises stress
pat-terns. We observe that, when no creeping is included in the simulations (like in Model 1 of Fig. 3), the response of the medium to the imposed interseismic tectonic extension is completely controlled by the adopted lithology. In other words, the stress build-up is basically controlled by the me-chanical contrast of the different lithology and the geometry of the fault system (Fig. 5a), according to the results obtained by Pauselli and Federico (2003) for the same area.
When creeping is simulated along the ATF, starting from 5 km depth like in Model 2, the pattern of the stress build-up changes completely. Stress is mainly localized around 5 km depth and in the ATF hanging wall (Fig. 5b). This model also predicts a large stress accumulation along the deepest (3– 5 km) portion of the GuF and low values of stress for the ATF footwall block where currently we observe a lack of seismic activity (see Fig. 1b). This deeper sector of the GuF shows a quite flat geometry contrary to its shallower portion where it is at high angle. Our model resolution does not allow separat-ing the contribution of these two different fault portions even if, because of its flat attitude, the deepest segment is the one being more efficient. Coherently with this we observe that when we simulate creeping only along the GuF (Model 3), we observe that the stress pattern (see Fig. 5c) is of course very similar to the reference model when no creeping is as-sumed (Model 1) because of the fault size. At the same time, we note that the main differences are observed around 5 km depth where on the GuF hanging wall (Gubbio basin) the values of stress decrease due to the continuous sliding along the fault. Moreover, higher values of stress are concentrated where the GuF changes the dip from lowest (3–5 km depth) to highest (0–3 km) dip values because of the higher slip rate of the shallow fault portion.
The combined effect of creeping along ATF and GuF is fi-nally simulated through Model 4A and is shown in Fig. 5d. Here we observe a wedge of higher values of stress located between the ATF hanging wall and the GuF footwall in prox-imity to the assumed locking depth (5 km). This model pre-dicts stress accumulation in the footwall of the GuF where microseismicity is currently observed (Valoroso et al., 2014). The last model differs from the previous one for the presence along the ATF creeping sector of a fault zone composed of a multi-layer including alternate creeping and stick-slip layers (Model 4B in Fig. 3). The interseismic stress build-up de-creases with respect to previous models, and stress accumu-lation is mainly located at the intersection between the ATF and the GuF (Fig. 5e).
Figure 5 provides a clear picture of the role played by the ATF presumably creeping along its deepest portion. At the same time, we observe signatures of tectonic coupling be-tween the ATF and the GuF antithetic fault in a context where the ATF is clearly dominating the mechanical behaviour of the whole system.
respec-Distance (km)
Horizontal velocity (mm yr )
0 1 2 3 4
0 10 20 30 40 50 60 70 80 90 100 110 120 130
0
10
20
30
40
0 10 20 30 40 50 60 70 80 90 100 110 120 130
Distance (km)
Depth (km)
ATF
1 2 3 4 5 (GF)
ATF locking depth
(b) (a)
GPS data Model a Model b Model c Model d Model e
–1
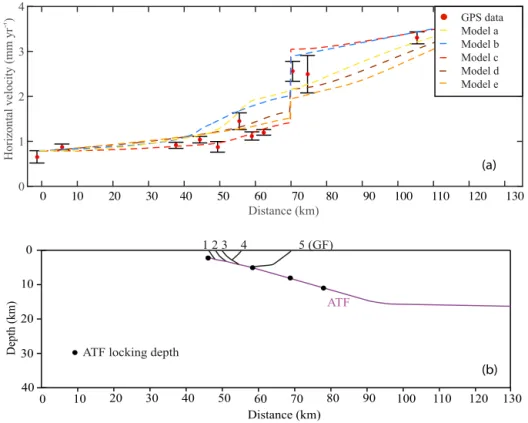
Figure 4.Horizontal velocity trend for different models obtained after the scouting of the ATF locking depth effects and creeping simulated
on different synthetic and antithetic faults (see Sect. 4 for details). In the ATFa model, we considered an ATF locking depth of 5 km, whereas the other faults are locked. In the ATFb and ATFc models we considered an ATF locking depth of 2 and 5 km respectively, and only the Gubbio fault is creeping. Finally, in the ATFd and ATFe models, we considered an ATF locking depth of 8 and 11 km respectively, and all the other faults are creeping. We calculate the weighted root mean squares (WRMS) in order to compare the results obtained from the numerical simulations with the GPS velocity observed: WRMSModel a=0.30; WRMSModel b=0.37; WRMSModel c=0.19; WRMSModel d=0.21; WRMSModel e=0.23. The best fit is obtained for Model c.
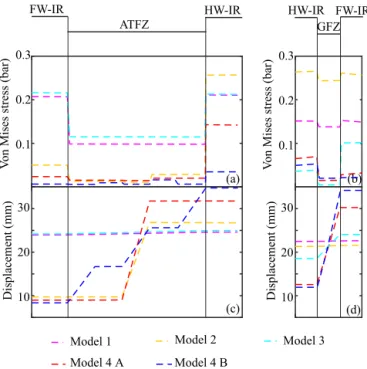
tively, at 9 and 3 km depth. When no creeping is simulated (Model 1; pink dashed line in Fig. 6), the same stress thresh-old is reached on the hanging wall and footwall rocks both across the ATF (Fig. 6a) and GuF (Fig. 6b) zones. The Von Mises stress decreases into the fault zones due to the ef-fects of more compliant elastic properties than the surround-ing hangsurround-ing wall (HW-IR in Fig. 6) and footwall (FW-IR in Fig. 6) blocks composed of intact rocks. No slip is gener-ated across the fault zones because the faults are considered locked (Model 1 in Fig. 6c and d). Otherwise, when creep-ing is simulated only along the ATF (Model 2; yellow dashed line in Fig. 6), the interseismic stress build-up decreases on the footwall rocks and into the fault zone but increase on the hanging wall rocks (Fig. 6a). The stable sliding along the ATF generates slip rates of 1.5 mm yr−1, thus resulting
in a cumulative displacement that goes from 10 to 25 mm (Fig. 6c). Even if the GuF is kept locked, the creeping sim-ulated along the ATF affects the interseismic stress build-up on this structure. The stress tendency across the GuF is the same as observed in Model 1, but the threshold is shifted to-wards higher values (Fig. 6b). Even in this case no slip is generated along the GuF considered locked (Fig. 6d). When
creeping is simulated only along GuF (Model 3; light blue in Fig. 6), the trend of stress and displacement across the ATF is similar to that obtained for Model 1, but the inter-seismic stress build-up drops below values of 0.1 bar with higher values observed on the footwall with respect to the hanging wall block (Fig. 6b). It is notable that in this case higher values of stress are located on the GuF footwall block, while in Model 2, where only ATF was considered creeping, higher values of stress were detected on the ATF hanging wall block. This underlines that creeping faults can transfer tectonic stress in the hanging wall or footwall blocks only de-pending by their orientation. Slip rates along the GuF reach 0.5 mm yr−1(Fig. 6d). When the ATF and the GuF are both
considered creeping (Model 4A; red dashed line in Fig. 6) the stress threshold decreases across both the fault zones (Fig. 6a and b). In this case higher values of stress are detected in the GuF hanging wall block with respect to the footwall (Fig. 6b) due to the stable sliding motion along ATF loading the GuF hanging wall. Slip rates along the ATF and the GuF reach values of 2.2 and 1.5 mm yr−1respectively (Fig. 6c and d).
interseis-Figure 5.2-D cross sections of the Von Mises stress distribution derived from the different models.
mic stress build-up across the fault zone sharply decreases in both the fault zones (Fig. 6a and b) with higher values on the hanging wall than the footwall block. Into the ATF fault zone, different layers are detected with high and low values of stress as a consequence of the alternation of creeping and stick-slip layers (Fig. 6a). This effect is evident also by the displacement behaviour across the ATF fault zone (Fig. 6c).
The slip rates calculated increase to 2.8 and 2 mm yr−1 for
ATF and GuF respectively.
FW-IR HW-IR ATFZ
HW-IR FW-IR GFZ
Displacement (mm)
30
20
10 Displacement (mm)
30
20
10
V
on Mises stress (bar)
0.3
0.2
0.1
V
on Mises stress (bar)
0.3
0.2
0.1
(a)
(c)
(b)
(d)
Model 1 Model 2 Model 3
Model 4 A Model 4 B
Figure 6.Trend of the Von Mises stress and cumulative
displace-ment across the ATF(a–c)and GuF(b–d)fault zones after 10 years of tectonic extension and for the different adopted model settings. The cross sections cut the fault zones at 9 km depth for ATF and 3 km depth for GuF. FW-IR: footwall intact rocks; HW-IR: hanging wall intact rocks. The thick grey lines define the ATF and GuF fault zones.
Table 2.Weighted root mean square (WRMS) calculations for
dif-ferent models. In Model 1 all faults are locked; in Model 2 creeping is simulated only along the ATF considering a (5 km) locking depth; in Model 3 creeping is simulated only along the GuF, whereas the ATF is considered locked; in Model 4A creeping behaviour is sim-ulated both along the ATF and GuF and finally in Model 4B multi-creeping layers are simulated in the ATF zone. The best fit is ob-tained for Model 4A.
Model Model 1 Model 2 Model 3 Model 4A Model 4B
WRMS 0.85 0.30 0.53 0.19 0.20
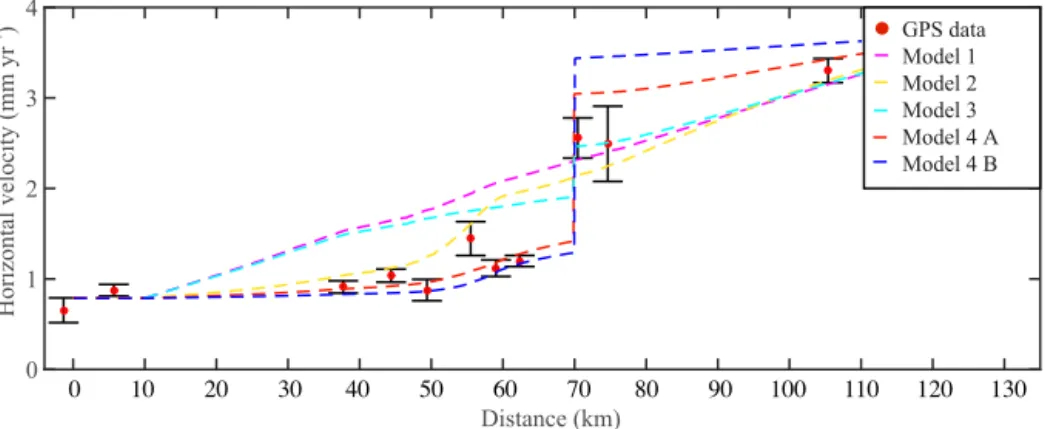
not show any relevant strain localization, contrarily to what the data suggest. Worthy of note, all the other three mod-els (Model 2, 4A and 4B) predict strain localization coher-ently with the observations. The best fitting model is formally Model 4A (WRMS=0.19) displaying a well-defined veloc-ity jump in a proximveloc-ity of 70 km to the cross section coher-ently with the observed GPS velocity. The effect of multi-creeping layers into the ATF zone (Model 4B) is increasing the velocity jump in the central part of the cross section, al-though the calculated misfit (0.20) is very similar to that of Model 4A.
4 Discussion
The results of the 2-D simulations performed in this study have important implications for the role played by the ATF in accommodating the tectonic extension in this sector of the Northern Apennines. The first main outcome is that, in an elastic crust, the GPS observations cannot be explained with-out considering the ATF contribution to deformation, indi-cating that this fault, although misoriented, has to be consid-ered tectonically active. Our findings also indicate the need for creeping behaviour along the ATF below 5 km depth, in agreement with the outcomes of Anderlini et al. (2016). Our simulations show that using only the ATF does not exhaus-tively explain the GPS data, deserving the contribution of at least another active segment located in the ATF hanging wall volume such as the Gubbio fault (Fig. 7). In addition, the best fit of the GPS velocity data is obtained considering some degree of creeping along a portion of the GuF. The me-chanical behaviour of the west-dipping GuF is still debated in the literature (Boncio et al., 2000; Mirabella et al., 2004, 2008; Barchi and Ciaccio, 2009). It is considered a seismo-genic fault in active fault databases (DISS Working Group Database of Individual Seismogenic Sources, version 3.1.0, a compilation of potential sources for earthquakes larger than MW5.5 in Italy and surrounding areas, available at
http://diss.rm.ingv.it/diss), and the last moderate-magnitude event (Mw5.1; Westaway et al., 1989) that occurred in 1984 in the area (namely, the Gubbio earthquake) occurred a few kilometres apart (see location in Fig. 1a). According to Col-lettini et al. (2003), the main shock has nucleated on a dif-ferent fault (see location in the map of Fig. 1a). However, the spatial pattern of the microseismic activity of the Gub-bio area is quite complex and it does not allow the identifi-cation of the GuF as a locked active structure (Chiaraluce et al., 2007; Valoroso et al., 2014). We rely on the inter-pretation of the mechanical behaviour of the Gubbio fault as a mixed mode seismic/aseismic characterized by a rele-vant creeping component during the interseismic phase of the seismic cycle for both geometrical (flat attitude in the deeper portion and high-angle toward the surface) and me-chanical reasons (Finocchio et al., 2013). Our results are in agreement with the outcome of recent friction laboratory ex-periments performed on outcrop rocks samples collected in fault cores of structures located in this sector of the North-ern Apennines, showing the presence of layers with coupled velocity-strengthening–velocity-weakening behaviour (Tesei et al., 2014).
Distance (km)
GPS data Model 1 Model 2 Model 3 Model 4 A Model 4 B
Horizontal velocity (mm yr )
0 1 2 3 4
0 10 20 30 40 50 60 70 80 90 100 110 120 130
–1
Figure 7.Horizontal velocity trend obtained for the different model settings. We calculate the weighted root mean squares (WRMS) in order
to compare the results obtained from the numerical simulations with the GPS velocity observed. The best fit is obtained for Model 4A (see Table 2).
of a moderate-to-large magnitude earthquake nucleating at shallow depth within the locked portion of the ATF.
Model 4A (fault zone with one creeping layer) and Model 4B (fault zone with multi-creeping layers) present very similar values of weighted root mean squares (Fig. 7). Complex fault zones with multiple strands are widely doc-umented in strike slip regimes (e.g. Carboneras fault in southeastern Spain). These large fault zones present a dis-tributed deformation over several metres of multiple active phyllosilicate-rich fault gouges whose derived mechanical behaviour is a prevalent creeping with small repeating earth-quakes (Faulkner et al., 2003, 2008). However, for low-angle normal faults there are worldwide examples of fault zones possessing both single- and multi-fault cores (Collet-tini, 2011). The same mixed style is also reported for Apen-nine LANFs where extensional duplexes are observed on seismic reflection profiles (Barchi et al., 1998), and a single and continuous core is observed along the exhumed portion of the Zuccale fault (Smith et al., 2011). This natural com-plexity of the structural setting makes it difficult to favour one single model result for the ATF system.
The results of this study are preparatory for a 3-D mod-elling of the Alto Tiberina fault system in which the lateral variations of frictional properties (Boatwright and Cocco, 1996) can be modelled to explain the observed seismicity pattern. Notwithstanding, the outcomes of these 2-D simula-tions contain original and definitive indicasimula-tions for an active LANF as well as for a tectonic coupling between the two ma-jor structures of this fault system. This tectonic coupling gen-erates a negligible stress accumulation in the ATF footwall, coherently with the lack of seismic activity, and a redistri-bution of the stress build-up consistent with the high rate of microseismicity occurrence in ATF hanging wall volume, in-cluding the footwall of the GuF (Chiaraluce et al., 2007; Fig. 1b) Thus, our work shows that the ATF plays an active role in the deformation processes of the region and that the interpre-tation of our results cannot exclude the occurrence of
damag-ing earthquakes along the ATF fault system. These main out-comes obtained with a simple elastic modelling are in agree-ment with the results of Anderlini et al. (2016), suggesting the existence of shallow and locked portions of the ATF po-tentially corresponding to a large earthquake (Mw6.7), even
if such large events are not present in the historical seismic catalogue for this area.
5 Conclusions
In this work we integrate the results of 2-D numerical models with geological, seismological and geodetic observations in order to understand some of the key features on the mechan-ical behaviour of the Alto Tiberina fault and its associated fault system. Our results show the following:
– The tectonic loading of this sector of the Apennine chain is mainly accommodated by an active LANF (the Alto Tiberina fault).
– Such a LANF is creeping from about 5 km depth. – Although the deformation caused by creeping along the
Alto Tiberina fault is a first-order condition to explain the strain concentration revealed by GPS data, a tecton-ically coupled model is needed to explain observations, thus including a contribution of a partially creeping an-tithetic fault (the Gubbio fault).
– The stress redistribution within the fault system caused by creeping on both the ATF and GuF together with the presence of heterogeneous frictional properties on the ATF fault zone volume can explain the observed micro-seismicity pattern and the lack of moderate earthquakes in the last 1000 years nucleating on this fault.
This mechanism could explain the microseismic activity de-tected all along the ATF fault plane and within the ATF hang-ing wall. However, our results cannot exclude the occurrence of moderate-to-large magnitude earthquakes nucleating on shallow-locked portions of the ATF.
Finally, a relatively simple elastic model can explain GPS interseismic observations. Although this does not exclude the effect of more complex rheology, it suggests that the mechan-ical coupling plays a relevant role in explaining strain parti-tioning in the shallow crust of this sector of the Northern Apennines.
6 Data availability
The GPS data used for model calibration are available from Anderlini et al. (2016), whereas the geometry used for the nu-merical simulations is available from Mirabella et al. (2011).
Acknowledgements. We thank the topical editor, Federico Rossetti, as well as Rick Bennett, Pascal Bernard and an anonymous reviewer for the constructive comments that have greatly improved this paper. Spina Cianetti and Francesco Mirabella are thanked for scientific discussions on the numerical models and Umbria–Marche structural geology respectively. Enrico Serpelloni is thanked for GPS velocity data.
Edited by: F. Rossetti
Reviewed by: P. Bernard, R. Bennett, and one anonymous referee
References
Anderlini, L., Serpelloni, E., and Belardinelli, M. E.: Creep and locking of a low-angle normal fault: Insights from the Altotibe-rina fault in the Northern Apennines (Italy), Geophys. Res. Lett., 43, 4321–4329, 2016.
Anderson, E. M.: The Dynamics of Faulting, 2nd edition, Oliver and Boyd, Edinburgh, p. 206, 1951.
Barchi, M. R. and Ciaccio, M. G.: Seismic images of an extensional basin, generated at the hangingwall of a low-angle normal fault: the case of the Sansepolcro basin (Central Italy), Tectonophysics, 479, 285–293, 2009.
Barchi, M. R., De Feyter, A., Magnani, M., Minelli, G., Pialli G., and Sotera, B. M.: Extensional tectonics in the Northern Apen-nines (Italy): evidence from the CROP03 deep seismic reflection line, Mem. Soc. Geol. It., 52, 528–538, 1998.
Boatwright, J. and Cocco, M.: Frictional constraints on crustal fault-ing, J. Geophys. Res., 101, 895–909, 1996.
Boncio, P., Brozzetti, F., and Lavecchia, G.: Architecture and seis-motectonics of a regional low-angle normal fault zone in central Italy, Tectonics, 19, 1038–1055, 2000.
Brown, K. M., Kopf, A., Underwood, M. B., and Weinberger, J. L.: Compositional and fluid pressure controls on the state of stress on the Nankai subduction thrust: a weak plate boundary, Earth Planet Sc. Lett., 214, 589–603, 2003.
Buck, W. R.: Effect of Lithospheric Thickness on the Formation of High-Angle and Low-Angle Normal Faults, Geology, 21, 933– 936, 1993.
Byerlee, J. D.: Friction of rocks, Pure Appl. Geophys., 116, 615– 626, 1978.
Chiaraluce, L., Chiarabba, C., Collettini, C., Piccinini, D., and Cocco, M.: Architecture and mechanics of an active low-angle normal fault: Alto Tiberina Fault, northern Apennines, Italy, J. Geophys. Res., 112, B10310, doi:10.1029/2007JB005015, 2007. Chiaraluce, L., Valoroso, L., Anselmi, M., Bagh, S., and Chiarabba, C.: A decade of passive seismic monitoring experiments with lo-cal networks in four Italian regions, Tectonophysics, 476, 85–98, 2009.
Chiaraluce, L., Amato, A., Carannante, S., Castelli, S., Cattaneo, M., Cocco, M., Collettini, C., D’Alema, E., Di Stefano, R., Latorre, D., Marzorati, S., Mirabella, F., Monachesi, G., Pic-cinini, D., Nardi, A., Piersanti, A., Stramondo S., and Valoroso, L.: The Alto Tiberina Near Fault Observatory (northern Apen-nines, Italy), Ann. Geophys.-Italy, 57, S0327, doi:10.4401/ag-6426, 2014.
Cianetti, S., Tinti, E., Giunchi, C., and Cocco, M.: Modeling de-formation rates in the Western Gulf of Corinth: rheological con-straints, Geophys. J. Int., 174, 749–757, 2008.
Collettini, C.: The mechanical paradox of low angle normal faults: current understanding and open questions, Tectonophysics, 510, 253–268, 2011.
Collettini, C. and Holdsworth, R. E.: Fault zone weakening pro-cesses along low-angle normal faults: insights from the Zuccale Fault, Isle of Elba, Italy, J. Geol. Soc. London, 161, 1039–1051, 2004.
Collettini, C. and Sibson, R. H.: Normal faults normal friction?, Geology, 29, 927–930, 2001.
Collettini, C., Barchi, M. R., Chiaraluce, L., Mirabella F., and Pucci, S.: The Gubbio fault: can different methods give pictures of the same object?, J. Geodyn., 36, 51–66, 2003.
Collettini, C., Niemeijer, A., Viti, C., and Marone, C. J.: Fault zone fabric and fault weakness, Nature, 462, 907–910, 2009a. Collettini, C., Viti, C., Smith, S. F. A., and Holdsworth, R. E.:
The development of interconnected talc networks and weakening of continental low-angle normal faults, Geology, 37, 567–570, 2009b.
D’Agostino, N., Mantenuto, S., D’Anastasio, E., Avallone, A., Barchi, M., Collettini, C., Radicioni, F., Stoppini, A., and Fastellini, G.: Contemporary crustal extension in the Umbria– Marche Apennines from regional CGPS networks and compari-son between geodetic and seismic deformation, Tectonophysics, 476, 3–12, 2009.
Dieterich, J. H.: A constitutive law for rate of earthquake production and its application to earthquake clustering, J. Geophys. Res., 99, 2601–2618, 1994.
Engelder, T.: Stress Regimes in the Lithosphere, Princeton Univ. Press, Princeton, NJ, 475, 486 pp., 1993.
Faulkner, D. R., Lewis, A. C., and Rutter, E. H.: On the in-ternal structure and mechanics of large strike-slip fault zones: field observations of the Carboneras fault in southeastem Spain, Tectonophysics, 367, 235–251, 2003.
Faulkner, D. R., Mitchell, T. M., Rutter, E. H., and Cembrano, J.: On the structure and mechanical properties of large strike-slip faults, in: Structure of Fault Zones: Implications for Mechanical and Fluid-flow Properties, edited by: Wibberley, C. A. J., Kurz, W., Imber, J., Holdsworth., R. E., and Collettini, C., Geol. Soc. London Spec. Publ., 299, 139–150, 2008.
Finocchio, D., Barba, S., Santini, S., and Megna, A.: Interpreting the interseismic deformation of the Altotiberina Fault (central Italy) through 2-D modelling, Ann. Geophys.-Italy, 56, S0673, doi:10.4401/ag-5806, 2013.
Gudmundsson, A.: Effects of Young’s modulus on fault displace-ment, C. R. Geosci., 336, 85–92, 2004.
Haessler, H., Gaulon, R., Rivera, L., Console, R., Frogneux, M., Gasparini, C., Martel, L., Patau, G., Siciliano, M., and Cister-nas, A.: The Perugia (Italy) earthquake of 29 April 1984: a mi-croearthquake survey, B. Seismol. Soc. Am., 78, 1948–1964, 1988.
Harzfeld, D., Karakostas, V., Ziazia, M., Kassaras, I., Papadim-itriou, E., Makropoulos, K., Voulgaris, N., and Papaioannou, C.: Microseismicity and faulting geometry in the Gulf of Corinth (Greece), Geophys. J. Int., 141, 438–456, 2000.
Hayman, N. W., Knott, J. R., Cowan, D. S., Nemser, E., and Sarna-Wojcicki, A.: Quaternary low-angle slip on detachment faults in Death Valley, California, Geology, 31, 343–346, 2003.
Hreinsdottir, S. and Bennett, R. A.: Active aseismic creep on the Alto Tiberina low-angle normal fault, Italy, Geology, 37, 683– 686, 2009.
Jackson, J. A. and White, N. J.: Normal faulting in the upper con-tinental crust: observations from regions of active extension, J. Struct. Geol., 11, 15–36, 1989.
John, B. E. and Foster, D. A.: Structural and thermal constraints on the initiation angle of detachment faulting in the southern Basin and Range: the Chemehuevi Mountains case study, Geol. Soc. Am. Bull., 105, 1091–1108, 1993.
Jolivet, L., Lecomte, E., Huet, B., Deneèle, Y., Lacombe, O., Labrousse, L., Le Pourhiet, L., and Mehl, C.: The North Cycladic detachment system, Earth Planet Sc. Lett., 289, 87–104, 2010. Lister, G. S. and Davis, G. A.: The origin of metamorphic core
com-plexes and detachment faults formed during Tertiary continental extension in the northern Colorado River region, USA, J. Struct. Geol., 11, 65–94, 1989.
Lockner, D. A., Morrow C., Moore D., and Hickman S.: Low strength of deep San Andreas fault gouge from SAFOD core, Nature, 472, 82–85, 2011.
Mirabella, F., Ciaccio M. G., Barchi M., and Merlini S.: The Gub-bio fault (Central Italy): geometry, displacement distribution and tectonic evolution, J. Struct. Geol., 26, 2233–2249, 2004. Mirabella, F., Barchi M. R., Lupattelli A., Stucchi E., and
Ciac-cio M. G.: Insights on the seismogenic layer thickness from the upper crust structure of the Umbria-Marche Apennines (Cen-tral Italy), Tectonics, 27, TC1010, doi:10.1029/2007TC002134, 2008.
Mirabella, F., Brozzetti, F., Lupattelli, A., and Barchi, M. R.: Tec-tonic evolution of a low angle extensional fault system from re-stored cross sections in the northern Apennines (Italy), Tectonics, 30, TC6002, doi:10.1029/2011TC002890, 2011.
Moore, D. E. and Lockner, D. A.: Talc friction in the temperature range 25◦–400◦C: relevance for fault-zone weakening, Tectono-physics, 449, 120–132, 2008.
Pauselli, C. and Federico, C.: The brittle/ductile transition along the Crop03 profile: relationship with the geological features, Atti del Convegno “Evoluzione geologica e Geodinamica dell’Appenino”, Boll. Soc. Geol. It., 1, 25–35, 2002.
Pauselli, C. and Federico, C.: Elastic modeling of the Alto Tiberina normal fault (central Italy): Geometry and lithological stratifi-cation influences on the local stress field, Tectonophysics, 374, 99–113, 2003.
Pucci, S., De Martini, P. M., Pantosti, D., and Valensise, G.: Ge-omorphology of the Gubbio Basin (Central Italy): understand-ing the active tectonics and earthquake potential, Ann. Geophys.-Italy, 46, 837–864, doi:10.4401/ag-3458, 2003.
Rietbrock, A., Tiberi, C., Scherbaum, F., and Lyon-Caen, H.: Seis-mic slip on a low-angle normal fault in the Gulf of Corinth: evi-dence from high-resolution cluster analysis of microearthquakes, Geophys. Res. Lett., 23, 1817–1820, 1996.
Rigo, A., Lyon-Caen, H., Armijo, R., Deshamps, A., Harzfeld, D., Makropoulos, K., Papadimitriou, P., and Kassaras, I.: A micro-seismic study in the western part of the Gulf of Corinth (Greece): implications for large-scale normal faulting mechanisms, Geo-phys. J. Int., 126, 663–688, 1996.
Rovida, A., Camassi, R., Gasperini, P., and Stucchi, M.: CPTI11, the 2011 version of the Parametric Catalogue of Italian Earthquakes, Milano, Bologna, http://emidius.mi.ingv.it/CPTI, doi:10.6092/INGV.IT-CPTI11, 2011.
Saffer, D. M. and Marone, C.: Comparison of smectite and illite frictional properties: application to the updip limit of the seismo-genic zone along subduction megathrusts, Earth Planet Sc. Lett., 215, 219–235, 2003.
Serpelloni, E., Anzidei, M., Baldi, P., Casula, G., and Galvani, A.: Crustal velocity and strain-rate fields in Italy and surrounding regions: New results from the analysis of permanent and non-permanent GPS networks, Geophys. J. Int., 161, 861–880, 2005. Sibson, R. H.: A note on fault reactivation, J. Struct. Geol., 7, 751–
754, 1985.
Smith, S. A. F. and Faulkner, D. R.: Laboratory measurements of the frictional strength of a natural low-angle normal fault, J. Geo-phys. Res., 115, B02407, doi:10.1029/2008JB006274, 2010. Smith, S. A. F., Holdsworth, R. E., Collettini, C., and Pearce, M.
A.: The microstructural character and mechanical significance of fault rocks associated with a continental low-angle normal fault: The Zuccale Fault, Elba Island, Italy, Geol. Soc. Lond. Spec. Publ., 359, 97–113, 2011.
Tesei, T., Collettini, C., Barchi, M. R., Carpenter, B. M., and Di Stefano, G.: Heterogeneous strength and fault zone complexity of carbonate-bearing thrusts with possible implications for seis-micity, Earth Planet Sc. Lett., 408, 307–318, 2014.
Vadacca, L.: Numerical modeling of the Alto Tiberina low angle normal fault, Ph.D. thesis, Alma Mater Studiorum Università di Bologna, Italy, 91 pp., 2014.
Tibe-rina Fault (Northern Apennines, Italy), AGU Fall Meeting Ab-stracts, 2014.
Westaway, R.: The mechanical feasibility of low-angle normal fault-ing, Tectonophysics, 308, 407–443, 1999.
Westaway, R., Gawthorpe, R., and Tozzi, M.: Seismological and field observations of the 1984 Lazio-Abruzzo earthquakes: im-plications for the active tectonics of Italy, Geophys. J. Int., 98, 489–514, 1989.