ACPD
5, 12373–12401, 2005Simulation of the vertical structure of N2O, NO2 and HNO3
G. Berthet et al.
Title Page
Abstract Introduction
Conclusions References
Tables Figures
◭ ◮
◭ ◮
Back Close
Full Screen / Esc
Print Version
Interactive Discussion
EGU
Atmos. Chem. Phys. Discuss., 5, 12373–12401, 2005 www.atmos-chem-phys.org/acpd/5/12373/
SRef-ID: 1680-7375/acpd/2005-5-12373 European Geosciences Union
Atmospheric Chemistry and Physics Discussions
On the ability of chemical transport
models to simulate the vertical structure
of the N
2
O, NO
2
and HNO
3
species in the
mid-latitude stratosphere
G. Berthet1,2, N. Huret2, F. Lef `evre1, G. Moreau2, C. Robert2, M. Chartier2, L. Pomathiod2, M. Pirre2, and V. Catoire2
1
Service d’A ´eronomie, Institut Pierre-Simon Laplace, F-75252 Paris, France 2
Laboratoire de Physique et Chimie de l’Environnement, F-45071 Orl ´eans, France Received: 19 April 2005 – Accepted: 28 June 2005 – Published: 28 November 2005 Correspondence to: G. Berthet ([email protected])
ACPD
5, 12373–12401, 2005Simulation of the vertical structure of N2O, NO2 and HNO3
G. Berthet et al.
Title Page
Abstract Introduction
Conclusions References
Tables Figures
◭ ◮
◭ ◮
Back Close
Full Screen / Esc
Print Version
Interactive Discussion
EGU
Abstract
In this paper we study the impact of the modelling of N2O on the simulation of NO2and
HNO3by comparing in situ vertical profiles measured at mid-latitudes with the results
of the Reprobus 3-D CTM (Three-dimensional Chemical Transport Model) computed with the kinetic parameters from the JPL recommendation in 2002. The analysis of the
5
measured in situ profile of N2O shows particular features indicating different air mass
origins. The measured N2O, NO2 and HNO3 profiles are not satisfyingly reproduced by the CTM when computed using the current 6-hourly ECMWF operational analysis. Improving the simulation of N2O transport allows us to calculate quantities of NO2and
HNO3 in reasonable agreement with observations. This is achieved using 3-hourly
10
winds obtained from ECMWF forecasts. The best agreement is obtained by constrain-ing a one-dimensional version of the model with the observed N2O. This study shows
that modelling the NOy partitioning with better accuracy relies at least on a correct
simulation of N2O and thus of total NOy.
1. Introduction
15
The partitioning of individual nitrogen species within reactive nitrogen family (NOy) is a very important factor in the stratospheric chemistry of ozone. The photolysis and the photo-oxidation of N2O is the main source of NOyspecies in the stratosphere:
N2O+hv →N2+O(1D) (1)
N2O+O(1D) →N2+O2 (2a) 20
→2NO (2b)
Reaction (2b) is the dominant path for the production of NOxspecies (e.g. McElroy and
ACPD
5, 12373–12401, 2005Simulation of the vertical structure of N2O, NO2 and HNO3
G. Berthet et al.
Title Page
Abstract Introduction
Conclusions References
Tables Figures
◭ ◮
◭ ◮
Back Close
Full Screen / Esc
Print Version
Interactive Discussion
EGU
are involved in the main processes controlling the ozone budget. They both account for a major part of ozone reduction in the middle and upper stratosphere through rapid catalytic cycles (e.g. McElroy et al., 1992; Osterman et al., 1997; Br ¨uhl et al., 1998) and moderate the ozone-destroying catalytic cycles involving halogen and hydrogen radicals (e.g. Salawitch et al., 1994; Wennberg et al., 1994). NOxare chemically linked
5
to nitric acid HNO3 which is the main reservoir of the NOy family below ∼30 km and
are primarily produced by photolysis of HNO3. The partitioning of NOy species, and
in particular NO2and HNO3, is also affected by heterogeneous reactions on sulphate aerosols that convert active nitrogen to HNO3 (e.g. McElroy et al., 1992; Fahey et al.,
1993).
10
Nevertheless the quantitative understanding of the partitioning of the NOy species in the models remains limited. Several studies have shown significant discrepancies between computed and observed partitioning of NOy species depending on the
loca-tion (mid- or high latitudes) and time (day or night, period of the year) (e.g. Sen et al., 1998; Gao et al., 1999; Payan et al., 1999; Wetzel et al., 2002; Stowasser et al., 2002,
15
2003). Observations of the various NOyspecies such as HNO3 and NO2are not
sat-isfyingly reproduced by chemistry-transport models at mid-latitudes with in particular recurrent underestimations of NO2mixing ratios (Wetzel et al., 2002; Stowasser et al.,
2003). The different compounds among the NOyfamily are also represented as ratios
to separate dynamical from chemical effects on the NOypartitioning and to reduce the 20
influence of missing amounts of total NOy in the models. Simulations of these ratios generally appear to be more satisfactory (e.g. Kondo et al., 2000; Wetzel et al., 2002) even though Stowasser et al. (2003) have presented NO2/NOy ratios strongly
under-estimated by model results in the lower stratosphere. This seems to demonstrate that dynamical effects constitute the major part of the discrepancies with observations in
25
the middle-stratosphere.
ACPD
5, 12373–12401, 2005Simulation of the vertical structure of N2O, NO2 and HNO3
G. Berthet et al.
Title Page
Abstract Introduction
Conclusions References
Tables Figures
◭ ◮
◭ ◮
Back Close
Full Screen / Esc
Print Version
Interactive Discussion
EGU
measurements appear to be more able to characterize local processes than remote sensing observations using lines of sight of a few hundred of kilometres. We report here measurements of these species at mid-latitudes on 2 October 2002 in the frame of the first validation campaign of the ENVISAT satellite. In this paper we try to balance the dynamical and chemical effects on the modelling of the NOy partitioning. First
5
we assess the influence of the 3-D winds used in the Reprobus CTM on its ability to reproduce the NOy partitioning. Then a one-dimensional (1-D) version of the model
is used to test the impact of a correct initialisation of N2O on the simulation of the chemistry controlling the NOy partitioning. It is the first modelling study of the in situ
simultaneous observations by SPIRALE of NO2and HNO3with a CTM. 10
2. The SPIRALE balloon-borne instrument
A detailed description of the instrumental characteristics of SPIRALE and of its operat-ing mode can be found in Moreau et al. (2005). To summarize, the SPIRALE balloon-borne instrument performs in situ simultaneous measurements of several long-lived and short-lived chemical species from the tropopause up to 40 km. It uses six tunable
15
salt laser diodes in the mid-infrared domain (3µm to 10µm). The six laser diodes
are cooled and the beams are injected into a multipass Heriott cell located under the gondola. The cell (3.5 m) is deployed during the flight above the tropopause. Eighty six reflections occur, giving a 300 m optical path. Species concentrations are retrieved from direct absorption, by fitting experimental spectra with spectra calculated using
HI-20
TRAN 2001 database (Rothman et al., 2003). The instrument provides measurements with a vertical resolution of a few meters.
SPIRALE is used routinely, in particular as part of European and satellite valida-tion campaigns. On 2 October 2002, during the ENVISAT validavalida-tion campaign, the SPIRALE flight was conducted during the morning at mid-latitude from the Aire sur
25
l’Adour launch base (France, 43.7◦N, 0.3◦W). In our study we analyse the
ACPD
5, 12373–12401, 2005Simulation of the vertical structure of N2O, NO2 and HNO3
G. Berthet et al.
Title Page
Abstract Introduction
Conclusions References
Tables Figures
◭ ◮
◭ ◮
Back Close
Full Screen / Esc
Print Version
Interactive Discussion
EGU
08:00 UT. The data used in this study are averaged over a vertical range of 250 m. Rel-ative uncertainties on concentrations are then 3% for N2O, and 7% for HNO3and NO2.
3. Model calculations
The Reprobus chemical-transport model (Lef `evre et al., 1994, 1998) has been widely used in previous studies of the stratospheric chemistry (e.g. Lef `evre et al., 1994; Deniel
5
et al., 1998; Hoppel et al., 2002). The model is designed to perform annual simulations as well as detailed process studies. It computes the evolution of 55 species by means of about 160 photolytic gas-phase and heterogeneous reactions, with a time step of 15 minutes in this study. A semi-lagrangian code transports 40 species or chemical fami-lies, typically long-lived tracers but also more unstable compounds which may have a
10
long lifetime in darkness. Kinetics parameters used in the present study are based on the most recent data in general taken from Sander et al. (2003). The new laboratory measurements of photodissociation cross-sections of HO2NO2both in the UV (Knight
et al., 2002) and in the near IR (Roehl et al., 2002) have been included in the photodis-sociation calculations. The heterogeneous chemistry module includes reactions on
15
liquid aerosols. Their surface area densities are inferred from SAGE II measurements (Thomason et al., 1997).
Reprobus was integrated from 1 April 2002 to 15 October 2002. The model extends from the surface up to 0.1 hPa on 42 levels, resulting in a vertical resolution of about 1.3 km in the lower stratosphere. The horizontal resolution is 2◦latitude by 2◦longitude.
20
Temperature, winds and ground pressure are specified from the three-dimensional (3-D) European Centre for Medium-Range Weather Forecast (ECMWF) meteorological data. The ozone field was initialized on 1 April 2002 from the ECMWF ozone analysis. Other species were initialized from an April zonal mean computed from a long-term simulation of Reprobus.
ACPD
5, 12373–12401, 2005Simulation of the vertical structure of N2O, NO2 and HNO3
G. Berthet et al.
Title Page
Abstract Introduction
Conclusions References
Tables Figures
◭ ◮
◭ ◮
Back Close
Full Screen / Esc
Print Version
Interactive Discussion
EGU
4. Comparisons between SPIRALE measurements and 3-D calculations
4.1. N2O profile
4.1.1. Measurement
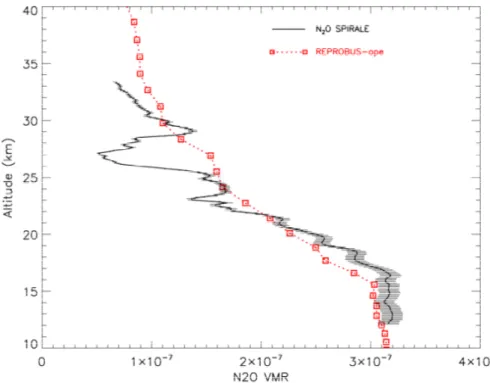
The in situ profile of N2O measured by SPIRALE (Fig. 1) presents different features which suggest that the instrument observed air masses of different origins. In particular
5
a 5 km layer with a minimum value of 50 ppbv at 27 km is clearly present between 23 and 29 km.
A detailed study based on the SPIRALE observations of N2O and CH4 has been
made to investigate the dynamical state of the stratosphere during this flight (Huret et al., 20051). Using a combination of [CH4]:[N2O] correlations and potential vorticity
10
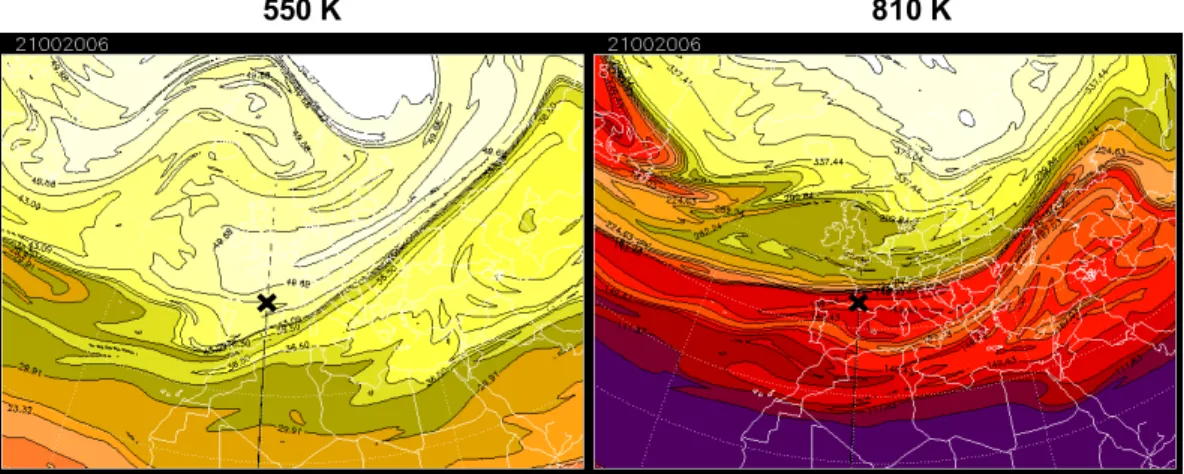
maps calculated by the MIMOSA contour advection model (Hauchecorne et al., 2002) this study shows a perturbed situation probably due to the vertical wind shear occurring during the first stage of the polar vortex formation. From the [CH4]:[N2O] correlations, mid-latitude air was diagnosed between about 16 and 23 km whereas the air masses sampled above 29 km mainly originated from tropical latitudes. This is consistent with
15
the location of the instrument with respect to the dynamical barrier existing in this re-gion: the MIMOSA model calculates potential vorticity values in the 43–50 pvu range at 550 K (about 22.5 km) and close to 149 pvu at 810 K (about 30 km) at the location of the measurement at 06:00 UT (Fig. 2a and b). Between 23 and 29 km the N2O profile
is clearly non-monotonic (Fig. 1) and the vertical profiles of both tracers are
associ-20
ated with a significantly different [CH4]:[N2O] correlation with respect to Michelsen et
al. (1998) correlation curves (Huret et al., 20051). This gives an indication that mixing processes have probably occurred, similarly to the mixing event processes occurring
1
ACPD
5, 12373–12401, 2005Simulation of the vertical structure of N2O, NO2 and HNO3
G. Berthet et al.
Title Page
Abstract Introduction
Conclusions References
Tables Figures
◭ ◮
◭ ◮
Back Close
Full Screen / Esc
Print Version
Interactive Discussion
EGU
inside the Arctic vortex and across the vortex edge (Plumb et al., 2003; Konopka et al., 2004) or to the mixing of polar vortex air into middle latitudes detected from tracer-tracer scatter plots (Waugh et al., 1997). The analysis of such a mixing event is out of the scope of our paper.
Similar conclusions can be derived from the comparisons performed by Urban et
5
al. (2004) between SPIRALE measurements and the observations of the SMR instru-ment onboard the Odin satellite (e.g. Murtagh et al., 2002). This study shows that averaging Odin/SMR measurements over 27.5–42.5◦N (mostly tropical air) and 42.5–
55◦
N (mostly mid-latitude air) gives N2O amounts similar to those observed by
SPI-RALE above 29 km and below 23 km, respectively. Between 23 and 29 km the N2O 10
profile measured by SPIRALE is located between the two averaged profiles observed by Odin/SMR, suggesting a mixing event.
4.1.2. Model calculations
CTM calculations were driven using the 3-D 6-hourly ECMWF operational analysis for winds, temperature and ground pressure recurrently employed in modelling studies
15
(e.g. Lef `evre et al., 1998; Wetzel et al., 2002; Stowasser et al., 2003; Ricaud et al., 2005). Figure 1 compares the observed profile of N2O to the model result obtained
at the grid point closest to the measurement position. The model slightly underes-timates the observations below 20 km but discrepancies are mainly observed above 25 km: Reprobus overestimates SPIRALE measurements of N2O above 30 km, and 20
does not reproduce the structure at 27 km. Other measurements-model comparisons have revealed overestimations of the calculated amounts of N2O. N2O mixing ratios
measured by the MIPAS-B balloon-borne instrument at mid-latitudes during summer time are overestimated by the KASIMA 3-D CTM below 30 km (Wetzel et al., 2002). Comparisons between Reprobus and the Odin satellite measurements have shown
25
that the model overestimated the N2O amounts observed by Odin/SMR at mid-latitudes
ACPD
5, 12373–12401, 2005Simulation of the vertical structure of N2O, NO2 and HNO3
G. Berthet et al.
Title Page
Abstract Introduction
Conclusions References
Tables Figures
◭ ◮
◭ ◮
Back Close
Full Screen / Esc
Print Version
Interactive Discussion
EGU
for the same period (R. Runhke, personal communication). This notorious problem appears to be related to a too strong vertical transport above the Equator when us-ing ECMWF operational analysis winds which provide too large quantities of N2O in
the tropical middle stratosphere (Ricaud et al., 2005). Then these amounts reach mid-latitudes by the Brewer-Dobson circulation and quasi-horizontal transport from the
5
tropical latitudes (Holton et al., 1995).
4.2. NOypartitioning
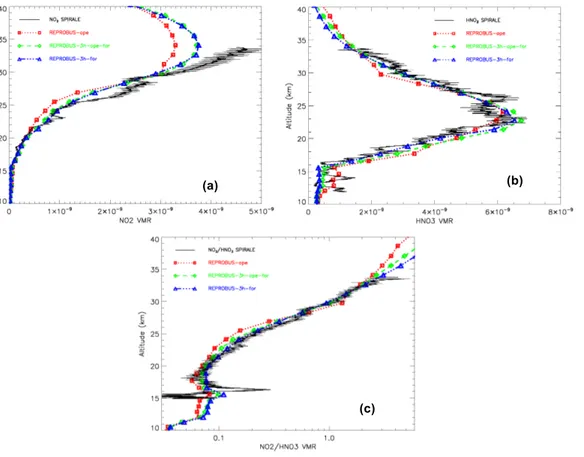
We do not consider the diurnal variation of NO2since it appears to be weak between
the half time of SPIRALE measurements during the ascent of the balloon (08:00 UT at about 24 km) and the last measurement (08:30 UT at float altitude). Figure 3 shows the
10
comparisons between the observed profiles of NO2and HNO3and the model
calcula-tions for a solar zenith angle of 70◦ at 08:00 UT. Significant underestimation is visible
on the simulated profile of NO2above 22 km (33, 40 and 22% lower than the
observa-tion at 23, 27 and 31 km, respectively) where N2O is overestimated by the model. The
model underestimates the measured mixing ratios of HNO3above 27 km (12, 19 and
15
26% lower than the observation at 27, 28 and 31 km, respectively). Simulated HNO3is
overestimated below 22 km (51 and 23% higher than the observation at 18 and 20 km, respectively) where N2O is underestimated by the model. For other altitudes Reprobus results stay within the error bars of the SPIRALE measurements.
One must examine whether such underestimation of the mixing ratios of these two
20
major species among the NOy family is related to the ability of the model to calculate the total amounts of NOy. Indeed 3-D CTMs may underestimate the total amount of
NOy at mid-latitudes, as shown by the comparison between the KASIMA CTM and
observations by the MIPAS-B instrument (Wetzel et al., 2002), which affects the sim-ulation of the various NOy species. This result is supported by recent comparisons 25
ACPD
5, 12373–12401, 2005Simulation of the vertical structure of N2O, NO2 and HNO3
G. Berthet et al.
Title Page
Abstract Introduction
Conclusions References
Tables Figures
◭ ◮
◭ ◮
Back Close
Full Screen / Esc
Print Version
Interactive Discussion
EGU
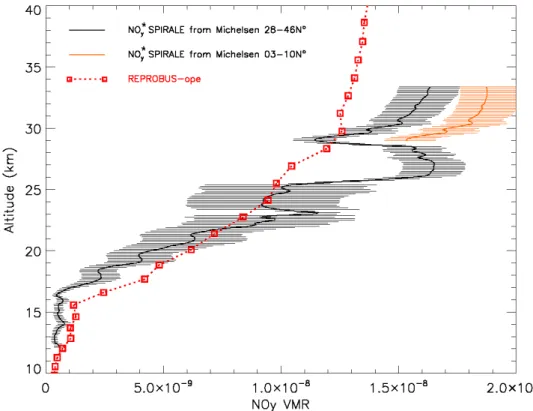
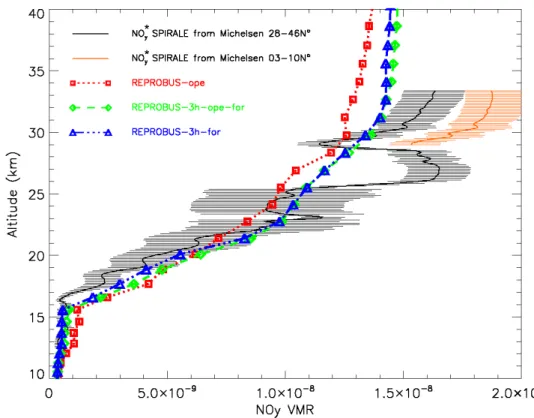
profile of total NOy (hereafter NOy*) using the compact N2O-NOy relations measured in different latitude bands. Figure 4 presents the NOy* profile inferred from the 28–
46◦N correlation given by Michelsen et al. (1998). The profile from the 3–10◦N latitude
band correlation is also represented above 29 km where air masses appear to mainly originate from low latitudes (see Sect. 4.1.1). N2O and NOyare anticorrelated for N2O 5
mixing ratios larger than about 50 ppbv. Subsequently, the comparison between the reconstructed and simulated profiles of NOy(Fig. 4) reveals a significant underestima-tion by Reprobus above 25 km where N2O is overestimated by the model. Above 30 km
the model particularly underestimates the NOy* profile inferred from the 3–10◦N N2
O-NOy correlation. A slight overestimation is observed at some altitudes below 20 km
10
where N2O is underestimated by the model. These two behaviours are the result of the discrepancies observed in Fig. 1. Any problem in the modelling of N2O has a direct
impact on the calculated quantities of total NOy. The transport of too large quantities
of the N2O precursor species at mid-latitudes stated above can result in a too weak production of NOy after its transport from tropical latitudes (e.g. Ricaud et al., 2005) 15
which explains the low values for the upper part of the profile in Fig. 4.
To minimize the effect of the uncertainty in the total NOy modelling we have com-pared the NO2/HNO3ratios rather than individual profiles (Fig. 5). In that case better
results are obtained: the NO2/HNO3ratio is well reproduced by Reprobus above 27 km
and between 17 and 22 km. However an underestimation can be seen between 22
20
and 27 km (34 and 31% lower than the observation at 23 and 27 km, respectively) as a result of NO2 underestimation. From the NO2/HNO3 ratio we can see in this
alti-tude range that the particular structure attributed to a mixing event affects our ability to reproduce the observed NOypartitioning. We conclude from Fig. 5 that the NOy
parti-tioning seems to be correctly reproduced by the CTM at all altitudes except at those of
25
the particular vertical structure. Note that the strong peaks of the NO2/HNO3 ratio at 15 and 16.5 km cannot be reproduced by the model which could be due to its too low vertical resolution.
ACPD
5, 12373–12401, 2005Simulation of the vertical structure of N2O, NO2 and HNO3
G. Berthet et al.
Title Page
Abstract Introduction
Conclusions References
Tables Figures
◭ ◮
◭ ◮
Back Close
Full Screen / Esc
Print Version
Interactive Discussion
EGU
The modelling of N2O relies mostly on transport. Thus, one can expect that a better simulation of the transport of N2O can improve the agreement between measurements
and calculations of the NO2and HNO3quantities.
5. Sensitivity to the wind fields
5.1. 6-hourly and 3-hourly ECMWF winds
5
In the work of Legras et al. (2005) in situ measurements of N2O performed from the
ER-2 aircraft are compared both to Reprobus 3-D outputs (computed at the time/positions of the flight track) and to reconstructed trajectories. Significant discrepancies are ob-served between the CTM and the reconstructed trajectories when computed with 6-hourly ECMWF operational analysis. These are characterized by strong variations and
10
unrealistic structures apparently as a result of high-frequency fluctuations in the winds. A dramatic improvement is obtained by Legras et al. (2005) when using 3-hourly analy-sis to compute air mass trajectories and the resulting N2O distribution. We have tested this result by performing a second simulation using 3-hourly wind fields obtained by interleaving 3H and 9H forecasts between the ECMWF 6-hourly operational analysis.
15
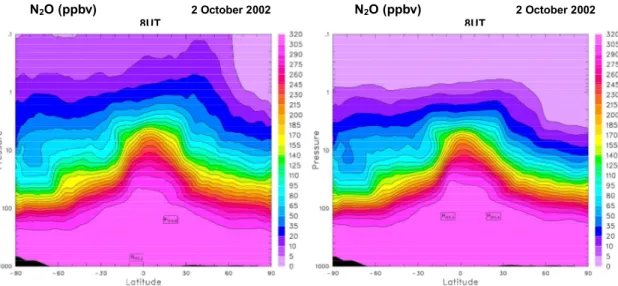
Figure 6 compares N2O zonal means calculated by Reprobus when driven by 6-hourly and 3-hourly winds on 2 October 2002, at the time of SPIRALE observations. It can be seen that using 3-hourly winds clearly leads to more realistic N2O values in the upper
stratosphere, as a result of a slower circulation and reduced vertical diffusion. This result is consistent with the analysis of Legras et al. (2005). It also supports the work
20
of Stohl et al. (2004) who show that forecast winds are less diffusive than operational analysis.
5.2. 3-D CTM calculations using 3-hourly winds
SPIRALE observations are now compared to two additional Reprobus 3-D CTM sim-ulations using different wind sources: 1) a simulation considering 3-hourly wind fields,
ACPD
5, 12373–12401, 2005Simulation of the vertical structure of N2O, NO2 and HNO3
G. Berthet et al.
Title Page
Abstract Introduction
Conclusions References
Tables Figures
◭ ◮
◭ ◮
Back Close
Full Screen / Esc
Print Version
Interactive Discussion
EGU
interleaving operational analysis at 00:00, 06:00, 12:00, and 18:00 UT with forecasts valid at 03:00, 09:00, 15:00 and 21:00 UT, as in the work of Legras et al. (2005) (here-after named Reprobus-3h-ope-for). 2) a simulation only considering forecasts at 3-h interval, based on the analysis at 00:00 and 12:00 UT (hereafter Reprobus-3h-for). The “baseline” simulation using 6-hourly operational analysis is referred as Reprobus-ope
5
in the following. Initialising the transport every 3 h has clearly allowed us to model more accurately the vertical profile of N2O tracer species at the time of the SPIRALE
measurement (Fig. 7). Below 20 km the new N2O profile is characterized by slightly higher values with a better agreement with Reprobus-3h-for. Above 20 km the N2O
quantities are decreased towards the profile obtained from the operational analysis. A
10
slight underestimation of the measurements is observed for the upper part of the profile but the decrease of N2O amounts as altitude increases appears to be more consistent
than the Reprobus-ope simulation results. However, the vertical structure observed by SPIRALE around 27 km cannot be reproduced with the new simulations.
The Reprobus-3h-ope-for and Reprobus-3h-for simulations result in enhanced total
15
mixing ratios of NOyabove 20 km where N2O calculated values are lower in comparison
with the typical Reprobus-ope simulation (Fig. 8). Below these altitudes, the increased simulated amounts of N2O give lower NOy mixing ratios in better agreement with the
NOy* in situ profile deduced from Michelsen et al. (1998)’s correlation. Above 30 km
however, the modelled total amounts of NOy from the two additional simulations do
20
not appear to be sufficient when compared to the two NOy* profiles (cf. Sect. 4.2). This
could be considered as a limitation of the use of the Michelsen et al. (1998)’s correlation curve between N2O and NOy.
NO2 and HNO3 profiles calculated by the 3-hourly wind simulations have increased
mixing ratios which are in better quantitative agreement with SPIRALE observations
25
ACPD
5, 12373–12401, 2005Simulation of the vertical structure of N2O, NO2 and HNO3
G. Berthet et al.
Title Page
Abstract Introduction
Conclusions References
Tables Figures
◭ ◮
◭ ◮
Back Close
Full Screen / Esc
Print Version
Interactive Discussion
EGU
apparent underestimation of total NOy* quantities (27 and 12% lower than the obser-vation at 27 and 31 km, respectively). Below 22 km the disagreement remain roughly similar between the three model experiments. For HNO3, most of the Reprobus-3h-for
simulation values are located within the error bars of the SPIRALE profile (Fig. 9b), even though some fine specific structures cannot be reproduced, such as at 21 km
5
(36% higher than the observation). Slight improvement is obtained in comparison with the Reprobus-3h-ope-for experiment below 22 km where Reprobus-3h-for simulation gives the best agreement with the NOy* in situ profile. The results of the two 3-hourly
simulations of the NO2/HNO3ratio fall now within the error bars of the in situ
observa-tion (Fig. 9c) which shows that the mid-latitude partiobserva-tioning between these two species
10
can be modelled correctly provided that the simulated NOytotal amounts are well taken into account.
Ignoring the specific problem of mixing, the Reprobus 3-D CTM underestimates the NO2and HNO3amounts at mid-latitudes due to the underestimation of total NOywhich is in turn the result of transport uncertainties in the model that affect the simulation of
15
N2O. ECMWF 6-hourly operational analysis seem to be characterized by some noisy
and unrealistic features which are not present in the forecasts (Legras et al., 2005) and apparently affecting the transport calculations in Reprobus and in other CTMs. The strict reasons for the significant improvements of the NOy comparisons using the
3-hourly winds are still unclear. Nevertheless it is thought that using 3-3-hourly wind data
20
gives a better sampling for the interpolation of the positions between two consecutive wind records in Reprobus.
However discrepancies between the SPIRALE measurements and the model results in Fig. 9 still remain especially for NO2above 30 km as a result of the underestimation
of the total amounts of NOy* at these altitudes. Recent studies have shown that satisfy-25
ing comparisons can be obtained between observations and model calculations when those are constrained by observations of total NOy (e.g. K ¨ull et al., 2002). This points
out the necessity of an adequate simulation of total amounts of NOy to reproduce the
ACPD
5, 12373–12401, 2005Simulation of the vertical structure of N2O, NO2 and HNO3
G. Berthet et al.
Title Page
Abstract Introduction
Conclusions References
Tables Figures
◭ ◮
◭ ◮
Back Close
Full Screen / Esc
Print Version
Interactive Discussion
EGU
6. 1-D calculations
To get rid of the influence of the problem of transport and hence of the missing quan-tities of total NOy, we have used the Reprobus model in its one-dimensional form.
Constraining 1-D-Reprobus calculations by observed total NOy has significantly im-proved the modelled partitioning of NOy species compared to balloon measurements 5
in the summer polar stratosphere (Dufour et al., 2005). Similar conclusions have been obtained from comparisons between balloon observations and lagrangian simulations in January 1999 inside a warm Arctic vortex (Stefan Bausch, private communication). In the present study the 1-D-Reprobus initialisation is constrained by the N2O profile
measured by SPIRALE and by the corresponding NOy* profiles. However the N2O-NOy
10
correlation curves from Michelsen et al. (1998) have been determined on given latitude bands and it is not straightforward to choose the adequate correlation values that have to be considered above 29 km where air seems to originate from low latitudes. Two simulations are performed in our study. The first one (referred as Reprobus-1D-midlat) is constrained with the NOy* profile inferred from the N2O-NOycorrelations in the 28– 15
46◦N latitude band. In the second simulation (hereafter Reprobus-1D-midlat-trop) the
computed NOy* profile is defined by the N2O-NOy correlation values in the 28–46◦N
and 3–10◦N latitude ranges below and above 29 km, respectively (cf. Sect. 4.2). These
two model experiments allow us to test the sensitivity of the choice of the N2O-NOy correlation law on the modelled partitioning of NO2and HNO3. The other species are 20
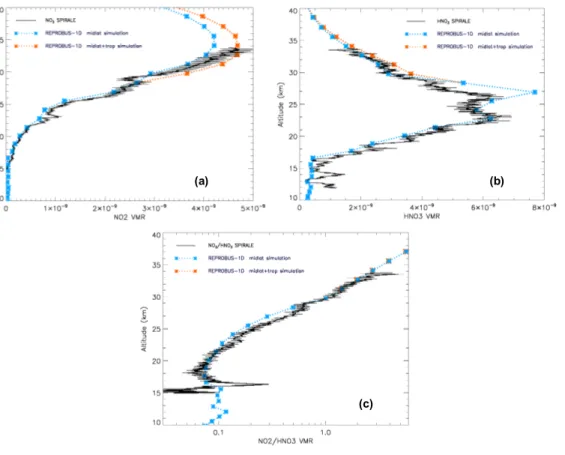
initialised from the 3-D-Reprobus simulation as in the work of Dufour et al. (2005). For both experiments the calculated mixing ratios of NO2and HNO3are close to the measurements (Fig. 10). For NO2 significant improvement is obtained above 22 km:
the Reprobus-1D-midlat experiment provides values that are only 17% and 3% lower than the SPIRALE profile at 23 and 27 km, respectively. Above 29 km the measured
25
quantities lie between the results of the two simulations. An average of the results of both simulations is in perfect agreement with the observation of NO2 at these
ACPD
5, 12373–12401, 2005Simulation of the vertical structure of N2O, NO2 and HNO3
G. Berthet et al.
Title Page
Abstract Introduction
Conclusions References
Tables Figures
◭ ◮
◭ ◮
Back Close
Full Screen / Esc
Print Version
Interactive Discussion
EGU
simulated for the whole altitude range (24% and 10% lower than the observation at 18 and 20 km, respectively, 6% and 24% higher than the observation at 23 km and 28 km, respectively) except in the layer around 27 km (41% higher than the observation at 27 km). The calculation of the NO2/HNO3 ratio is not significantly improved between
22 and 27 km (22% and 31% lower than the observation at 23 km and 27 km,
respec-5
tively), the computed ratio being underestimated at 27 and 28 km as a result of HNO3
overestimation. Taking into account the N2O-NOy correlation uncertainty of Michelsen
et al. (1998) the 1-D-simulation cannot reproduce simultaneously NO2 and HNO3 in the particular layer of a possible previous mixing event. Actually the correlation curves of Michelsen et al. (1998) determined on given latitude bands cannot account for a full
10
description a N2O-NOycorrelation within a layer containing mixed air from tropical and mid- latitudes.
7. Conclusions
We have used in situ observations of N2O, NO2 and HNO3 by the SPIRALE balloon-borne instrument to test our ability to reproduce the observed NOy partitioning at mid-15
latitudes. In a first part we have used the Reprobus 3-D CTM computed with the most recent kinetics data from the JPL recommendation and driven by the meteorological parameters from ECMWF. Discrepancies appear between the simulation and the mea-surement of N2O when transport calculations are conducted with the ECMWF 6-hourly
operational analysis widely used in the scientific community. This affects the
mod-20
elling of NO2and HNO3 with in particular an underestimation of the NO2/HNO3 ratio.
The comparisons for N2O are improved at all altitudes when transport calculations are
driven by 3-hourly wind data. This result is consistent with the analysis of Legras et al. (2005) who shows much better agreement between ER-2 in situ observations and distributions of N2O calculated using such 3-hourly wind fields. From this improved 25
ACPD
5, 12373–12401, 2005Simulation of the vertical structure of N2O, NO2 and HNO3
G. Berthet et al.
Title Page
Abstract Introduction
Conclusions References
Tables Figures
◭ ◮
◭ ◮
Back Close
Full Screen / Esc
Print Version
Interactive Discussion
EGU
cannot be reproduced by the 3-D CTM. This feature is attributed to a previous mixing event which is beyond the capabilities of the model at its current horizontal and vertical resolution.
The best results regarding the partitioning of NOy are obtained by constraining the 1-D version of model with the observed profile of N2O and the corresponding total 5
NOy deduced from established N2O-NOy correlations. In these conditions, our model
simulations show that the observed mid-latitude NO2/HNO3 ratio can be reproduced with excellent agreement at all stratospheric altitudes. Modelling the NOy partitioning
with the best accuracy relies at least on a satisfying simulation of N2O and thus of
total NOy. This result is consistent with the conclusions of Dufour et al. (2005) who
10
constrained their model for the Arctic summer period with the sum of the measured NOy species. It also suggests that discrepancies found between observations and
modelling of the NOypartitioning at mid-latitudes mainly originate from transport effects
rather than general knowledge of the stratospheric chemistry.
The problem of transport calculation may also affect the modelling of diabatic descent
15
inside the polar vortex where disagreements appear when comparisons are performed between models and satellite observations (e.g. Ricaud et al., 2005). A next step of our work is to make comparisons at a global scale and for long time series using satellite data such as those of ODIN and ENVISAT.
Acknowledgements. We are grateful to all the members of the CNES launching team at Aire
20
sur l’Adour. This work was funded in part by the European Commission under the TOPOZ-III project (contract EVK2-CT-2001-00102).
References
Br ¨uhl, C., Crutzen, P. J., and Grooß, J.-U.: High-latitude, summertime NOx activation and seasonal ozone decline in the lower stratosphere: Model calculations based on observations 25
ACPD
5, 12373–12401, 2005Simulation of the vertical structure of N2O, NO2 and HNO3
G. Berthet et al.
Title Page
Abstract Introduction
Conclusions References
Tables Figures
◭ ◮
◭ ◮
Back Close
Full Screen / Esc
Print Version
Interactive Discussion
EGU
Deniel, C., Pommereau, J. P., Bevilacqua, R. M., and Lef `evre, F.: Arctic chemical depletion during the 1994–95 winter deduced from POAM II satellite observations and the Reprobus-3D model, J. Geophys. Res, 103, 19 231–19 244, 1998.
Dufour, G., Payan, S., Lef `evre, F., Eremenko, M., Butz, A., Jeseck, P., T ´e, Y., Pfeilsticker, K., and Camy-Perret, C.: 4-D comparison method to study the NOypartitioning in summer polar 5
stratosphere – Influence of aerosol burden, Atmos. Chem. Phys., 5, 919–926, 2005,
SRef-ID: 1680-7324/acp/2005-5-919.
Fahey, D. W., Kawa, S. R., Woodbridge, E. L., et al.: In situ measurements constraining the role of sulphate aerosols in mid-latitude ozone depletion, Nature, 363, 509–514, 1993.
Gao, R. S., Fahey, D. W., Del Negro, L. A., et al.: A comparison of observations and model sim-10
ulations of NOx/NOyin the lower stratosphere, Geophys. Res. Lett, 26, 1153–1156, 1999. Hauchecorne, A., Godin, S., Marchand, M., Hesse, B., and Souprayen, C.: Quantification
of the transport of chemical constituents from the polar vortex to midlatitudes in the lower stratosphere using the high-resolution advection model MIMOSA and effective diffusivity, J. Geophys. Res., 107(D20), 8289, doi:10.1029/2001JD000491, 2002.
15
Holton, J. R., Haynes, P. H., McIntyre, M. E., Douglass, A., Rood, R., and Pfister, L.: Stratosphere-troposphere exchange, Rev. Geophys., 33(4), doi:10.1029/95RG02097, 1995. Hoppel, K., Bevilacqua, R., Nedohula, G., Deniel, C., Lef `evre, F., Lumpe, J., Fromm, M.,
Ran-dall, C., Rosenfield, J., and Rex, M.: POAM III observations of arctic ozoneloss for the 1999/2000 winter, J. Geophys. Res., 107, doi:10.1029/2001JD000476, 2002.
20
Knight, G., Ravishankara, A. R., and Burkholder, J. B.: UV absorption cross sections of HO2NO2between 343 and 273 K, Phys. Chem. Phys., 4, 1732–1437, 2002.
Kondo, Y., Sugita, T., Koike, M., Kawa, S. R., Danilin, M. Y., Rodriguez, J. M., Spreng, S., Golinger, K., and Arnold, F.: Partitioning of reactive nitrogen in the mid-latitude lower strato-sphere, J. Geophys. Res., 105, 1417–1424, 2000.
25
Konopka, P., Steinhorst, H.-M., Grooß, J.-U., et al.: Mixing and ozone loss in the 1999–2000 Arctic vortex: Simulations with the three-dimensional Chemical Lagrangian Model of the Stratosphere (ClaMS), J. Geophys. Res., 109, D02315, doi:10.1029/2003JD003792, 2004. K ¨ull, V., Riese, M., Tie, X., Wiemert, T., Eidmann, G., Offermann, D., and Brasseur, G.:
NOy partitioning and aerosol influences in the stratosphere, J. Geophys. Res., 107, 8183, 30
doi:10.1029/2001JD001246, 2002.
ACPD
5, 12373–12401, 2005Simulation of the vertical structure of N2O, NO2 and HNO3
G. Berthet et al.
Title Page
Abstract Introduction
Conclusions References
Tables Figures
◭ ◮
◭ ◮
Back Close
Full Screen / Esc
Print Version
Interactive Discussion
EGU
9183–8195, 1994.
Lef `evre, F., Figarol, F., Carslaw, K., and Peter, T.: The 1997 Arctic ozone depletion quantified from three-dimensional model simulations, Geophys. Res. Lett., 25, 2425–2428, 1998. Legras, B., Pisso, I., Berthet, G., and Lef `evre, F.: Variability of the Lagrangian turbulent diff
u-sivity in the lower stratosphere, Atmos. Chem. Phys., 5, 1605–1622, 2005, 5
SRef-ID: 1680-7324/acp/2005-5-1605.
McElroy, M. B. and McConnell, J. C.: Nitrous oxide: A natural source of stratospheric NO, J. Atmos. Sci., 28, 1095–1098, 1971.
McElroy, M. B., Salawitch, R. J., and Minschwaner, K.: The changing stratosphere, Planet. Space Sci., 40, 373–401, 1992.
10
Michelsen, H. A., Manney, G. L., Gunson, M. R., and Zander, R.: Correlations of stratospheric abundances of NOy, O3, N2O, and CH4 derived from ATMOS measurements, J. Geophys. Res., 103, 28 347–28 359, 1998.
Moreau, G., Robert, C., Catoire, V., Chartier, M., Camy-Peyret, C., Huret, N., Pirre, M., and Pomathiod, L.: A multi-species in situ balloon-borne instrument with six diode laser spec-15
trometers, Appl. Opt., 44(28), 1–18, 2005.
Murtagh, D., Frisk, U., Merino, F., et al.: An overview of the Odin atmospheric mission, Can. Journ. of Phys., 80, 309–319, 2002.
Osterman, G. B., Salawitch, R. J., Sen, B., et al.: Balloon-borne measurements of stratospheric radicals and their precursors: Implications for production and loss of ozone, Geophys. Res. 20
Lett, 24, 1107–1110, 1997.
Payan, S., Camy-Peyret, C., Jeseck, P., Hawat, T., Pirre, M., Renard, J.-B., Robert, C., Lef `evre, F., Kanzawa, H., and Sasano, Y.: Diurnal and nocturnal distribution of stratospheric NO2from solar and stellar occultation measurements in the Arctic vortex: comparison with models and ILAS satellite measurements, J. Geophys. Res., 104, 21 585–21 593, 1999.
25
Plumb, R. A., Heres, W., Neu, J. L., Mahowald, N. M., del Corral, J., Toon, G. C., Ray, E., Moore, F., and Andrews, A. E.: Global tracer modelling during SOLVE: High latitude descent and mixing, J. Geophys. Res., 108(D5), 8309, doi:10.1029/2001JD001023, 2003.
Ricaud, P., Lef `evre, F., Berthet, G., et al.: Polar vortex evolution during the 2002 Antarc-tic major warming as observed by the Odin satellite, J. Geophys. Res., 110, D05302, 30
doi:10.1029/2002JD005018, 2005.
ACPD
5, 12373–12401, 2005Simulation of the vertical structure of N2O, NO2 and HNO3
G. Berthet et al.
Title Page
Abstract Introduction
Conclusions References
Tables Figures
◭ ◮
◭ ◮
Back Close
Full Screen / Esc
Print Version
Interactive Discussion
EGU
Rothman, L. S., Barbe, A., Benner, D. C., et al.: The HITRAN molecular spectroscopic database: edition of 2000 including updates through 2001, J. Quantitative Spect. Radiative Transfer, 82(1-4), 5–44, 2003.
Salawitch, R. J., Wofsy, S. C., Wennberg, P. O., et al.: The distribution of hydrogen, nitro-gen, and chlorine radicals in the lower stratosphere: Implications for changes in O3 due to 5
emission of NOyfrom supersonic aircraft, Geophys. Res. Lett., 21, 2547–2550, 1994. Sander, S. P., Friedl, R. R., Ravishankara, A. R., et al.: Chemical Kinetics and Photochemical
Data for use in atmospheric studies, Evaluation number 14, JPL Publication 02-25, 2003. Sen, B., Toon, G. C., Osterman, G. B., Blavier, J.-F., Margitan, J. J., Salawitch, R. J., and
Yue, G. K.: Measurements of reactive nitrogen in the stratosphere, J. Geophys. Res., 103, 10
3571–3585, 1998.
Stohl, A., Cooper, O., and James, P.: A cautionary note on the use of meteorological analysis fields for quantifying atmospheric mixing, J. Atmos. Sci., 61, 1446–1453, 2004.
Stowasser, M., Oelhaf, H., Ruhnke, R., Wetzel, G., Friedl-Vallon, F., Kleinert, A., Kouker, W., Lengel, A., Maucher, G., Nordmeyer, H., Reddmann, Th., Trieschmann, O., v. Clar-15
mann, T., and Fischer, H.: A characterization of the warm 1999 Arctic winter by observa-tions and modeling: NOy partitioning and dynamics, J. Geophys. Res., 107(D19), 4376, doi:10.1029/2001JD001217, 2002.
Stowasser, M., Oelhaf, H., Ruhnke, R., Kleinert, A., Wetzel, G., Friedl-Vallon, F., Kouker, W., Lengel, A., Maucher, G., Nordmeyer, H., Reddmann, Th., and Fischer, H.: The variation 20
of short-lived NOy species around sunrise at mid-latitudes as measured by MIPAS-B and calculated by KASIMA, Geophys. Res. Lett, 30, 1432, doi:10.1029/2002GL016727, 2003. Thomason, L. W., Poole, L. R., and Deshler, T. R.: A global climatology of stratospheric aerosol
surface area density as deduced from SAGE II: 1984–1994, J. Geophys. Res., 102, 8967– 8976, 1997.
25
Urban, J., Lauti ´e, N., Le Flochmo ¨en, E., et al.: Odin/SMR Limb Observations of Stratospheric Trace gases: Validation of N2O, J. Geophys. Res., 110, D09301, doi:10.1029/2004JD005394, 2004.
Waugh, D. W., Plumb, R. A., Elkins, J. W., et al.: Mixing of polar vortex air into middle latitudes as revealed by tracer-tracer scatterplots, J. Geophys. Res., 102, 13 119–13 134, 1997. 30
ACPD
5, 12373–12401, 2005Simulation of the vertical structure of N2O, NO2 and HNO3
G. Berthet et al.
Title Page
Abstract Introduction
Conclusions References
Tables Figures
◭ ◮
◭ ◮
Back Close
Full Screen / Esc
Print Version
Interactive Discussion
EGU
ACPD
5, 12373–12401, 2005Simulation of the vertical structure of N2O, NO2 and HNO3
G. Berthet et al.
Title Page
Abstract Introduction
Conclusions References
Tables Figures
◭ ◮
◭ ◮
Back Close
Full Screen / Esc
Print Version
Interactive Discussion
EGU
ACPD
5, 12373–12401, 2005Simulation of the vertical structure of N2O, NO2 and HNO3
G. Berthet et al.
Title Page
Abstract Introduction
Conclusions References
Tables Figures
◭ ◮
◭ ◮
Back Close
Full Screen / Esc
Print Version
Interactive Discussion
EGU
ACPD
5, 12373–12401, 2005Simulation of the vertical structure of N2O, NO2 and HNO3
G. Berthet et al.
Title Page
Abstract Introduction
Conclusions References
Tables Figures
◭ ◮
◭ ◮
Back Close
Full Screen / Esc
Print Version
Interactive Discussion
EGU
ACPD
5, 12373–12401, 2005Simulation of the vertical structure of N2O, NO2 and HNO3
G. Berthet et al.
Title Page
Abstract Introduction
Conclusions References
Tables Figures
◭ ◮
◭ ◮
Back Close
Full Screen / Esc
Print Version
Interactive Discussion
EGU
Fig. 4. Vertical profiles of reconstructed NOy* compared to the Reprobus model output on 2 October 2002 (red line). Black curve: NOy* profile inferred from the N2O-NOy correlation determined by Michelsen et al. (1998) in the 28–46◦N latitude band. Orange curve: NO
ACPD
5, 12373–12401, 2005Simulation of the vertical structure of N2O, NO2 and HNO3
G. Berthet et al.
Title Page
Abstract Introduction
Conclusions References
Tables Figures
◭ ◮
◭ ◮
Back Close
Full Screen / Esc
Print Version
Interactive Discussion
EGU
ACPD
5, 12373–12401, 2005Simulation of the vertical structure of N2O, NO2 and HNO3
G. Berthet et al.
Title Page
Abstract Introduction
Conclusions References
Tables Figures
◭ ◮
◭ ◮
Back Close
Full Screen / Esc
Print Version
Interactive Discussion
EGU
ACPD
5, 12373–12401, 2005Simulation of the vertical structure of N2O, NO2 and HNO3
G. Berthet et al.
Title Page
Abstract Introduction
Conclusions References
Tables Figures
◭ ◮
◭ ◮
Back Close
Full Screen / Esc
Print Version
Interactive Discussion
EGU
ACPD
5, 12373–12401, 2005Simulation of the vertical structure of N2O, NO2 and HNO3
G. Berthet et al.
Title Page
Abstract Introduction
Conclusions References
Tables Figures
◭ ◮
◭ ◮
Back Close
Full Screen / Esc
Print Version
Interactive Discussion
EGU
ACPD
5, 12373–12401, 2005Simulation of the vertical structure of N2O, NO2 and HNO3
G. Berthet et al.
Title Page
Abstract Introduction
Conclusions References
Tables Figures
◭ ◮
◭ ◮
Back Close
Full Screen / Esc
Print Version
Interactive Discussion
EGU
ACPD
5, 12373–12401, 2005Simulation of the vertical structure of N2O, NO2 and HNO3
G. Berthet et al.
Title Page
Abstract Introduction
Conclusions References
Tables Figures
◭ ◮
◭ ◮
Back Close
Full Screen / Esc
Print Version
Interactive Discussion
EGU
Fig. 10.NO2(a), HNO3(b)and NO2/HNO3ratio(c)measured by SPIRALE (black curve) and simulated by Reprobus. The model is here constrained by the measured profile of N2O and the NOy* deduced from the N2O-NOycorrelation. Blue curve: Reprobus-1D-midlat experiment, NOy* profile inferred from the correlation valid in the 28–46◦