ACPD
12, 17583–17605, 2012The sensitivity of stratospheric ozone
changes
L. E. Revell et al.
Title Page
Abstract Introduction
Conclusions References
Tables Figures
◭ ◮
◭ ◮
Back Close
Full Screen / Esc
Printer-friendly Version Interactive Discussion
Discussion
P
a
per
|
Dis
cussion
P
a
per
|
Discussion
P
a
per
|
Discussio
n
P
a
per
|
Atmos. Chem. Phys. Discuss., 12, 17583–17605, 2012 www.atmos-chem-phys-discuss.net/12/17583/2012/ doi:10.5194/acpd-12-17583-2012
© Author(s) 2012. CC Attribution 3.0 License.
Atmospheric Chemistry and Physics Discussions
This discussion paper is/has been under review for the journal Atmospheric Chemistry and Physics (ACP). Please refer to the corresponding final paper in ACP if available.
The sensitivity of stratospheric ozone
changes through the 21st century to N
2
O
and CH
4
L. E. Revell1,2, G. E. Bodeker3, P. E. Huck3, B. E. Williamson2, and E. Rozanov4,5
1
National Institute of Water and Atmospheric Research, Christchurch, New Zealand
2
Department of Chemistry, University of Canterbury, New Zealand
3
Bodeker Scientific, Alexandra, New Zealand
4
Physical-Meteorological Observatory Davos/World Radiation Center, Davos, Switzerland
5
Institute for Atmospheric and Climate Science ETH, Zurich, Switzerland
Received: 11 June 2012 – Accepted: 28 June 2012 – Published: 18 July 2012
Correspondence to: L. E. Revell ([email protected])
ACPD
12, 17583–17605, 2012The sensitivity of stratospheric ozone
changes
L. E. Revell et al.
Title Page
Abstract Introduction
Conclusions References
Tables Figures
◭ ◮
◭ ◮
Back Close
Full Screen / Esc
Printer-friendly Version Interactive Discussion
Discussion
P
a
per
|
Dis
cussion
P
a
per
|
Discussion
P
a
per
|
Discussio
n
P
a
per
Abstract
Through the 21st century, anthropogenic emissions of the greenhouse gases N2O and
CH4are projected to increase, thus increasing their atmospheric concentrations.
Con-sequently, reactive nitrogen species produced from N2O and reactive hydrogen species produced from CH4are expected to play an increasingly important role in determining
5
stratospheric ozone concentrations. Eight chemistry-climate model simulations were performed to assess the sensitivity of stratospheric ozone to different emissions sce-narios for N2O and CH4. Increases in reactive nitrogen-mediated ozone loss resulting
from increasing N2O concentrations lead to a decrease in global-mean total column
ozone. Increasing CH4concentrations increase the rate of reactive hydrogen-mediated
10
ozone loss in the upper stratosphere. Overall however, increasing CH4concentrations lead to an increase in global-mean total column ozone. Stratospheric column ozone over the 21st century exhibits a near-linear response to changes in N2O and CH4
sur-face concentrations, which provides a simple parameterization for the ozone response to changes in these gases.
15
1 Introduction
Through the 21st century, declining concentrations of stratospheric chlorine and bromine, together with increasing concentrations of CO2, are projected to lead to
in-creased global-mean stratospheric ozone (Eyring et al., 2010). CO2, the dominant anthropogenic greenhouse gas (GHG), elevates ozone by cooling the stratosphere,
20
which slows the gas-phase ozone loss cycles (e.g. WMO, 1999; Rosenfield et al., 2002; IPCC/TEAP 2005). Of the GHGs controlled under the Kyoto Protocol, those with the highest radiative forcing after CO2 are N2O and CH4, both of which lead to changes in ozone via chemical processes. Although the roles of N2O and CH4 in ozone
chem-istry are qualitatively understood, the sensitivity of ozone to these gases has not been
ACPD
12, 17583–17605, 2012The sensitivity of stratospheric ozone
changes
L. E. Revell et al.
Title Page
Abstract Introduction
Conclusions References
Tables Figures
◭ ◮
◭ ◮
Back Close
Full Screen / Esc
Printer-friendly Version Interactive Discussion
Discussion
P
a
per
|
Dis
cussion
P
a
per
|
Discussion
P
a
per
|
Discussio
n
P
a
per
|
thoroughly investigated. It is the aim of this work to gain a quantitative understanding of the sensitivity of stratospheric ozone to N2O and CH4.
N2O in the stratosphere affects ozone predominantly through NOx-catalyzed
(NOx=NO+NO2) ozone-loss cycles (Crutzen, 1970). However increases in N2O do
not necessarily lead to increases in NOx, due to the interfering effects of other GHGs
5
and ozone-depleting substances (ODSs). For example, the sink for NOxis temperature
dependent, so CO2-induced cooling of the stratosphere decreases NOx abundances
(Rosenfield and Douglass, 1998). Plummer et al. (2010) found that nitrogen species incited large stratospheric ozone losses once the effects of CO2-induced stratospheric
cooling were removed. CH4weakens the ozone-depleting effectiveness of N2O by
pro-10
ducing reactive hydrogen species which: (1) slow NOx-catalyzed ozone loss cycles in the upper stratosphere, and (2) remove NOx from the middle stratosphere through
reactions to form HNO3 (Revell et al., 2012). Similarly, chlorine radicals produced by
photolysis of ODSs such as the CFCs react with NOx to form ClONO2, thus reducing NOx abundances (Ravishankara et al., 2009). However, as the chlorine loading of the
15
stratosphere decreases through the 21st century (owing to the success of the Mon-treal Protocol for Substances that Deplete the Ozone Layer and later amendments), the effect of chlorine on NOx will become less important. Furthermore, Ravishankara
et al. (2009) have shown that N2O is the dominant ODS currently emitted, and is
ex-pected to remain so through the remainder of the 21st century.
20
The oxidation of CH4 produces HOx radicals (here: HOx=H+OH+HO2), which
catalyze ozone destruction cycles, particularly in the upper stratosphere. However, Portmann and Solomon (2007) and Fleming et al. (2011) have shown that the pre-dominant effect of increasing CH4 is to increase total column ozone by way of H2
O-induced stratospheric cooling in the middle stratosphere, which slows the
temperature-25
ACPD
12, 17583–17605, 2012The sensitivity of stratospheric ozone
changes
L. E. Revell et al.
Title Page
Abstract Introduction
Conclusions References
Tables Figures
◭ ◮
◭ ◮
Back Close
Full Screen / Esc
Printer-friendly Version Interactive Discussion
Discussion
P
a
per
|
Dis
cussion
P
a
per
|
Discussion
P
a
per
|
Discussio
n
P
a
per
chlorine to the HCl reservoir and thereby slows the chlorine-catalyzed ozone loss cy-cles throughout the stratosphere.
CH4+Cl→CH3+HCl (R1)
Furthermore, in the troposphere and very lower stratosphere, where the concentration of CO is sufficiently large (Lanzendorf et al., 2001), increased HOxcauses an increase
5
in the rates of Reactions (R2)–(R5), therefore leading to ozone production (Brasseur and Solomon, 2005; Fleming et al., 2011). Likewise, increased NOx(from elevated N2O
concentrations) leads to ozone production in the troposphere and lower stratosphere via Reactions (R4) and (R5).
OH+CO+O2→HO2+CO2 (R2)
10
HO2+NO→OH+NO2 (R3)
NO2+hν→NO+O (R4)
O+O2+M→O3+M (R5)
CO+2O2→CO2+O3
Oman et al. (2010) studied the effects of reactive nitrogen and hydrogen species on
15
stratospheric ozone using two chemistry-climate model (CCM) simulations constrained by the IPCC SRES A1B and A2 emissions scenarios for GHGs, which portray interme-diate (A1B) and large (A2) increases in CO2, N2O and CH4 (Nakicenovic and Swart,
2000). The evolution of upper stratospheric ozone in the two CCM simulations was sim-ilar, because although NOxand HOxspecies led to larger ozone losses in A2 compared
20
with A1B, they were compensated by the effects of larger increases in CO2-induced
stratospheric cooling.
Here an analysis of the chemical sensitivity of stratospheric ozone to N2O and CH4 through the 21st century is presented using the results from eight CCM simulations. Four simulations differed only in terms of their N2O concentrations, while the other four
25
differed by their CH4 concentrations. The same concentration scenario for CO2 was
ACPD
12, 17583–17605, 2012The sensitivity of stratospheric ozone
changes
L. E. Revell et al.
Title Page
Abstract Introduction
Conclusions References
Tables Figures
◭ ◮
◭ ◮
Back Close
Full Screen / Esc
Printer-friendly Version Interactive Discussion
Discussion
P
a
per
|
Dis
cussion
P
a
per
|
Discussion
P
a
per
|
Discussio
n
P
a
per
|
2 Computational methods
2.1 The NIWA-SOCOL chemistry-climate model
The evolution of stratospheric ozone was simulated using the NIWA-SOCOL (National Institute of Water and Atmospheric Research – SOlar Climate Ozone Links) CCM (SPARC CCMVal, 2010). NIWA-SOCOL is based on SOCOL v2.0 (Schraner et al.,
5
2008), which consists of the MAECHAM4 global climate model (Manzini et al., 1997) coupled to a modified version of the MEZON chemistry transport model (Egorova et al., 2003). NIWA-SOCOL includes 41 chemical species, 140 gas-phase reactions, 46 pho-tolysis reactions and 16 heterogeneous reactions. Chemical constituents are advected by a hybrid transport scheme (Zubov et al., 1999), and the chemical solver algorithm
10
uses a Newton-Raphson iterative method. A 15-min time step is used for dynamical processes, while radiative and chemical calculations are performed every two hours. CCM simulations were performed for the period 2005–2100, with the first ten yr dis-carded as spin-up.
The NIWA-SOCOL model attributes ozone loss to 15 catalytic cycles (listed in
15
Revell et al., 2012), using a diagnostic approach similar to that employed by Lee et al. (2002). Odd oxygen (O+O(1D)+O3) removal rates (molecules cm−
3
s−1) are
cal-culated within the model based on the rate-limiting steps of the corresponding reaction cycles, recorded and accumulated as daily means in each model grid cell.
2.2 Concentrations scenarios
20
Eight GHG concentration scenarios were constructed, as described in Table 1, using combinations of the IPCC SRES A1B concentrations scenario for GHGs (Nakicenovic and Swart, 2000), and the four representative concentration pathways (RCPs) 2.6, 4.5, 6.0 and 8.5, named according to the radiative forcings (in W m−2) reached by 2100. The
RCPs were developed for the climate modelling community to provide possible
con-25
ACPD
12, 17583–17605, 2012The sensitivity of stratospheric ozone
changes
L. E. Revell et al.
Title Page
Abstract Introduction
Conclusions References
Tables Figures
◭ ◮
◭ ◮
Back Close
Full Screen / Esc
Printer-friendly Version Interactive Discussion
Discussion
P
a
per
|
Dis
cussion
P
a
per
|
Discussion
P
a
per
|
Discussio
n
P
a
per
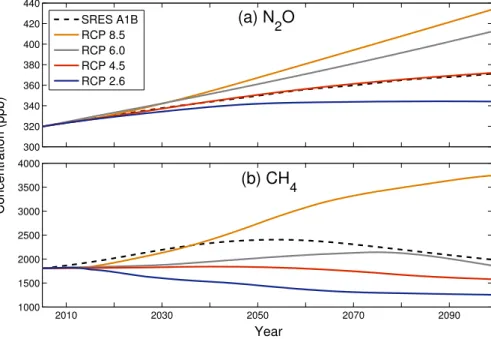
socio-economic, emission and climate projections (van Vuuren et al., 2011). Surface concentrations of N2O and CH4 for the individual scenarios are shown in Fig. 1. All
simulations used the SRES A1B scenario for CO2 and the adjusted A1 scenario for
halocarbons (Daniel et al., 2007).
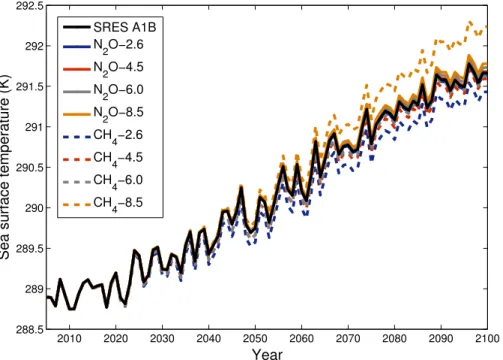
Sea-surface temperatures (SSTs) were prescribed under the SRES A1B scenario
5
using output from the ECHAM5/MPIOM atmosphere-ocean general circulation model (AOGCM). To test whether they would have been different if they had been calculated from AOGCM simulations using the constructed GHG concentration scenarios (Ta-ble 1), SSTs for each of the eight scenarios were simulated using the simple climate model MAGICC6, which is designed to emulate AOGCMs (Meinshausen et al., 2011).
10
Globally averaged annual-mean SSTs under the SRES A1B and the eight GHG con-centrations scenarios are displayed in Fig. 2. SSTs exhibit a greater spread by 2100 in simulations employing different CH4scenarios, owing to the greater radiative forcing
of CH4 compared with N2O. However, results do not significantly differ from the A1B simulation (at most, there is a difference of 0.5 K between the CH4-8.5- and A1B-based
15
SSTs in 2100). The conclusions drawn in this study are therefore not impacted by using A1B-based SSTs for all simulations.
3 Results and discussion
In all eight CCM simulations performed for this study, global-mean total column ozone increases through the 21st century. The amount of increase is listed as ∆O3 in the
20
rightmost column of Table 1. In general, this increase is caused by a combination of a slowing of the gas-phase ozone loss cycles due to stratospheric cooling (Rosenfield et al., 2002), and decreasing concentrations of stratospheric chlorine and bromine re-sulting from the phase-out of halogenated ODSs under the Montreal Protocol (Bekki et al., 2011). The simulations with larger N2O surface concentrations lead to a smaller
25
ACPD
12, 17583–17605, 2012The sensitivity of stratospheric ozone
changes
L. E. Revell et al.
Title Page
Abstract Introduction
Conclusions References
Tables Figures
◭ ◮
◭ ◮
Back Close
Full Screen / Esc
Printer-friendly Version Interactive Discussion
Discussion
P
a
per
|
Dis
cussion
P
a
per
|
Discussion
P
a
per
|
Discussio
n
P
a
per
|
with larger CH4 surface concentrations lead to a larger increase in ozone (16.7 DU in CH4-8.5 compared with 4.4 DU in CH4-2.6).
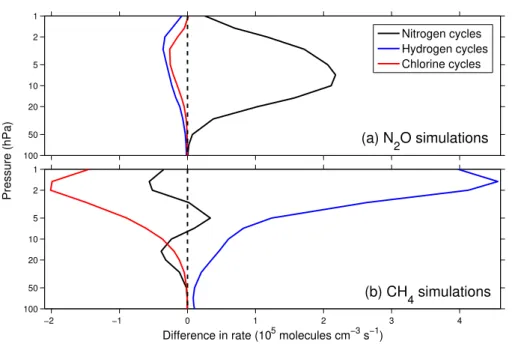
To examine changes in chemically-induced ozone destruction, the differences in the global-mean rates of the nitrogen, hydrogen and chlorine cycles in the 2090s decade between (a) the N2O-8.5 and N2O-2.6 simulations and (b) the CH4-8.5 and CH4-2.6
5
simulations are shown in Fig. 3. The ozone-depleting nitrogen cycles speed up with increased N2O throughout the upper and middle stratosphere, but remain largely un-changed in the lower stratosphere where concentrations of odd oxygen are diminished (Fig. 3a). Figure 3b shows that the ozone-depleting hydrogen cycles speed up with increased CH4, particularly in the upper stratosphere. The chlorine cycles slow, due to
10
an increase in the rate of Reaction (R1).
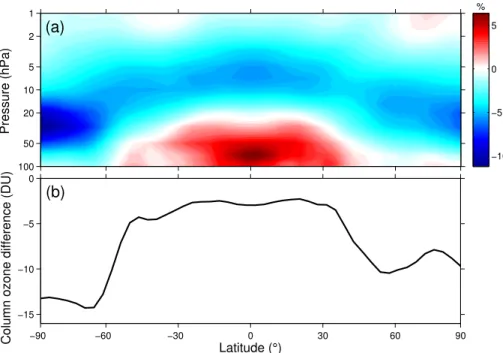
Figure 4a shows the difference between 2090s ozone in the N2O-8.5 and N2O-2.6
simulations as a function of latitude and pressure. Ozone is suppressed by as much as
∼5–10 % in the middle stratosphere in the N2O-8.5 simulation compared to the N2
O-2.6 simulation but is elevated by∼5 % in the tropical lower stratosphere (∼100–70 hPa).
15
The smaller ozone increase in the N2O-8.5 simulation is expected and due to enhanced
rates of the ozone-depleting nitrogen cycles. The elevated values in the tropical lower stratosphere are due to ozone production via Reactions (R4) and (R5). The difference between 2090s total column ozone in the N2O-8.5 and N2O-2.6 simulations is shown in
Fig. 4b as a function of latitude. Because the middle stratosphere dominates the ozone
20
column, total column ozone is decreased at all latitudes in the N2O-8.5 simulation
relative to the N2O-2.6 simulation (but less so in the tropical stratosphere).
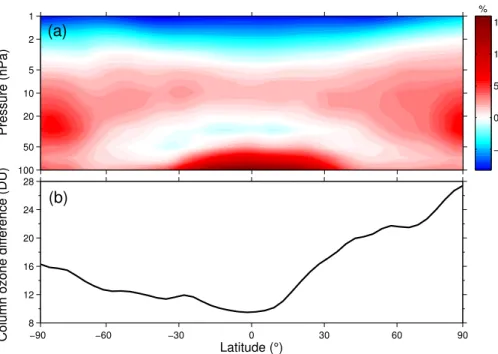
Figure 5 is similar to Fig. 4, but shows the differences between simulations CH4 -8.5 and CH4-2.6. In simulation CH4-8.5, ozone increases of up to∼15 % greater than
those in the CH4-2.6 simulation are seen throughout the stratosphere, except for in the
25
ACPD
12, 17583–17605, 2012The sensitivity of stratospheric ozone
changes
L. E. Revell et al.
Title Page
Abstract Introduction
Conclusions References
Tables Figures
◭ ◮
◭ ◮
Back Close
Full Screen / Esc
Printer-friendly Version Interactive Discussion
Discussion
P
a
per
|
Dis
cussion
P
a
per
|
Discussion
P
a
per
|
Discussio
n
P
a
per
to increased HOx in the lower stratosphere (leading to increased ozone production), and a slowing of the nitrogen ozone loss cycles at∼15 hPa (Fig. 3b). Figure 5b shows
that 2090s total column ozone exhibits a greater increase in all latitudes in simulation CH4-8.5 compared with simulation CH4-2.6, particularly in the Arctic.
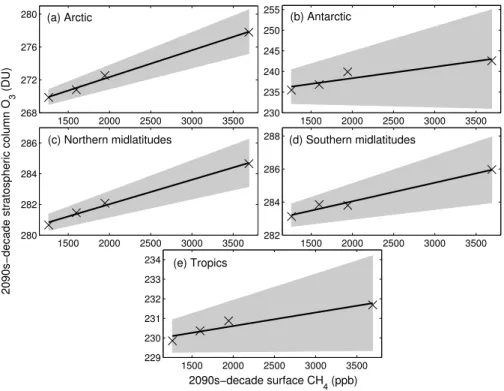
To test whether there is a linear relationship between stratospheric ozone at the
5
end of the 21st century, and the N2O or CH4 concentration at that time, linear fits to
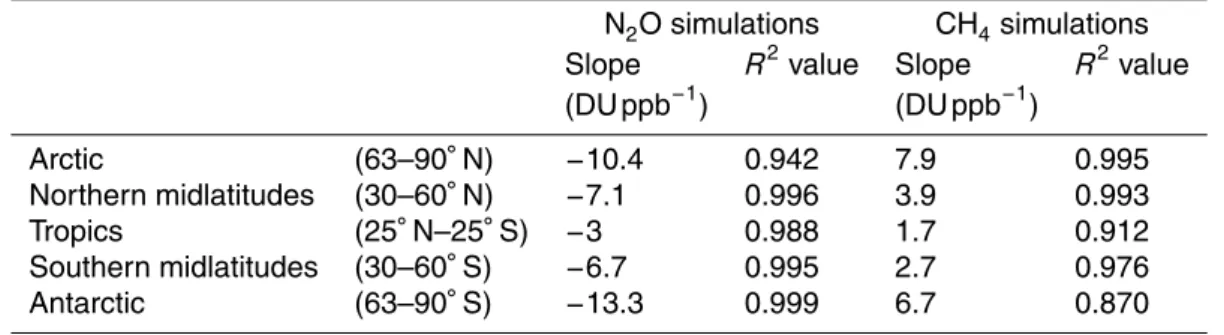
2090s-mean stratospheric ozone columns (1–100 hPa) as a function of N2O or CH4 concentrations were calculated in five regions of the stratosphere (Figs. 6 and 7). The slopes for the linear fits in Figs. 6 and 7 are given in Table 2, along with theR2values. The shaded regions in Figs. 6 and 7 represent the 95 % confidence interval calculated
10
for the slope and intercept of the linear regression models.
As shown in Fig. 6 and Table 2, the slopes for the linear fits are negative in all regions of the stratosphere, and theR2values exceed 0.94 everywhere. All fits are statistically significant from zero at the 95 % confidence level, indicating a strong linear relationship between stratospheric ozone abundance and N2O concentrations. The linear fits
be-15
tween ozone and CH4in Fig. 7 all have positive slopes, and are statistically significantly
different from zero at the 95 % confidence level in all regions of the stratosphere except for the Antarctic, where theR2 value is 0.87. Elsewhere, theR2 value exceeds 0.91. For both the N2O and CH4simulations, sensitivities in the polar regions are enhanced
compared with the tropics and midlatitudes.
20
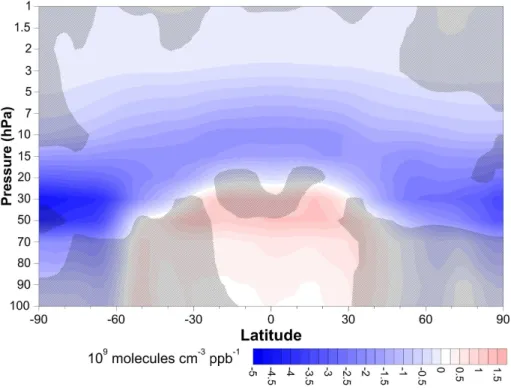
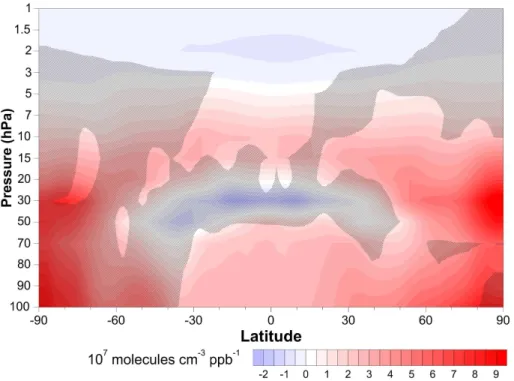
Figures 8 and 9 show the slopes of linear fits to 2090s-ozone vs. N2O or CH4
sur-face concentrations as a function of pressure and latitude. Regions where the slope is not statistically significantly different from zero at the 95 % confidence bounds are hatched. Figure 8 shows that in the polar regions and throughout most of the middle stratosphere, ozone demonstrates a statistically significant negative linear relationship
25
with N2O. There is a positive correlation in the tropical lower stratosphere, where en-hanced N2O leads to ozone production. Figure 9 shows that ozone decreases linearly
with increasing CH4in the upper stratosphere, and that this relationship is statistically
ACPD
12, 17583–17605, 2012The sensitivity of stratospheric ozone
changes
L. E. Revell et al.
Title Page
Abstract Introduction
Conclusions References
Tables Figures
◭ ◮
◭ ◮
Back Close
Full Screen / Esc
Printer-friendly Version Interactive Discussion
Discussion
P
a
per
|
Dis
cussion
P
a
per
|
Discussion
P
a
per
|
Discussio
n
P
a
per
|
ozone and CH4 are also found, for example, through much of the tropical, northern-midlatitude and Arctic stratosphere, where ozone increases with increasing CH4.
These linear relationships between ozone and N2O and CH4over the range of RCP
scenarios tested here suggest that perturbations to either stratospheric column ozone (using the results presented in Figs. 6 and 7) or to vertically resolved ozone (using the
5
results presented in Figs. 8 and 9) can be incorporated into simple models of strato-spheric ozone to capture the changes in ozone resulting from changes in N2O and CH4.
4 Conclusions
Total column ozone increases through the 21st century in all eight CCM simulations
10
presented here. Larger increases are observed in simulations with low N2O or high CH4
concentrations. N2O decreases stratospheric ozone abundance by increasing the rate
of the ozone-depleting nitrogen cycles. Although mid- and lower-stratospheric ozone increase in response to increased CH4, upper stratospheric ozone decreases due to
an increase in the rate of the ozone-depleting hydrogen cycles. Furthermore, we have
15
shown that at the end of the 21st century, stratospheric column ozone decreases lin-early with increasing surface N2O concentrations in all regions of the stratosphere. In
contrast, stratospheric column ozone increases linearly with increasing CH4
concen-trations, however this relationship is not statistically significant at the 95 % confidence level in the Antarctic stratosphere. We have also shown the vertically-resolved
relation-20
ship between ozone and N2O and CH4. Our conclusions are derived from simulations
based on a single CO2 concentration scenario, and ozone may not exhibit this linear
sensitivity under different CO2scenarios; this will be the subject of future work.
ACPD
12, 17583–17605, 2012The sensitivity of stratospheric ozone
changes
L. E. Revell et al.
Title Page
Abstract Introduction
Conclusions References
Tables Figures
◭ ◮
◭ ◮
Back Close
Full Screen / Esc
Printer-friendly Version Interactive Discussion
Discussion
P
a
per
|
Dis
cussion
P
a
per
|
Discussion
P
a
per
|
Discussio
n
P
a
per
References
Bekki, S., Bodeker, G. E., Bais, A. F., Butchart, N., Eyring, V., Fahey, D. W., Kinnison, D. E., Langematz, U., Mayer, B., Portmann, R. W., Rozanov, E., Braesicke, P., Charlton-Perez, A. J., Chubarova, N. E., Cionni, I., Diaz, S. B., Gillett, N. P., Giorgetta, M. A., Komala, N., Lef `evre, F., McLandress, C., Perlwitz, J., Peter, T., and Shibata, K.: Future ozone and its impact on 5
surface UV, in: Scientific Assessment of Ozone Depletion: 2010, Global Ozone Research and Monitoring Project – Report No. 52, chapter 3, 516 pp., World Meteorological Organization, Geneva, Switzerland, 2011.
Brasseur, G. and Solomon, S.: Aeronomy of the Middle Atmosphere, 3rd Edn., Dordrecht, The Netherlands, 644 pp., 2005.
10
Crutzen, P. J.: The influence of nitrogen oxides on the atmospheric ozone content, Q. J. Roy. Meteor. Soc., 96, 320–325, 1970.
Daniel, J. S., Velders, G. J. M., Douglass, A. R., Forster, P. M. D., Hauglustaine, D. A., Isak-sen, I. S. A., Kuijpers, L. J. M., McCulloch, A., and Wallington, T. J.: Halocarbon scenar-ios, ozone depletion potentials, and global warming potentials, in: Scientific Assessment 15
of Ozone Depletion: 2006, Global Ozone Research and Monitoring Project–Report No. 50, chapter 8, 572 pp., World Meteorological Organization, Geneva, Switzerland, 2007.
Egorova, T. A., Rozanov, E. V., Zubov, V. A., and Karol, I. L.: Model for investigating ozone trends (MEZON), Izv. Atmos. Ocean. Phys., 39, 277–292, 2003.
Eyring, V., Cionni, I., Bodeker, G. E., Charlton-Perez, A. J., Kinnison, D. E., Scinocca, J. F., 20
Waugh, D. W., Akiyoshi, H., Bekki, S., Chipperfield, M. P., Dameris, M., Dhomse, S., Frith, S. M., Garny, H., Gettelman, A., Kubin, A., Langematz, U., Mancini, E., Marchand, M., Nakamura, T., Oman, L. D., Pawson, S., Pitari, G., Plummer, D. A., Rozanov, E., Shep-herd, T. G., Shibata, K., Tian, W., Braesicke, P., Hardiman, S. C., Lamarque, J. F., Mor-genstern, O., Pyle, J. A., Smale, D., and Yamashita, Y.: Multi-model assessment of strato-25
spheric ozone return dates and ozone recovery in CCMVal-2 models, Atmos. Chem. Phys., 10, 9451–9472, doi:10.5194/acp-10-9451-2010, 2010.
Fleming, E. L., Jackman, C. H., Stolarski, R. S., and Douglass, A. R.: A model study of the impact of source gas changes on the stratosphere for 1850–2100, Atmos. Chem. Phys., 11, 8515–8541, doi:10.5194/acp-11-8515-2011, 2011.
30
ACPD
12, 17583–17605, 2012The sensitivity of stratospheric ozone
changes
L. E. Revell et al.
Title Page
Abstract Introduction
Conclusions References
Tables Figures
◭ ◮
◭ ◮
Back Close
Full Screen / Esc
Printer-friendly Version Interactive Discussion
Discussion
P
a
per
|
Dis
cussion
P
a
per
|
Discussion
P
a
per
|
Discussio
n
P
a
per
|
Global Climate System: Issues Related to Hydrofluorocarbons and Perfluorocarbons, Cam-bridge University Press, UK, Geneva, 2005.
Lanzendorf, E. J., Hanisco, T. F., Wennberg, P. O., Cohen, R. C., Stimpfle, R. M., Ander-son, J. G., Gao, R. S., Margitan, J. J., and Bui, T. P.: Establishing the dependence of
[HO2]/[OH] on temperature, halogen loading, O3, and NOx based on in situ measurements
5
from the NASA-ER2, J. Phys. Chem. A, 105, 1535–1542, 2001.
Lee, A. M., Jones, R. L., Kilbane-Dawe, I., and Pyle, J. A.: Diagnosing ozone loss in the extra-tropical lower stratosphere, J. Geophys. Res., 107, D114110, doi:10.1029/2001JD000538, 2002.
Manzini, E., McFarlane, N. A., and McLandress, C.: Impact of the Doppler spread parameteri-10
zation on the simulation of the middle atmosphere circulation using the MA/ECHAM4 general circulation model, J. Geophys. Res., 102, 25751–25762, 1997.
Meinshausen, M., Raper, S. C. B., and Wigley, T. M. L.: Emulating coupled atmosphere-ocean and carbon cycle models with a simpler model, MAGICC6 – Part 1: Model description and calibration, Atmos. Chem. Phys., 11, 1417–1456, doi:10.5194/acp-11-1417-2011, 2011. 15
Nakicenovic, N. and Swart, R. (eds.): IPCC Special Report on Emissions Scenarios, Cambridge University Press, Cambridge, UK, 2000.
Oman, L. D., Waugh, D. W., Kawa, S. R., Stolarski, R. S., Douglass, A. R. and Newman, P. A.: Mechanisms and feedback causing changes in upper stratospheric ozone in the 21st century, J. Geophys. Res., 115, D05303, doi:10.1029/2009JD012397, 2010.
20
Plummer, D. A., Scinocca, J. F., Shepherd, T. G., Reader, M. C., and Jonsson, A. I.: Quantify-ing the contributions to stratospheric ozone changes from ozone depletQuantify-ing substances and greenhouse gases, Atmos. Chem. Phys., 10, 8803–8820, doi:10.5194/acp-10-8803-2010, 2010.
Portmann, R. W. and Solomon, S.: Indirect radiative forcing of the ozone layer during the 21st 25
century, Geophys. Res. Lett., 34, L02813, doi:10.1029/2006GL028252, 2007.
Ravishankara, A. R., Daniel, J. S., and Portmann, R. W.: Nitrous oxide (N2O): the
dom-inant ozone-depleting substance emitted in the 21st century, Science, 326, 123–125, doi:10.1126/science.1176985, 2009.
Revell, L. E., Bodeker, G. E., Smale, D., Lehmann, R., Huck, P. E., Williamson, B. E., Rozanov, 30
E., and Struthers, H.: The effectiveness of N2O in depleting stratospheric ozone, Geophys.
ACPD
12, 17583–17605, 2012The sensitivity of stratospheric ozone
changes
L. E. Revell et al.
Title Page
Abstract Introduction
Conclusions References
Tables Figures
◭ ◮
◭ ◮
Back Close
Full Screen / Esc
Printer-friendly Version Interactive Discussion
Discussion
P
a
per
|
Dis
cussion
P
a
per
|
Discussion
P
a
per
|
Discussio
n
P
a
per
Rosenfield, J. E. and Douglass, A. R.: Doubled CO2 effects on NOy in a coupled 2D model,
Geophys. Res. Lett., 25, 4381–4384, 1998.
Rosenfield, J. E., Douglass, A. R., and Considine, D. B.: The impact of increasing carbon diox-ide on ozone recovery, J. Geophys. Res., 107, D64049, doi:10.1029/2001JD000824, 2002. Schraner, M., Rozanov, E., Schnadt Poberaj, C., Kenzelmann, P., Fischer, A. M., Zubov, V., 5
Luo, B. P., Hoyle, C. R., Egorova, T., Fueglistaler, S., Br ¨onnimann, S., Schmutz, W., and Pe-ter, T.: Technical Note: Chemistry-climate model SOCOL: version 2.0 with improved transport and chemistry/microphysics schemes, Atmos. Chem. Phys., 8, 5957–5974, doi:10.5194/acp-8-5957-2008, 2008.
SPARC CCMVal: SPARC Report on the Evaluation of Chemistry-Climate Models, edited by: 10
Eyring, V., Shepherd, T. G., and Waugh, D. W., SPARC Report No. 5, WCRP-132, WMO/TD-No. 1526, available at: http://www.atmosp.physics.utoronto.ca/SPARC, 2010.
van Vuuren, D. P., Edmonds, J., Kainuma, M., Riahi, K., Thomson, A., Hibbard, K., Hurtt, G. C., Kram, T., Krey, V., Lamarque, J. F., Masui, T., Meinshausen, M., Nakicenovic, N., Smith, S. J., and Rose, S. K.: The representative concentration pathways: an overview, Climatic Change, 15
109, 5–31, doi:10.1007/s10584-011-0148-z, 2011.
World Meteorological Organization: Scientific Assessment of Ozone Depletion: 1998, WMO Global Ozone Research and Monitoring Project – Report No. 44, Geneva, 1998.
Zubov, V., Rozanov, E., and Schlesinger, M.: Hybrid scheme for three-dimensional advective transport, Mon. Weather Rev., 127, 1335–1346, 1999.
ACPD
12, 17583–17605, 2012The sensitivity of stratospheric ozone
changes
L. E. Revell et al.
Title Page
Abstract Introduction
Conclusions References
Tables Figures
◭ ◮
◭ ◮
Back Close
Full Screen / Esc
Printer-friendly Version Interactive Discussion
Discussion
P
a
per
|
Dis
cussion
P
a
per
|
Discussion
P
a
per
|
Discussio
n
P
a
per
|
Table 1.Summary of scenarios for the CCM simulationsa.
Simulation N2O scenario CH4scenario ∆O3(DU)b
N2O-2.6 RCP 2.6 SRES A1B 10.0
N2O-4.5 RCP 4.5 SRES A1B 7.6
N2O-6.0 RCP 6.0 SRES A1B 4.9
N2O-8.5 RCP 8.5 SRES A1B 4.3
CH4-2.6 SRES A1B RCP 2.6 4.4
CH4-4.5 SRES A1B RCP 4.5 5.2
CH4-6.0 SRES A1B RCP 6.0 9.1
CH4-8.5 SRES A1B RCP 8.5 16.7
aAll simulations used the IPCC SRES A1B scenario for CO
2and adjusted
A1 scenario for halocarbons;
bChange in global-mean total column ozone through the 21st century
ACPD
12, 17583–17605, 2012The sensitivity of stratospheric ozone
changes
L. E. Revell et al.
Title Page
Abstract Introduction
Conclusions References
Tables Figures
◭ ◮
◭ ◮
Back Close
Full Screen / Esc
Printer-friendly Version Interactive Discussion
Discussion
P
a
per
|
Dis
cussion
P
a
per
|
Discussion
P
a
per
|
Discussio
n
P
a
per
Table 2.Linear regression model slopes andR2values.
N2O simulations CH4simulations
Slope R2value Slope R2value
(DU ppb−1) (DU ppb−1)
Arctic (63–90◦N)
−10.4 0.942 7.9 0.995
Northern midlatitudes (30–60◦N)
−7.1 0.996 3.9 0.993
Tropics (25◦N–25◦S)
−3 0.988 1.7 0.912
Southern midlatitudes (30–60◦S)
−6.7 0.995 2.7 0.976
Antarctic (63–90◦S)
ACPD
12, 17583–17605, 2012The sensitivity of stratospheric ozone
changes
L. E. Revell et al.
Title Page
Abstract Introduction
Conclusions References
Tables Figures
◭ ◮
◭ ◮
Back Close
Full Screen / Esc
Printer-friendly Version Interactive Discussion
Discussion
P
a
per
|
Dis
cussion
P
a
per
|
Discussion
P
a
per
|
Discussio
n
P
a
per
|
300 320 340 360 380 400 420 440
(a) N
2O
SRES A1B RCP 8.5 RCP 6.0 RCP 4.5 RCP 2.6
2010 2030 2050 2070 2090
1000 1500 2000 2500 3000 3500 4000
(b) CH
4
Concentration (ppb)
Year
ACPD
12, 17583–17605, 2012The sensitivity of stratospheric ozone
changes
L. E. Revell et al.
Title Page
Abstract Introduction
Conclusions References
Tables Figures
◭ ◮
◭ ◮
Back Close
Full Screen / Esc
Printer-friendly Version Interactive Discussion
Discussion
P
a
per
|
Dis
cussion
P
a
per
|
Discussion
P
a
per
|
Discussio
n
P
a
per
2010 2020 2030 2040 2050 2060 2070 2080 2090 2100
288.5 289 289.5 290 290.5 291 291.5 292 292.5
Sea surface temperature (K)
Year SRES A1B
N
2O−2.6
N
2O−4.5
N
2O−6.0
N
2O−8.5
CH
4−2.6
CH
4−4.5
CH
4−6.0
CH
4−8.5
ACPD
12, 17583–17605, 2012The sensitivity of stratospheric ozone
changes
L. E. Revell et al.
Title Page
Abstract Introduction
Conclusions References
Tables Figures
◭ ◮
◭ ◮
Back Close
Full Screen / Esc
Printer-friendly Version Interactive Discussion
Discussion
P
a
per
|
Dis
cussion
P
a
per
|
Discussion
P
a
per
|
Discussio
n
P
a
per
|
1 2 5 10 20 50 100
(a) N2O simulations
Pressure (hPa)
−2 −1 0 1 2 3 4
1 2 5 10 20 50 100
(b) CH4 simulations
Difference in rate (105 molecules cm−3 s−1)
Nitrogen cycles Hydrogen cycles Chlorine cycles
Fig. 3. (a)Global-mean contribution to ozone loss from the nitrogen, hydrogen and chlorine
catalytic cycles in the 2090s decade in the N2O-8.5 simulation, minus the same quantities for
the N2O-2.6 simulation.(b)Global-mean contribution to ozone loss from catalytic cycles in the
ACPD
12, 17583–17605, 2012The sensitivity of stratospheric ozone
changes
L. E. Revell et al.
Title Page
Abstract Introduction
Conclusions References
Tables Figures
◭ ◮
◭ ◮
Back Close
Full Screen / Esc
Printer-friendly Version Interactive Discussion
Discussion
P
a
per
|
Dis
cussion
P
a
per
|
Discussion
P
a
per
|
Discussio
n
P
a
per
Pressure (hPa)
(a)
1
2
5
10
20
50
100
−10 −5 0 5
−90 −60 −30 0 30 60 90
−15 −10 −5 0
Latitude (°)
Column ozone difference (DU)
(b)
%
Fig. 4. (a)N2O-8.5 ozone minus N2O-2.6 ozone in the 2090s decade, calculated as a
percent-age of ozone in the N2O-2.6 simulation.(b)2090s-decade N2O-8.5 total column ozone minus
ACPD
12, 17583–17605, 2012The sensitivity of stratospheric ozone
changes
L. E. Revell et al.
Title Page
Abstract Introduction
Conclusions References
Tables Figures
◭ ◮
◭ ◮
Back Close
Full Screen / Esc
Printer-friendly Version Interactive Discussion
Discussion
P
a
per
|
Dis
cussion
P
a
per
|
Discussion
P
a
per
|
Discussio
n
P
a
per
|
Pressure (hPa)
(a)
1
2
5
10
20
50
100
−5 0 5 10 15
−90 −60 −30 0 30 60 90
8 12 16 20 24 28
Latitude (°)
Column ozone difference (DU)
(b)
%
Fig. 5. (a)CH4-8.5 ozone minus CH4-2.6 ozone in the 2090s decade, calculated as a
percent-age of ozone in the CH4-2.6 simulation.(b)2090s-decade CH4-8.5 total column ozone minus
ACPD
12, 17583–17605, 2012The sensitivity of stratospheric ozone
changes
L. E. Revell et al.
Title Page
Abstract Introduction
Conclusions References
Tables Figures
◭ ◮
◭ ◮
Back Close
Full Screen / Esc
Printer-friendly Version Interactive Discussion
Discussion
P
a
per
|
Dis
cussion
P
a
per
|
Discussion
P
a
per
|
Discussio
n
P
a
per
340 360 380 400 420
255 265 275 285
(a) Arctic
340 360 380 400 420
230 235 240 245
(b) Antarctic
340 360 380 400 420
276 278 280 282 284 286
(c) Northern midlatitudes
2090s−decade stratospheric column O
3
(DU)
340 360 380 400 420
278 280 282 284 286 288
(d) Southern midlatitudes
340 360 380 400 420
226 228 230 232
(e) Tropics
2090s−decade surface N
2O (ppb)
Fig. 6. (a)2090s-mean Arctic (63–90◦N) stratospheric column ozone (1–100 hPa) vs.
2090s-mean surface N2O for the four N2O simulations (crosses), fitted with a simple linear
regres-sion model (black line). The grey shaded region indicates the 95 % confidence interval for the
slope and intercept of the regression model.(b–e)As for(a), but for:(b)the Antarctic (63–90◦
S);(c) northern midlatitudes (30–60◦
N);(d) southern midlatitudes (30–60◦
S);(e) the tropics
ACPD
12, 17583–17605, 2012The sensitivity of stratospheric ozone
changes
L. E. Revell et al.
Title Page
Abstract Introduction
Conclusions References
Tables Figures
◭ ◮
◭ ◮
Back Close
Full Screen / Esc
Printer-friendly Version Interactive Discussion
Discussion
P
a
per
|
Dis
cussion
P
a
per
|
Discussion
P
a
per
|
Discussio
n
P
a
per
|
1500 2000 2500 3000 3500
268 272 276
280 (a) Arctic
1500 2000 2500 3000 3500
230 235 240 245 250 255
(b) Antarctic
1500 2000 2500 3000 3500
280 282 284
286 (c) Northern midlatitudes
2090s−decade stratospheric column O
3
(DU)
1500 2000 2500 3000 3500
282 284 286
288 (d) Southern midlatitudes
1500 2000 2500 3000 3500
229 230 231 232 233
234 (e) Tropics
2090s−decade surface CH
4 (ppb)
Fig. 7.Similar to Fig. 6, but for 2090s-mean stratospheric column ozone vs. 2090s-mean
ACPD
12, 17583–17605, 2012The sensitivity of stratospheric ozone
changes
L. E. Revell et al.
Title Page
Abstract Introduction
Conclusions References
Tables Figures
◭ ◮
◭ ◮
Back Close
Full Screen / Esc
Printer-friendly Version Interactive Discussion
Discussion
P
a
per
|
Dis
cussion
P
a
per
|
Discussion
P
a
per
|
Discussio
n
P
a
per
Fig. 8.Slopes from simple linear regression models fitted to mean ozone vs.
2090s-mean surface N2O for all latitudes and all pressure levels between 1–100 hPa, for the four N2O
simulations. Hatching indicates that the slope was not statistically significantly different from
ACPD
12, 17583–17605, 2012The sensitivity of stratospheric ozone
changes
L. E. Revell et al.
Title Page
Abstract Introduction
Conclusions References
Tables Figures
◭ ◮
◭ ◮
Back Close
Full Screen / Esc
Printer-friendly Version Interactive Discussion
Discussion
P
a
per
|
Dis
cussion
P
a
per
|
Discussion
P
a
per
|
Discussio
n
P
a
per
|
Fig. 9.Similar to Fig. 8, but the slopes are from simple linear regression models fitted to