www.atmos-meas-tech.net/9/4997/2016/ doi:10.5194/amt-9-4997-2016
© Author(s) 2016. CC Attribution 3.0 License.
Radiocarbon analysis of stratospheric CO
2
retrieved
from AirCore sampling
Dipayan Paul1, Huilin Chen1,2, Henk A. Been1, Rigel Kivi3, and Harro A. J. Meijer1
1Centre for Isotope Research, Energy and Sustainability Research Institute Groningen, University of Groningen,
Nijenborgh-4, 9747 AG Groningen, the Netherlands
2Cooperative Institute for Research in Environmental Sciences (CIRES), University of Colorado, Boulder, Colorado, USA 3Finnish Meteorological Institute, Arctic Research, Sodankylä, Finland
Correspondence to:Harro A. J. Meijer ([email protected])
Received: 4 December 2015 – Published in Atmos. Meas. Tech. Discuss.: 19 January 2016 Revised: 12 September 2016 – Accepted: 14 September 2016 – Published: 11 October 2016
Abstract. Radiocarbon (14C) is an important atmospheric tracer and one of the many used in the understanding of the global carbon budget, which includes the greenhouse gases CO2and CH4. Measurement of radiocarbon in atmospheric
CO2generally requires the collection of large air samples (a
few liters) from which CO2is extracted and then the
concen-tration of radiocarbon is determined using accelerator mass spectrometry (AMS). However, the regular collection of air samples from the stratosphere, for example using aircraft and balloons, is prohibitively expensive.
Here we describe radiocarbon measurements in strato-spheric CO2collected by the AirCore sampling method.
Air-Core is an innovative atmospheric sampling system, which comprises a long tube descending from a high altitude with one end open and the other closed, and it has been demon-strated to be a reliable, cost-effective sampling system for high-altitude profile (up to ≈30 km) measurements of CH4
and CO2. In Europe, AirCore measurements have been
be-ing performed on a regular basis near Sodankylä (northern Finland) since September 2013. Here we describe the analy-sis of samples from two such AirCore flights made there in July 2014, for determining the radiocarbon concentration in stratospheric CO2. The two AirCore profiles were collected
on consecutive days. The stratospheric part of the AirCore was divided into six sections, each containing ≈35 µg CO2
(≈9.6 µgC), and stored in a stratospheric air subsampler con-structed from 1/4 in. coiled stainless steel tubing (≈3 m). A small-volume extraction system was constructed that enabled
>99.5 % CO2extraction from the stratospheric air samples.
Additionally, a new small-volume high-efficiency
graphiti-zation system was constructed for graphitigraphiti-zation of these ex-tracted CO2 samples, which were measured at the
Gronin-gen AMS facility. Since the stratospheric samples were very similar in mass, reference samples were also prepared in the same mass range for calibration and contamination correc-tion purposes. The results show that the114CO2values from
tropopause up to about 19(±1) km for the sample collected on 15 July was 18±6 ‰ (samples 1–4), very similar to the current tropospheric value. On the other hand,114CO2
val-ues from tropopause up to about 18(±1) km for the sample collected on 16 July (samples 1–4) showed a large gradi-ent from−62 to 21 ‰. The next sample in the profile, cor-responding to about 18(±1)–22(±2) km (one sample from each profile), shows slight enrichment of 80±20 ‰. The last section from both profiles, containing air from the upper stratosphere, was contaminated with pre-fill air.
1 Introduction
Carbon dioxide is a naturally occurring greenhouse gas produced mainly through respiration by aerobic organisms and decay of organic materials. It is also the product of com-bustion of any carbon-containing compound. Carbon in car-bon dioxide exists in the form of three naturally occurring isotopes, i.e., 12C,13C, and 14C. Radiocarbon (14C) is the only naturally occurring radioactive isotope of carbon (half-life,t1/2=5730±40 years), which is continuously produced
through the reaction of thermalized neutrons from cosmic radiations with 14N in the upper atmosphere (Lingenfelter, 1963; Masarik and Beer, 1999). The produced 14C
com-bines with oxygen to produce 14CO
2, which forms a trace
component of atmospheric CO2(presently14CO2/12CO2≈
1.2×10⁻¹⁰%). 14CO2 is an important atmospheric tracer,
which helps in the understanding of the levels of anthro-pogenic emissions from fossil fuels. This is due to the fact that fossil fuel, and thus also CO2from combusting it, is
vir-tually radiocarbon-free. This CO2from fossil fuel dilutes the
atmospheric14CO2concentration upon release.
The concentration of CO2 in the atmosphere has had an
observed annual rise in recent years of≈2 ppm year−1 (Hart-mann et al., 2013; Dlugokencky and Tans, 2016). This rise in the concentration of CO2due to the burning of fossil
fu-els is at present the main cause for the decrease in the ra-diocarbon concentration in atmospheric CO2. Aircraft
sam-pling of atmospheric CO2is regularly performed at various
altitudes, but unfortunately air samples are only collected up to the upper troposphere/lower stratosphere (Sweeney et al., 2015; Machida et al., 2008; Brenninkmeijer et al., 2007, 1995). Although balloon-based sampling has been demon-strated as a method for collecting stratospheric air for mea-surements of radiocarbon in stratospheric CO2(Kanu et al.,
2016; Ashenfelter et al., 1972; Nakamura et al., 1992, 1994; Hagemann et al., 1959), this method of sampling is extremely expensive and difficult to sustain for longer periods. Here we describe the use of the AirCore sampling method (Karion et al., 2010) as a viable and affordable alternative for sam-pling stratospheric air for the measurements of radiocarbon in stratospheric CO2. As AirCore forms only a modest
pay-load (∼3.6 kg), it can be flown with a small-size balloon, thus saving considerably on launching costs and infrastruc-ture. The stratospheric part of the AirCore can be divided into several isobaric sub-segments, thus allowing the determina-tion of radiocarbon at different altitude ranges. Although the sample sizes obtained through AirCore sampling are small (only∼50 mL,∼10 µgC), they are just enough for perform-ing quantitative radiocarbon measurements at our accelerator mass spectrometry (AMS) facility.
1.1 Sampling
Regular AirCore profiles of CO2, CH4, and CO have been
made near Sodankylä (in northern Finland, 67.4◦N, 26.6◦E) since September 2013 (Chen et al., 2016). Normally, the air contained in an AirCore is not stored. We have, however,
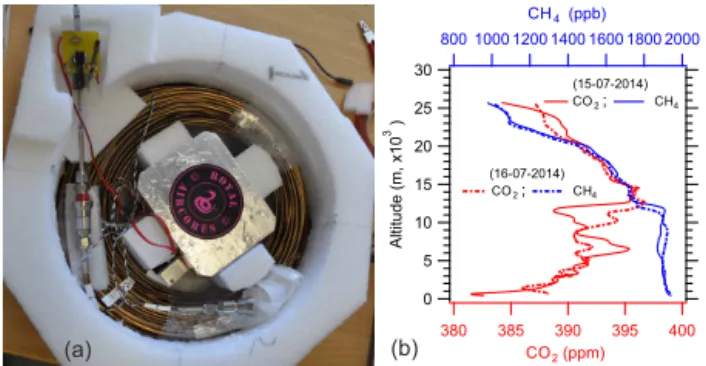
(a) (b)
30
25 20
15 10
5 0
Altitude (m, x10
3 )
400 395 390 385 380
CO2 (ppm)
2000 1800 1600 1400 1200 1000 800
CH4 (ppb)
(16-07-2014) CO2 ; CH4
(15-07-2014) CO2 ; CH4
Figure 1. (a)Picture of an AirCore, used during the sampling
cam-paign at Sodankylä, constructed from long thin walled stainless steel tubing (≈100 m long, wall thickness of 0.254 mm).(b) Cor-rected vertical concentration profiles of CO2(red) and CH4(blue)
retrieved through AirCore samplings performed on 15 July 2014 (solid line) and 16 July 2014 (dashed line) at Sodankylä. Note the different scale span for CO2and CH4.
collected the stratospheric part of the AirCore samples for several selected AirCore flights using a stratospheric air sub-sampler described elsewhere (Mrozek et al., 2016). Briefly, the AirCore that has been flown in Sodankylä is constructed from two pieces of stainless steel tubing with an outer di-ameter of 0.64 cm (1/4 in. and ∼40 m long) and 0.32 cm (1/8 in. and ∼60 m long), respectively. The wall thickness for both pieces is 0.025 cm (0.01 in.). The estimated volume of the AirCore is ∼1400 mL. The AirCore, before releas-ing with the help of a balloon, is first filled with a standard dry “fill gas” with known CO2, CH4, and CO concentrations
(CO2=386.10±0.09 ppm; CH4=1880±2 ppb; CO
delib-erately spiked to 7972±5 ppb). The fill gas is a compressed air cylinder containing dry ambient air (sampled on 27 June 2013 at Sodankylä, Finland) spiked with carbon monoxide. It should thus contain CO2with contemporary levels of
radio-carbon. The accurate determination of the radiocarbon con-tent in CO2of the fill gas was initially not deemed essential
for this work, and has thus not been performed. The AirCore is then released with one end open into atmosphere. As the AirCore travels higher in the atmosphere, the fill gas inside the AirCore is evacuated due to the drop in pressure. Dur-ing its descent through the atmosphere, the evacuated Air-Core equilibrates with the ambient pressure, and therefore the tube gradually fills itself with air from its surroundings. The open end of the AirCore is then closed automatically upon landing, preserving the collected air column until anal-ysis is performed, which is typically within a few hours after the AirCore has landed and is recovered.
Several AirCore profiles were collected at Sodankylä dur-ing a campaign in July 2014, out of which two stratospheric air profiles (collected on 15 July and 16 July 2014) were pre-served for radiocarbon measurements of stratospheric CO2
AirCore is initially filled with a fill gas before release, there is a small fraction of the fill gas still remaining in the Air-Core that is not evacuated completely. This leftover fraction of fill gas contaminates the air from the highest sampled al-titude. Fortunately, the impact on the samples from the high-est altitude can be accurately corrected by making use of the CO measurements that have been performed in parallel to CO2and CH4, and the fact that the fill gas contains about a
hundredfold as much CO (7972±5 ppb) than the natural air. In this way the measured CO is a direct measure of the fill gas fraction. The correction takes advantage of the fact that the CO concentration of stratospheric air is low (∼15 ppb or ∼0.2 % of the CO concentration of the fill air). We de-rive a good approximation of the percentage of the fill air and the stratospheric air based on the measured CO concen-tration of the mixture of the stratospheric air and the fill air. Details of the corrections will be given in Chen et al. (2016). These corrected atmospheric profiles of CO2(red, solid and
dashed lines) and CH4(blue, solid and dashed lines) from the
two AirCore samplings are shown in Fig. 1b. The CO2
pro-file shows the variability in the CO2concentration
through-out the atmosphere, whereas the CH4concentration is rather
constant in the troposphere and drops continuously with in-creasing altitude in the stratosphere, predominantly due to destruction by oxidation.
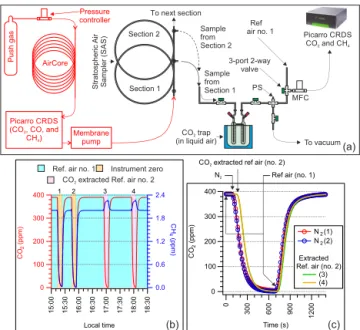
The AirCore, containing the vertical atmospheric profile, was connected to a cavity ring-down spectrometer (CRDS, Picarro Inc., CA model: G2401) for simultaneous measure-ments of the CO2, CH4, and CO concentrations. The
sam-pling end of the AirCore was connected to a standard dry “push gas” line (containing the same CO-spiked fill gas again), and the other end was connected to the CRDS an-alyzer. The sampled air column inside the AirCore was then gently “pushed” out with the push gas into the CRDS analyzer. The exhaust from the CRDS analyzer was con-nected to a stratospheric air subsampler (SAS) (Mrozek et al., 2016). The sequence of transfer of the stratospheric air from AirCore into the SAS is also illustrated in Fig. 2a (marked in red) of the following section. The SAS built at the University of Groningen, similar to the one described in Mrozek et al. (2016), comprises a series of six pieces of connected stainless steel tubing (Swagelok, o.d.=6.35 mm, i.d.=4.57 mm,≈50 mL), with each section measuring 3 m. The tubing sections were joined by three-port two-way valves (Swagelok SS-43GXS4), which allows uninterrupted transfer of the AirCore content into the SAS and subsequent isolation of each section for a desired analysis later. Each section in the SAS thus represented an integrated sample from a determinable altitude range. Each section contained
≈50 mL stratospheric air (at standard temperature and pres-sure (STP)), with ≈35 µg CO2 (≈9.6 µgC). CO2 samples
from each section of the SAS were later extracted and pro-cessed for 14C measurements at the Centre for Isotope Re-search (CIO), Groningen, using accelerator mass spectrome-try (AMS).
Section 1 Section 2
To next section
Sample from Section 1 Sample from Section 2
To vacuum Ref
air no. 1 Picarro CRDS
CO and CH2 4
CO trap2
(in liquid air) PS
MFC
Stratospheric
Air
Sampler (
S
A
S
)
3-port 2-way valve AirCore
Push gas
Picarro CRDS (CO , CO, and
CH )4 Membranepump
Pressure controller
(a)
400
300
200
100
0
C
O2
(ppm)
1200
900
600
300
0
Time (s) N2 (1)
N2 (2)
Extracted Ref. air (no.2)
(3) (4)
15:00 15:30 16:00 16:30 17:00 17:30 18:00 18:30
Local time
400
300
200
100
0
C
O2
(ppm)
2.4
1.8
1.2
0.6
0.0
C
H
4 (ppm)
1 2 3 4
Ref. air no. 1 Instrument zero
CO extracted Ref. air no. 22
(b) (c)
N2
CO extracted ref air (no. 2) 2
Ref air (no. 1)
Figure 2. (a)Schematic of the sample transfer procedure from the
AirCore into the SAS (marked in red) and the extraction system used for the extraction of CO2from stratospheric air contained in
the SAS. The CO2trap was submerged in a liquid air bath, which al-lowed quantitative freezing of CO2and avoided co-freezing of CH4
and O2. Using a CRDS analyzer (Picarro G2301), the concentration
of CH4in the CO2-extracted air was determined. The components
indicated with abbreviations are as follows: MFC, mass flow con-troller; PS, pressure sensor.(b)An example time series showing a control sampler filled consecutively with N2(instrument zero, first
two shown with an orange background) and reference air (no. 2, CO2-extracted, last two shown with a pink background) to
evalu-ate the extraction efficiency at a flow revalu-ate of 3 sccm. Reference air (no. 1) is directed through the Picarro analyzer when the extraction system is being made ready for the next extraction (shown with a cyan background).(c)Superimposed CO2signal during the
intro-duction of the zero gas (N2)and the CO2-extracted reference air
(no. 2) showing a near-100 % extraction efficiency.
1.2 Extraction
Following the sample collection and subsequent transfer into the SAS at Sodankylä, the SAS was brought back to Gronin-gen for subsequent processing and measurement. CO2from
the air samples in the SAS was extracted using an extraction system (total volume≈20 mL) as shown in Fig. 2a. The de-tachable CO2trap, made from Pyrex, has two flow-through
freezing tubes submerged in a liquid air bath. Each section of the SAS is individually connected to the extraction system. The extraction system is first evacuated for approximately an hour and then the air from the SAS is slowly expanded, during which the CO2trap is submerged in liquid air. During
extraction unit is directed into the CRDS analyzer to deter-mine the CH4 and the remaining CO2concentration in the
extracted air. A flow rate of 3 sccm (standard cubic centime-ters per minute), using a mass flow controller (πMFC-LP P2A, MKS), was used for complete extraction of CO2and
simultaneous determination of CH4in the CO2-extracted air.
The extraction procedure was optimized by extractions per-formed with a reference-air-filled (no. 2) “control” sampler (≈50 mL), similar to the SAS. The extraction efficiency was verified by comparison of the change in CO2signal with
in-troduction of nitrogen (as zero-gas) and CO2-extracted
ref-erence air into the CRDS analyzer from the control sampler. The process of optimization is shown in Fig. 2b and c. A time series plot showing consecutive introduction of a zero gas (N2, first two drops in the CO2and CH4signal; orange
background) followed by CO2-extracted reference air (no. 2,
last two drops in the CO2signal; pink background) is shown
in Fig. 2b. In between the consecutive measurements of N2(1
and 2) and CO2-extracted reference air (3 and 4), reference
air (no. 1) was measured, shown with a cyan background. Figure 2c shows the superimposed CO2 signals during
in-troduction of the zero gas (N2)and CO2-extracted reference
air (no. 2) from the control sampler into the CRDS ana-lyzer. This method yielded an extraction efficiency>99.5 %, which was also confirmed from the pressure of CO2 in the
CO2trap measured during the graphitization step discussed
in the next section. Although the control loop was filled with N2 and reference air (no. 2) with very similar pressure, the
superimposed CO2 signals, in Fig. 2c, show a small
differ-ence in the total running time of N2and CO2-extracted
ref-erence air (no. 2). This is due to the fact that the refref-erence air (no. 2) was cooled with liquid air during extraction, which led to a pressure drop, and thus a reduction of the total vol-ume of air going through the CRDS analyzer, before reach-ing the minimum differential pressure between the extrac-tion system side and the CRDS analyzer side that the (MFC) could handle. As soon as the pressure in the extraction unit attained the minimum pressure (≈200 mbar), reference air (no. 1) was then directed into the CRDS analyzer and the extraction system was slowly evacuated while the CO2trap
was still submerged in the liquid air bath. Following the com-plete evacuation of air from the extraction unit, the CO2trap
was disconnected and immediately taken for graphitization, described in the next section.
The use of liquid air, during the extraction of CO2 from
air, prevented the co-freezing of CH4(and of oxygen). A flow
rate of 3 sccm ensured efficient removal of CO2, while
allow-ing simultaneous determination of the CH4 concentration.
The concentration of methane in the CO2-extracted reference
air (no. 2) as determined by the CRDS was 2242.8±0.3 ppb (error in the mean,n=37), which was in close agreement with the methane concentration as determined by gas chro-matography (GC) (2242.1±2 ppb) from a whole air sample directly from the cylinder. The slightly higher concentration values observed for methane in CO2-extracted air is most
likely the production of CH4from the metal–metal friction
during the operation of the stainless steel valves, in the sam-pler, the extraction system, and the control sampler (Higaki et al., 2006). This appearance of “additional” CH4 was
at-tributed to the production from the operation of the stainless steel valves and not to surface degassing, as the production of CH4from a given valve did not disappear nor decrease upon
repetitive turning while the valve is constantly flushed with dry nitrogen. During the extraction of CO2 from the SAS,
control extractions were also performed with reference air (no. 2), and all extracted CO2samples were processed and
measured by the AMS.
1.3 Graphitization and AMS analysis
The AMS facility at CIO is a 2.3 MeV Tandetron built by High Voltage Engineering Europa (Gottdang et al., 1995). As the source of our present AMS facility is not yet capable of using gaseous CO2, the CO2samples are reduced to
ele-mental carbon, which is commonly referred to as graphite in the radiocarbon community. At the CIO, Groningen, the re-duction of CO2(∼1–2 mgC – regular sample size) is carried
out at 600◦C in the presence of H2 (∼2.5×partial
pres-sure of CO2)and Fe powder (Alfa Aesar, 325 mesh, 2 mg)
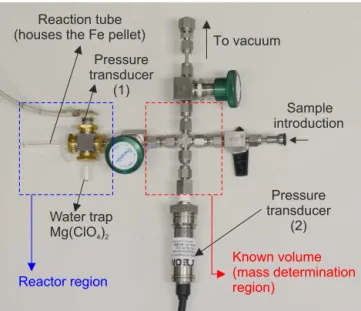
(Aerts-Bijma et al., 1997). A new graphitization system and procedure was developed later for the preparation of small samples (∼10–25 µgC), which featured the use of Fe in the form of a porous pellet (de Rooij et al., 2010) instead of powder, as in the case of regular samples. For the graphi-tization of the CO2samples extracted from AirCore
strato-spheric air samples, we modified and optimized the prepa-ration method of de Rooij et al. (2010). A new low-volume graphitization reactor, as shown in Fig. 3, was designed in-house for the conversion of CO2into elemental carbon. This
graphitization setup comprised two sections: (1) the reactor region (marked in the blue box) and (2) the mass determi-nation region (marked in the red box). The graphitization setup was connected to a common vacuum line to which four other graphitization units were also connected. A turbo pumping station (Edwards, TS75W1001) was used to evacu-ate the graphitization unit.
The reactor region comprised the stainless steel reac-tor manifold, a reaction tube, a water trap tube, and a pressure transducer (Measurement Specialties (Europe), Ltd., model: 13A-050A). The reaction tube (o.d.=6 mm, i.d.=3 mm, length=58 mm) and the water-trap tube (6 mm×3 mm×30 mm) connected on the manifold were constructed from fused silica. The total volume of the reac-tor thus achieved was≈1.5 mL. We used magnesium per-chlorate (Mg(ClO4)2)in the water-trap tube to remove water
produced during the reduction of CO2(Santos et al., 2007a)
more efficient and faster with the use of Mg(ClO4)2, care
must be taken to avoid any Mg(ClO4)2particles entering the
heated section of the reactor tube, which mostly happened due to electrostatic repulsion produced through the operator. It seems likely that one of the thermal decomposition prod-ucts of Mg(ClO4)2 (Devlin and Herley, 1986) poisons the
catalytic properties of Fe, and thus significantly slows down or even prohibits the reduction reaction. Before the actual graphitization, Mg(ClO4)2 in the water trap was heated to
100◦C while evacuating the system. This released a signif-icant amount of water, making the trap even more efficient during graphitization. Iron pellets (≈1.4 mg, 1.3 mm diam-eter,≈0.4 mm thick) were prepared by pressing Fe powder (Alfa Aesar, 325 mesh) at 300 N (de Rooij et al., 2010). The reactor temperature was set at 500◦C, and hydrogen equiv-alent to ≈2.2 times the CO2partial pressure (at STP) was
used. Hydrogen is introduced into the reactor through the vacuum line, while the CO2 in the reactor is frozen in the
water trap with liquid N2. While introducing hydrogen in
the reactor, the valve connecting the common vacuum line and the pump is closed. The reaction temperature and hydro-gen pressure were optimized for minimum CH4production,
thereby minimizing the loss of sample during the graphitiza-tion process. To optimize the reacgraphitiza-tion condigraphitiza-tion, we contin-uously monitored the production of CH4in the reactor
dur-ing test graphitizations with a residual gas analyzer (Extorr, XT100) connected to the manifold through a 25 µm (i.d.) GC capillary column. This manifold was identical to the one used for sample preparation, except for the additional port to con-nect the GC capillary column (not shown in Fig. 3). The reac-tion time for CO2samples<50 µgC was typically less than
20 min with reaction efficiency better than 95 %. The reaction progress was determined by monitoring the change of pres-sure inside the reactor using the prespres-sure transducer (no. 1) connected on the manifold.
The reactor region in the setup is connected to the mass determination region with a known volume. This known vol-ume was used for the determination of the mass of the ref-erence gases as well as of the stratosphere CO2samples. As
contamination is a serious concern for radiocarbon measure-ments of ultra-small samples by AMS, it requires quantita-tive determination of the accumulated contaminants over the whole preparation process. Contamination of two types pose a threat to radiocarbon determination in ultra-small samples: (1) modern carbon contamination (MCC, containing contem-porary levels of radiocarbon) and (2) dead carbon contami-nation (DCC, originating from fossil materials with no ra-diocarbon). MCC and DCC affect samples differently, de-pending on the age and mass of the sample (Paul et al., 2016; Brown and Southon, 1997; Santos et al., 2007b; de Rooij et al., 2010). Very small samples such as those in the present work (≤10 µgC) are severely affected by both MCC and DCC. Hence, for such small samples determination of the accumulated contaminating carbon is essential. To de-termine the mass of accumulated contaminating carbon in a
Reactor region Reaction tube (houses the Fe pellet)
Pressure transducer
(1)
Water trap
Mg(ClO )4 2
To vacuum
Sample introduction
Pressure transducer
(2)
Known volume (mass determination region)
Figure 3.Newly designed reactor (≈1.5 mL, blue box) for
prepa-ration of ultra-small samples (3–50 µgC) for AMS measurements. Each section of the stratospheric air subsampler contains≈35 µg CO2sample that is reduced to graphite (≈9.6 µgC) on porous iron pellets at 500◦C in the presence of hydrogen (≈2.2×partial pres-sure of CO2). The mass determination section, comprising a known
volume, is used to determine the mass of the reference materials and the samples based on pressure measured at pressure transducer (no. 2). Pressure transducer (no. 1) is used to monitor the progress of the graphitization reaction.
sample, reference materials (with masses similar to that of the sample) containing varying levels of radiocarbon are also prepared following identical preparation steps. The extent to which the reference materials deviate from the consensus value provides a direct measure of the accumulated contami-nating carbon. With this information, correction of the radio-carbon values is possible (de Rooij et al., 2010; Santos et al., 2007b; Brown and Southon, 1997). This correction to the ref-erence samples is also applied to the stratospheric samples to remove the deviations arising from contamination, assuming that all samples accumulate similar contaminations following similar preparation steps. As the relative influence of MCC and DCC depends critically on the mass of the samples, an accurate determination of the sample mass is essential.
The concentration of CO2in stratospheric air, as observed
in the two collected AirCore profiles (shown in Fig. 1), was between 387 and 397 ppm corresponding to 9.51–9.76 µgC in each section of the SAS. Since the mass of CO2 from
each section of the SAS was quite constant, reference sam-ples and CO2samples from reference air (no. 2, from
con-trol loop) were prepared in the same mass range as the samples, a prerequisite for contamination correction. For correcting the 14C in CO2 measurements of the
strato-spheric air samples and CO2 from reference air (no. 2),
a set of three different reference materials was prepared with14C levels relevant for the present measurements. This
set comprised ANU sucrose (114C=506.1 ‰, IAEA C6), HOxII (114C=340.6 ‰, SRM 4990C), GS51 (114C Ac-tivity=88 ‰, local reference material prepared from cane sugar acquired in November 2002). Furthermore, a back-ground material, Rommenhöller CO2(virtually free of14C)
was also used. In addition to these reference samples, CO2
(∼2 mgC) was extracted from reference air no. 2 for the de-termination of its14C activity (114C=12±4 ‰). All the
14C activities shown in this paper are reported as114C (‰)
(Mook and van der Plicht, 1999), which indicates the enrich-ment/depletion in14C/C of CO2with respect to the
prein-dustrial level of 0 ‰. The HOxII measurements were used to calibrate all the other14C activities. The two other refer-ence materials, IAEA C6 and GS51, were used to verify the reliability of the correction. Unlike the reference materials, which were directly graphitized from CO2, the CO2samples
extracted from reference air (no. 2) were treated following preparation steps identical to the CO2 samples from
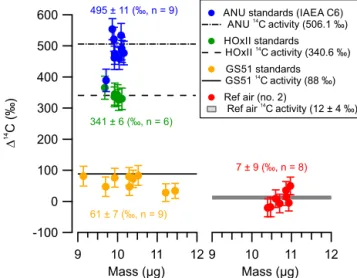
strato-spheric air. Figure 4 shows a summary of all the corrected
14C activities of the reference materials and CO
2from
refer-ence air (no. 2) relative to HOxII standards. The corrections due to MCC and DCC contamination ranged from∼ −12 ‰ for reference air no. 2, via∼ −35 ‰ for GS-51, to∼ −60 ‰ for ANU. The correction values for reference air no. 2 and GS-51 are the most relevant for the actual stratospheric sam-ples. The corrected 14C activities determined for the refer-ence samples and referrefer-ence air are in good agreement with their consensus values and the measured value respectively, although some individual outliers occur and GS51 is system-atically lower than its established value (by 27±7 ‰). On the other hand, the reference air no. 2, which is the only one that is also CO2extracted from air just like the samples, agrees
very well. The error bars associated with each data point cor-respond to the measurement uncertainties of which the poor counting statistics (∼2000 counts, 1/√2000=22 ‰) com-prise the largest fraction. The reported activities in Fig. 4 are the averages of all measurements (± standard error in the mean).
600
500
400
300
200
100
0
-100
14
D
C (‰)
12 11 10 9
Mass (µg) 9 Mass (µg)10 11 12
ANU standards (IAEA C6)
14
ANU C activity (506.1 ‰) HOxII standards
14
HOxII C activity (340.6 ‰)
GS51 standards14
GS51 C activity (88 ‰)
Ref air (no. 2)14
Ref air C activity (12 ± 4 ‰) 495 ± 11 (‰, n = 9)
7 ± 9 (‰, n = 8)
61 ± 7 (‰, n = 9)
341 ± 6 (‰, n = 6)
Figure 4.A summary of the derived14C activities (in114C, ‰) of
the reference materials and CO2extracted from reference air (no. 2)
relative to HOxII. All the reference samples were prepared follow-ing identical preparation steps.
2 Results
The air samples stored in the SAS represented an integrated sample corresponding to an altitude range, the extent of which depended on the ambient pressure at the altitude where the sample was collected. The section of the AirCore profile that is transferred into the SAS can be determined based on the time it required for the sample to flow from the AirCore through the CRDS analyzer into the SAS. The concentra-tion of CH4 in the CO2-extracted air, in each SAS section,
was used to verify the correctness of the determined altitude based on timing. The decrease in the concentration of CH4
in the stratosphere with increasing altitude is continuous and steep, making CH4 a suitable proxy for the altitude check.
However, due to the production of CH4from stainless steel
surfaces as mentioned previously, the CH4 signal might be
corrupted in an unpredictable manner and to an unknown ex-tent. Therefore, both timing and CH4information are used to
determine the altitude range, and the degree of similarity be-tween them is a good measure of reliability. Figure 5a and b show the results of the altitude determination from the two stratospheric AirCore samples collected on 15 and 16 July 2014. The blue circles show the AirCore CH4 profile, the
black solid line shows the AirCore profile corrected for fill gas, and the red solid line shows the predicted CH4
concen-tration in each section of the SAS, based on the AirCore pro-file and the recorded sampling time and flow rate. Figure 5c and d show the correlation between the CH4concentration as
predicted based on timing, shown in panel a and b, and con-centrations measured by the CRDS analyzer during extrac-tion. For most samples, the predicted CH4concentration was
CRDS analyzer during extraction. The largest deviation was observed for the sample representing the upper stratosphere (i.e. SAS section no. 6, marked with a red arrow in Fig. 5c and d) due to contamination from leftover fill gas, which contains compressed dry ambient air (sampled at Sodankylä, Finland) spiked with carbon monoxide. This influence from the fill gas above 24 km causes the difference between the measured and the corrected vertical CH4profiles of the
at-mosphere shown in Fig. 5a and b. The predicted CH4
val-ues for the SAS are of course based on the measured profile. The predicted value for the SAS above∼22 km for 15 July 2016 (Fig. 5c) and 16 July 2016 (Fig. 5d) is approximately 150 and 165 ppb lower than the measured value, respectively. The AirCore profiles, shown in Fig. 5, were obtained as the air from the AirCore moved through the CRDS analyzer into the sampler. During this transfer, behind the analyzer there is a small additional mixing of samples through diffusion that is not captured in the presented AirCore profile data. While diffusion in principle has affected all the samples to some extent, the ones near the upper stratosphere are affected the most due to the large difference in the CH4concentration of
the sample and the fill gas. This extra contamination of upper stratospheric air (SAS section no. 6) with the leftover fill gas in the AirCore, due to diffusion, is predominantly the cause of the large observed deviation.
As timing is our primary parameter for altitude calcula-tion, reliable knowledge of the timing during the filling of the SAS is crucial, i.e., the time when the valves at both ends of the SAS were closed during the filling process. Timing also includes here the accurate knowledge of the flow rate at which the sample from the AirCore is transferred into the SAS. A timing problem was observed in the dataset shown in Fig. 5b, which could have been caused by any of the pre-viously mentioned reasons. By introducing a best fit tim-ing offset of −33 s, we moved the whole predicted profile slightly upwards, and then the resultant predicted altitude range showed a good agreement with the measured concen-trations, as seen in Fig. 5d. Control of the SAS filling process should, however, be improved, which is a topic for future re-search.
Figure 6a shows the CO2 concentrations retrieved from
the two AirCore samples described in this paper (orange tri-angles for 15 July 2014 and cyan circles for 16 July 2014) and the respective corrected AirCore profile (red line for 15 July 2014 and blue line for 16 July 2014). Figure 6b shows the measured radiocarbon concentration in the extracted CO2
samples, with orange triangles representing samples from 15 July 2014 and cyan circles representing samples from 16 July 2014. The present114C value for tropospheric CO2is ≈20 ‰ (Levin et al., 2013; Graven, 2015; Hua et al., 2013). The uncertainties in the114C values, shown in Fig. 6b, are about ±30 ‰, entirely caused by counting statistics. The sample from the upper stratosphere of the AirCore sampled on 16 July(sample 6) was lost during the graphitization pro-cess due to a leak in the reactor. As mentioned in the
previ-2000 1800 1600 1400 1200 1000
CH4 (ppb)
28 26 24 22 20 18 16 14 12
Altitude (m x10
3 )
AC CH4profile
CH4: predicted
CH4: corrected
16-07-2014
(b)
(a) 100012001400CH4 (ppb)160018002000
28 26 24 22 20 18 16 14 12
Altitude (m x10
3 )
AC CH4profile
CH4: predicted
CH4: corrected
15-07-2014 12
3 4 5 6 : S A S section 1 2 3 4 5 6: S
A S section 2000 1800 1600 1400 1200 1000 C H4 : me as ur ed (p pb ) 2000 1800 1600 1400 1200 1000
CH4: predicted (ppb)
1:1 line 16-07-2014 (d) 2000 1800 1600 1400 1200 1000 C H4 : me as ur ed (p pb ) 2000 1800 1600 1400 1200 1000
CH4: predicted (ppb)
1:1 line
15-07-2014
(c)
Figure 5. (a)AirCore (AC) CH4profile (shown with blue open
cir-cles), the corrected AirCore profile (shown with a solid black line), and calculated CH4concentration for each section of the SAS for
the samples collected on 15 July 2014.(b)The same for the samples collected on 16 July 2014.(c, d)Correlation between the calculated CH4concentration and the CH4concentration as measured by the CRDS analyzer while extracting the CO2 from the samples. The
measured CH4concentration values, for both profiles, are in good
agreement with the calculated CH4concentrations for all samples,
except for the ones (indicated by arrows) corresponding to the upper stratosphere, which are contaminated with leftover fill gas.
ous section, during the extraction and graphitization of the stratospheric samples, CO2 from reference air (no. 2) was
also extracted, graphitized, and measured. AMS measure-ments of the eight CO2 samples extracted from reference
air (no. 2,≈10 µgC each), after contamination corrections, yielded a mean114C value of 7±9 ‰, which is in close agreement with the directly measured value of a 2 mgC sam-ple extracted from reference air (no. 2) that yielded a114C value of 12±4 ‰. This gives confidence in the contamination corrections applied.
The two CO2 profiles shown in Fig. 6a are very
simi-lar, with slight differences near the tropopause (11–12 km,
≈4 ppm). The 114C values in Fig. 6b corresponding to the SAS sections 1–4, for the sample collected on 15 July, are very similar (18±6 ‰). However, the 114C values in Fig. 6b corresponding to the SAS sections 1–4, for the sam-ple collected on 16 July, show a large gradient (from−62 to
+21 ‰). The114C values corresponding to SAS sections 3, 4, and 5 are very similar in the two presented profiles. The
114C values corresponding to SAS section 5, in both pro-files, show some enrichment in14CO2 due to constant
pro-duction of radiocarbon in the stratosphere. In Fig. 6b, the
(a)
400 396 392 388 384
CO2 (ppm)
28 26 24 22 20 18 16 14 12
Altitude (m x10
3 )
15-07-2014
AC CO2 profile
CO2 corrected
16-07-2014
AC CO2 profile
CO2 corrected
(b)
28 26 24 22 20 18 16 14 12
Altitude (m x10
3 )
150 100 50 0 -50 -100
∆ 14C (‰)
15-07-2014 16-07-2014
Corrected for contamination from fill gas
1 2 3 4 5 6:S
A
S
section
1 2 3 4 5 6 :S
A
S
section
Figure 6. (a)AirCore (AC) CO2profiles (orange triangles for 15
July 2014 and cyan circles for 16 July 2014) and their correspond-ing corrected AirCore CO2profiles (red line for 15 July 2014 and
blue line for 16 July 2014).(b)The114C values (‰, orange trian-gles representing samples from 15 July 2014 and cyan circles repre-senting samples from 16 July 2014) in each section of the SAS. The last CO2sample extracted from the AirCore sampled on 16 July
2014 was lost. The uncertainties in the114C values correspond to measurement uncertainties arising from limited counting statistics.
CO2 (enriched in14C) with the CO2 from fill gas (natural
levels of14C, although the exact114C value is not known), as mentioned previously. The extent of contamination in the last sample from the fill gas was determined from the CO profile, since the concentration of CO in the stratosphere is low and fairly constant (≈15 ppb), whereas the concentra-tion of CO in the fill gas is high and known (7972 ppb). This leads to a small correction (from 73 to 80 ‰) for contami-nation with∼11 % fill gas, for which we assumed a114C value of 20 ‰. Since the contamination by the fill gas was only∼11 %, the exact114C value of the fill gas is not very important: even assuming a±20 ‰ uncertainty in its value would only lead to an extra uncertainty of±2.5 ‰ in the cor-rected value, which is negligible compared to the±30 ‰ un-certainty in the value due to limited counting statistics. In future campaigns the114C of CO2in the fill gas will still be
determined.
The three 114C values observed for the lower altitude samples for the 16 July 2014 profile (Fig. 5b), especially the sample close to the tropopause (11–13 km), have14C values that are, in part, significantly lower than present-day tropo-spheric air. The occurrence of a polluted air mass causing this can be ruled out due to the absence of a simultaneous rise of CO at such altitudes. The most probable explanation is thus contamination somewhere in the SAS sampling or extraction process.
The results for these very first datasets are, due to both limited counting statistics and various other uncertainties (in timing and other issues such as possible sample contamina-tion), not accurate enough to deduce any transport processes in the atmosphere; rather, these results are a proof of princi-ple, showing that the AirCore sampling for radiocarbon de-termination in stratospheric air is feasible. As the sampling
method is relatively cheap, regular sample collections (e.g., every 2 months) are affordable; an AirCore sampling pro-gram for14C measurements with improved precision in the future has a great potential for leading to better understand-ing of the14C budget and the transport mechanisms involved.
3 Conclusions and outlook
The results presented in this paper show that AirCore sam-pling is, in principle, a viable samsam-pling method for the pur-pose of radiocarbon measurements in stratospheric CO2. In
this proof of principle experiment we achieved a measure-ment uncertainty of∼ ±30 ‰, mostly limited by the AMS counting statistics. The14CO2content in the stratosphere (up
to∼19±1 km) from the sample collected on 15 July 2014 seems very well mixed, with114C values of∼18±6 ‰ be-ing very close to the present-day troposphere. However, the sample collected on 16 July 2014 shows a very large114C gradient from the tropopause to∼18±1 km. The exact rea-son for the large negative values near the tropopause on 16 July 2014 is not known to us, but contaminations could be a likely reason. Samples from higher than 18 km are likely to be slightly enriched in14CO2(∼80±20 ‰), as expected in
these higher latitudes as the production of14C is predominant in the stratosphere (Masarik and Beer, 1999).
Since the sampling technique is relatively cheap, it is fea-sible to couple an AirCore SAS sampling program to a ular AirCore launch program, such as the one that is reg-ularly being carried out at Sodankylä, Finland, throughout the year. The stratospheric samples required for radiocarbon measurements could always be taken from any AirCore sam-pling and need not have to be part of dedicated campaigns with special protocols, as long as the sample size obtained is adequate for AMS measurements. As indicated by the results in Fig. 5, one of the major challenges we faced in this work is the altitude determination for each section of the SAS. In that respect, it would help if we could avoid the contamina-tion of the CH4 signal due to the production of CH4 from
stainless steel valves and connectors. Replacing every stain-less steel valve with valves made from polymeric material might be unfeasible, but some sections can certainly be mod-ified in future versions. For example, currently the extraction system is completely constructed from stainless steel compo-nents, which in future can be completely replaced with glass components. This would partially reduce the extent of con-tamination of stratospheric air with CH4produced as a result
altitude range would introduce less contamination. The114C values for the contaminated samples (last sections of SAS) can also be corrected if the extent of contamination is well defined, which would require a careful characterization of the sample transfer process, from the AirCore to the SAS, or accurate measurements of CO2and CH4 concentrations for
these same air samples. Thus it is certainly critical to treat the stratospheric samples very carefully, and rigorous test-ing of the sampltest-ing process is needed to rule out leakages, potential contaminations arising from memory effects of the sampler wall and the extent of sample profile integrity as the sample from the AirCore is moved into the SAS through the CRDS analyzer. Additionally, the graphitization process also requires careful monitoring since incomplete reduction would result in a lower sample mass than expected in addi-tion to isotopic fracaddi-tionaaddi-tion and thus a less accurate con-tamination correction based on reference materials (that are then relatively larger in mass). Therefore it is important to have very consistent reaction efficiencies. It is also important that the mass of the reference material, used for correction, closely matches that of the samples.
Difficulties with altitude determination and possibilities of various contamination sources notwithstanding, we suc-cessfully demonstrated a new method of stratospheric 14C sampling, for which we have successfully dealt with small (∼10 µgC) samples. This is thanks to our small and ef-ficient extraction system with near-100 % extraction effi-ciency. With the installation of the newly designed small vol-ume graphitization reactor, we also achieved reaction effi-ciencies better than 95 % for samples as small as∼10 µgC. The14C ion counts can be increased further (∼2–2.5 times) with the use of smaller Fe pellets (<1 mg) due to the increase in the number density of the carbon atoms in the sputtered volume of the AMS target. This would improve the count-ing statistics (from∼30 to below 20 ‰) and thus the AMS measurement uncertainties. Alternatively, the use of a state-of-the-art AMS facility with a gas ionization source (Ruff et al., 2010, 2007) would lead to less contamination (thanks to the avoidance of the graphitization step) and a consider-ably higher number of accumulated counts (thanks to the higher efficiency) and thus a higher precision, even with such small samples. Such a new AMS system will be installed in Groningen in the course of 2017.
4 Data availability
The datasets are available upon request from the authors.
Acknowledgements. We would like to thank our colleagues Anita Aerts-Bijma, Fsaha Ghebru, Sanne Palstra, Bert Kers, Marcel de Vries, and Mark Bleeker at CIO, Groningen, for their extensive help. This project has been largely financed by a generous grant from the electricity company RWE/Essent. We are thankful to the FMI AirCore team members Pauli Heikkinen, Juha Hatakka, and Tuomas Laurila. Funding from the Academy of Finland through grant number 140408 is also gratefully acknowledged.
Edited by: J. Notholt
Reviewed by: M. K. Sha and one anonymous referee
References
Aerts-Bijma, A. T., Meijer, H. A. J., and van der Plicht, J.: AMS sample handling in Groningen, Nucl. Instrum. Methods Phys. Res., Sect. B, 123, 221–225, 1997.
Ashenfelter, T. E., Gray, J., Sowl, R. E., Svendsen, M., and Tel-egadas, K.: A Lightweight Molecular Sieve Sampler for Mea-suring Stratospheric Carbon-14, J. Geophys. Res., 77, 412–419, doi:10.1029/JC077i003p00412, 1972.
Brenninkmeijer, C. A. M., Lowe, D. C., Manning, M. R., Sparks, R. J., and vanVelthoven, P. F. J.: The13C,14C and18O isotopic composition of CO, CH4, and CO2in the higher southern
lati-tudes lower stratosphere, J. Geophys. Res.-Atmos., 100, 26163– 26172, doi:10.1029/95jd02528, 1995.
Brenninkmeijer, C. A. M., Crutzen, P., Boumard, F., Dauer, T., Dix, B., Ebinghaus, R., Filippi, D., Fischer, H., Franke, H., Frieß, U., Heintzenberg, J., Helleis, F., Hermann, M., Kock, H. H., Koep-pel, C., Lelieveld, J., Leuenberger, M., Martinsson, B. G., Miem-czyk, S., Moret, H. P., Nguyen, H. N., Nyfeler, P., Oram, D., O’Sullivan, D., Penkett, S., Platt, U., Pupek, M., Ramonet, M., Randa, B., Reichelt, M., Rhee, T. S., Rohwer, J., Rosenfeld, K., Scharffe, D., Schlager, H., Schumann, U., Slemr, F., Sprung, D., Stock, P., Thaler, R., Valentino, F., van Velthoven, P., Waibel, A., Wandel, A., Waschitschek, K., Wiedensohler, A., Xueref-Remy, I., Zahn, A., Zech, U., and Ziereis, H.: Civil Aircraft for the reg-ular investigation of the atmosphere based on an instrumented container: The new CARIBIC system, Atmos. Chem. Phys., 7, 4953–4976, doi:10.5194/acp-7-4953-2007, 2007.
Brown, T. A. and Southon, J. R.: Corrections for contamina-tion background in AMS C-14 measurements, Nucl. Instrum. Methods Phys. Res., Sect. B, 123, 208–213, doi:10.1016/s0168-583x(96)00676-3, 1997.
Chen, H., Kivi, R., Heikkinen, P., Kers, B., de Vreis, M., Hatakka, J., Laurila, T., Sweeney, C., and Tans, P.: High-latitude balloon observations of CO2/CH4/CO using AirCore: evaluation of
So-dankylä TCCON retrievals, in preparation, 2016.
de Rooij, M., van der Plicht, J., and Meijer, H. A. J.: Porous iron pellets for AMS14C analysis of small samples down to ultra-microscale size (10–25 µgC), Nucl. Instrum. Methods Phys. Res., Sect. B, 268, 947–951, doi:10.1016/j.nimb.2009.10.071, 2010. Devlin, D. J. and Herley, P. J.: Thermal decomposition and
dehydra-tion of magnesium perchlorate hexahydrate, Thermochim. Acta, 104, 159–178, doi:10.1016/0040-6031(86)85195-4, 1986. Dlugokencky, E. and Tans, P.: Trends in Atmospheric Carbon
Gottdang, A., Mous, D. W., and van der Plicht, J.: The HVEE C-14 system at Groningen., Radiocarbon, 37, 649–656, 1995. Graven, H. D.: Impact of fossil fuel emissions on
atmo-spheric radiocarbon and various applications of radiocarbon over this century, P. Natl. Acad. Sci. USA, 112, 9542–9545, doi:10.1073/pnas.1504467112, 2015.
Hagemann, F., Gray, J., Machta, L., and Turkevich, A.: Strato-spheric Carbon-14, Carbon dioxide, and Tritium, Science, 130, 542–552, doi:10.1126/science.130.3375.542, 1959.
Hartmann, D. L., Klein Tank, A. M. G., Rusticucci, M., Alexan-der, L. V., Bronnimann, S., Charabi, Y., Dentener, F. J., Dlugo-kencky, E. J., Easterling, D. R., Kaplan, A., Soden, B. J., Thorne, P. W., Wild, M., and Zhai, P. M.: Observations: Atmosphere and Surface, in: Climate Change 2013: The Physical Science Basis. Contribution of Working Group I to the Fifth Assessment Report of the Intergovernmental Panel on Climate Change, edited by: Stocker, T. F., Qin, D., Plattner, G.-K., Tignor, M., Allen, S. K., Boschung, J., Nauels, A., Xia, Y., Bex, V., and Midgley, P. M., Cambridge University Press, Cambridge, UK and New York, NY, USA, 159–254, 2013.
Higaki, S., Oya, Y., and Makide, Y.: Emission of Methane from Stainless Steel Surface Investigated by Using Tri-tium as a Radioactive Tracer, Chem. Lett., 35, 292–293, doi:10.1246/cl.2006.292, 2006.
Hua, Q., Barbetti, M., and Rakowski, A. Z.: Atmospheric Radio-carbon for the Period 1950–2010, RadioRadio-carbon, 55, 2059–2072, doi:10.1017/S0033822200048979, 2013.
IPCC: Climate Change 2014: Impacts, Adaptation, and Vulnerabil-ity, Part A: Global and Sectoral Aspects, Contribution of Work-ing Group II to the Fifth Assessment Report of the Intergovern-mental Panel on Climate Change, edited by: Field, C. B., Barros, V. R., Dokken, D. J., Mach, K. J., Mastrandrea, M. D., Bilir, T. E., Chatterjee, M., Ebi, K. L., Estrada, Y. O., Genova, R. C., Girma, B., Kissel, E. S., Levy, A. N., MacCracken, S., Mastrandrea, P. R., and White, L. L., Cambridge University Press, Cambridge, UK and New York, NY, USA, 1132 pp., 2014a.
IPCC: Climate Change 2014: Impacts, Adaptation, and Vulnerabil-ity, Part B: Regional Aspects, Contribution of Working Group II to the Fifth Assessment Report of the Intergovernmental Panel on Climate Change, edited by: Barros, V. R., Field, C. B., Dokken, D. J., Mastrandrea, M. D., Mach, K. J., Bilir, T. E., Chatter-jee, M., Ebi, K. L., Estrada, Y. O., Genova, R. C., Girma, B., Kissel, E. S., Levy, A. N., MacCracken, S., Mastrandrea, P. R., and White L. L., Cambridge University Press, Cambridge, UK and New York, NY, USA, 688 pp., 2014b.
Kanu, A. M., Comfort, L. L., Guilderson, T. P., Cameron-Smith, P. J., Bergmann, D. J., Atlas, E. L., Schauffler, S., and Boer-ing, K. A.: Measurements and modeling of contemporary radio-carbon in the stratosphere, Geophys. Res. Lett., 43, 1399-1406, doi:10.1002/2015gl066921, 2016.
Karion, A., Sweeney, C., Tans, P., and Newberger, T.: AirCore: An Innovative Atmospheric Sampling System, J. Atmos. Ocean. Tech., 27, 1839–1853, doi:10.1175/2010jtecha1448.1, 2010. Levin, I., Kromer, B., and Hammer, S.: Atmospheric114CO2trend
in Western European background air from 2000 to 2012, Tellus B, 65, 20092, doi:10.3402/tellusb.v65i0.20092, 2013.
Lingenfelter, R. E.: Production of Carbon 14 by Cosmic-Ray Neu-trons, Rev. Geophys., 1, 35–55, doi:10.1029/RG001i001p00035, 1963.
Machida, T., Matsueda, H., Sawa, Y., Nakagawa, Y., Hirotani, K., Kondo, N., Goto, K., Nakazawa, T., Ishikawa, K., and Ogawa, T.: Worldwide Measurements of Atmospheric CO2and Other Trace
Gas Species Using Commercial Airlines, J. Atmos. Ocean. Tech., 25, 1744–1754, doi:10.1175/2008jtecha1082.1, 2008.
Masarik, J. and Beer, J.: Simulation of particle fluxes and cosmo-genic nuclide production in the Earth’s atmosphere, J. Geophys. Res.-Atmos., 104, 12099–12111, doi:10.1029/1998jd200091, 1999.
Mook, W. G. and van der Plicht, J.: Reporting 14C ac-tivities and concentrations, Radiocarbon, 41, 227–239, doi:10.1017/S0033822200057106, 1999.
Mrozek, D. J., van der Veen, C., Hofmann, M. E. G., Chen, H., Kivi, R., Heikkinen, P., and Röckmann, T.: Stratospheric Air Sub-sampler (SAS) and its application to analysis of117O(CO2) from small air samples collected with an AirCore, Atmos. Meas. Tech. Discuss., doi:10.5194/amt-2016-124, in review, 2016. Nakamura, T., Nakazawa, T., Nakai, N., Kitagawa, H., Honda, H.,
Itoh, T., Machida, T., and Matsumoto, E.: Measurement of14C Concentrations of Stratospheric CO2by Accelerator Mass
Spec-trometry, Radiocarbon, 34, 745–752, 1992.
Nakamura, T., Nakazawa, T., and Honda, H.: Seasonal variations in
14C concentrations of stratospheric CO
2measured with
acceler-ator mass spectrometry, Nucl. Instrum. Methods Phys. Res., Sect. B, 92, 413–416, doi:10.1016/0168-583X(94)96045-3, 1994. Paul, D., Been, H. A., Aerts-Bijma, A. T., and Meijer, H. A. J.:
Contamination on AMS sample targets by modern carbon is in-evitable, Radiocarbon, 58, 407–418, doi:10.1017/RDC.2016.9, 2016.
Ruff, M., Wacker, L., Gaeggeler, H. W., Suter, M., Synal, H. A., and Szidat, S.: A gas ion source for radiocarbon measurements at 200 kV, Radiocarbon, 49, 307–314, 2007.
Ruff, M., Szidat, S., Gaggeler, H. W., Suter, M., Synal, H. A., and Wacker, L.: Gaseous radiocarbon measurements of small sam-ples, Nucl. Instrum. Methods Phys. Res., Sect. B, 268, 790–794, doi:10.1016/j.nimb.2009.10.032, 2010.
Santos, G. M., Southon, J. R., Druffel-Rodriguez, K. C., Griffin, S., and Mazon, M.: Magnesium perchlorate as an alternative wa-ter trap in AMS graphite sample preparation; a report on sample preparation at KCCAMS at the University of California, Irvine, Radiocarbon, 46, 165–173, doi:10.1017/S0033822200039485, 2007a.
Santos, G. M., Southon, J. R., Griffin, S., Beaupre, S. R., and Druffel, E. R. M.: Ultra small-mass AMS 14C sam-ple preparation and analyses at KCCAMS/UCI Facility, Nucl. Instrum. Methods Phys. Res., Sect. B, 259, 293–302, doi:10.1016/j.nimb.2007.01.172, 2007b.
Sweeney, C., Karion, A., Wolter, S., Newberger, T., Guenther, D., Higgs, J. A., Andrews, A. E., Lang, P. M., Neff, D., Dlugokencky, E., Miller, J. B., Montzka, S. A., Miller, B. R., Masarie, K. A., Bi-raud, S. C., Novelli, P. C., Crotwell, M., Crotwell, A. M., Thon-ing, K., and Tans, P. P.: Seasonal climatology of CO2 across