Parameters on Model Prediction Error of VOCs/
Formaldehyde from Dry Building Material
Wenjuan Wei1, Jianyin Xiong2, Yinping Zhang1*
1Department of Building Science, Tsinghua University, Beijing, China,2School of Mechanical Engineering, Beijing Institute of Technology, Beijing, China
Abstract
Mass transfer models are useful in predicting the emissions of volatile organic compounds (VOCs) and formaldehyde from building materials in indoor environments. They are also useful for human exposure evaluation and in sustainable building design. The measurement errors in the emission characteristic parameters in these mass transfer models, i.e., the initial emittable concentration (C0), the diffusion coefficient (D), and the partition coefficient (K), can result in errors in predicting
indoor VOC and formaldehyde concentrations. These errors have not yet been quantitatively well analyzed in the literature. This paper addresses this by using modelling to assess these errors for some typical building conditions. The error inC0, as
measured in environmental chambers and applied to a reference living room in Beijing, has the largest influence on the model prediction error in indoor VOC and formaldehyde concentration, while the error inKhas the least effect. A correlation
between the errors inD,K, andC0 and the error in the indoor VOC and formaldehyde concentration prediction is then
derived for engineering applications. In addition, the influence of temperature on the model prediction of emissions is investigated. It shows the impact of temperature fluctuations on the prediction errors in indoor VOC and formaldehyde concentrations to be less than 7% at 2360.5uC and less than 30% at 2362uC.
Citation:Wei W, Xiong J, Zhang Y (2013) Influence of Precision of Emission Characteristic Parameters on Model Prediction Error of VOCs/Formaldehyde from Dry Building Material. PLoS ONE 8(12): e80736. doi:10.1371/journal.pone.0080736
Editor:Qinghua Sun, The Ohio State University, United States of America
ReceivedJuly 13, 2013;AcceptedOctober 6, 2013;PublishedDecember 3, 2013
Copyright:ß2013 Wei et al. This is an open-access article distributed under the terms of the Creative Commons Attribution License, which permits unrestricted use, distribution, and reproduction in any medium, provided the original author and source are credited.
Funding:This research was supported by the National Natural Science Foundation of China (No. 50725620 and No. 51106011) and by the 12th 5-year key project, Ministry of Science and Technology of China (No. 2012BAJ02B01). (http://www.nsfc.gov.cn/Portal0/default152.htm). The funders had no role in study design, data collection and analysis, decision to publish, or preparation of the manuscript.
Competing Interests:The authors have declared that no competing interests exist.
* E-mail: [email protected]
Introduction
Chemical pollutant emissions from building materials in indoor environments can result in adverse health effects on indoor occupants [1,2]. Analytical emission models predicting VOC/ formaldehyde emissions provide an efficient way to evaluate the short and long term emissions of VOCs/formaldehyde in various practical environmental conditions as compared to chamber studies of emissions. The accurate prediction of indoor VOC/ formaldehyde concentrations is the basis for the evaluation and subsequent control of indoor VOC/formaldehyde exposure. A series of mass transfer models have been developed based on different initial or boundary conditions to predict the emissions of VOCs/formaldehyde from building materials [3,4]. The predicted emission rates of VOCs/formaldehyde using different emission models for a single layer homogeneous building material differ mainly during the initial stage when the dimensionless mass transfer time, Fourier number (Fom~Dt
L2, where,Dis the diffusion coefficient,tis time, andLis the thickness of the building material), is less than 1024, but are similar when used for long term prediction [5–7].
Three emission characteristic parameters need to be measured in advance for model predictions: the diffusion coefficient of VOCs/formaldehyde in building material,D(m2/s); the material/ air phase partition coefficient, K (2); and the initial emittable VOC/formaldehyde concentration,C0(mg/m3).
Several experimental methods have been developed to deter-mine the emission characteristic parameters, for example, the cup method, the CLIMPAQ method, the two chamber method, the microbalance method, and the porosity test method for D; the multi-sorption equilibrium regression method, the multi-emission/ flush regression method, and the variable volume loading (VVL) method forK; and, the CM-FBD (cryogenic milling - fluidized bed desorption) method, the multi-flushing extraction method, and the C-history method forC0 [3]. Since D, K, andC0 are the input characteristic parameters for model predictions of VOC/formal-dehyde emission, we need to know what effect any measurement error in these parameters will have on predicting indoor VOC/ formaldehyde concentrations.
Measurement Errors in VOC/Formaldehyde Emission Characteristic Parameters
The measurement errors in VOC/formaldehyde emission characteristic parameters arise firstly from systematic errors in the measurement system, and secondly from random operating errors. Analysis of the measurement errors in the VOC/ formaldehyde emission characteristic parameters can be divided into three categories: measurement errors in one laboratory employing one evaluation method; comparison of different evaluation methods; and measurement errors in inter-laboratory studies.
Measurement Errors in one Laboratory Employing One Evaluation Method
Measurement errors in one laboratory employing one evalua-tion method indicate the random operating errors between replicated measurements. In reviewing the literature published before 2013 for measuringD,K, andC0we found that the diffusion coefficients range from 10214m2/s to 10210m2/s, the partition coefficients from 101 (2) to 105 (2), and the initial emittable concentrations from 103mg/m3to 107mg/m3in materials such as
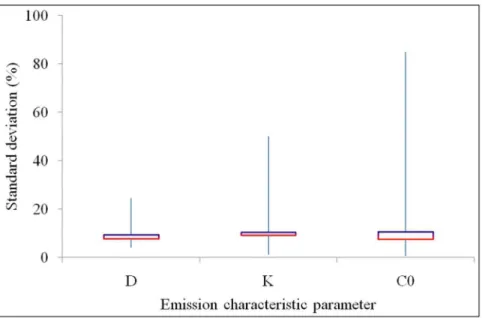
medium density board and vinyl flooring for VOCs and formaldehyde [9–16]. Measurement errors inD, K, and C0 are shown in Figure 1. The error bars forD,K, andC0from 0% to 100% represent the full range of standard deviations for the measurement data found in the literature. The squares in the Figure 1. Measurement errors inD,K, andC0within one laboratory employing one evaluation method.
doi:10.1371/journal.pone.0080736.g001
centres of the error bars forD, K, andC0 represent the median value of the standard deviations as the bottom horizontal red lines, and the mean value of the standard deviations as the top horizontal purple lines. The median values of the standard deviations for D, K, and C0 are smaller than the mean values, probably because the errors in a few measurements are much higher than the others. The median values of the standard deviations of the measurement data are 8% forD, 9% forK, and 7% for C0. The mean values of the standard deviations of the measurement data are 9% forD, 10% forK, and 11% forC0.
Comparison of Different Evaluation Methods
Since there are various methods to measureD, K, and C0of building materials, comparing the methods when measuring replicated materials will give an indication of the difference between methods. The difference between methods occurs in testing protocols [10,17] or data analysis protocols [7]. The measurement results forD,K, andC0using different methods are shown in Figure 2. The error bars forD,K, andC0from 10% to 160% represent the full range of differences for the measurement data that was found in the literature. The squares in the centres of the error bars forD,K, andC0represent the median value of the differences between methods as the horizontal red lines, and the mean value of the differences between methods as the horizontal purple lines. The median values of the differences between methods are 11% forD, less than 1% forK, and 26% forC0. The mean values of the differences between methods are 17% forD, 18% forK, and 30% forC0. As a result, the measurement errors forD,K, andC0range from 10% to 30%.
Measurement Errors in Inter-laboratory Studies
Tests to determine VOC/formaldehyde emissions from build-ing materials are usually performed in environmental chambers, as are the tests to determine the emission characteristic parameters. The VOC/formaldehyde molecules in the test material diffuse into the air in the chamber, which can then be sampled and analyzed by using instruments such as a GC/MS, and HPLC, thereby measuring the concentration of VOCs/formaldehyde in the air in the chamber. Inter-laboratory studies were made to
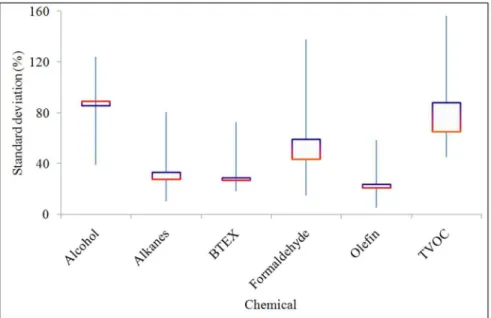
address the deviations of results between laboratories in measuring the VOC/formaldehyde concentrations in chamber air by using reference emission samples [18–22]. The standard deviations of results between laboratories in measuring the concentrations of alcohol, alkanes, BTEX, formaldehyde, olefin, and TVOC in the chamber air are shown in Figure 3. The error bars in the figure show the full range of the standard deviations in the inter-laboratory studies for measuring VOC/formaldehyde concentra-tions in chamber air. The squares in the centres of the error bars represent the median value of the standard deviations of the inter-laboratory comparison results as the horizontal red lines, and the mean value of the standard deviations of the inter-laboratory comparison results as the horizontal purple lines. The median values of the standard deviations of the inter-laboratory compar-isons are 89% for alcohol, 28% for alkanes, 27% for BTEX, 44% for formaldehyde, 21% for olefin, and 65% for TVOC. The mean values of the standard deviations of the inter-laboratory compar-isons are 86% for alcohol, 33% for alkanes, 29% for BTEX, 59% for formaldehyde, 24% for olefin, and 88% for TVOC.
Possible Reasons for the Errors in VOC/Formaldehyde Emission Measurements
Errors in VOC/formaldehyde emission measurements result from three possible causes. One is the difference between the measurement methods used to determine the emission character-istic parameters, especially the initial emittable VOC/formalde-hyde concentration in building materials. Another is the perfor-mance of the measurement systems, e.g., the temperature control accuracy, air leakage into the environmental chamber, and the accuracy of the air sampling volume. The measurement errors caused by the performances of these systems can be systematic errors and random errors, and will generally differ between laboratories. The third is the performance of the chemical analysis instruments, e.g., GC/MS for analyzing VOCs and HPLC for analyzing formaldehyde. This error can be minimized by regularly calibrating the instruments.
Methods
Mass Transfer Model to Predict VOC/Formaldehyde Emissions from Building Materials
After decades of study, dozens of emission models have been developed to predict the emission of VOCs/formaldehyde from dry building material. Among those models, Deng’s model [6] provides a fully analytical solution for predicting VOC/formalde-hyde emissions from a single layer of homogeneous material under ventilated conditions when the chamber inlet VOC/formaldehyde concentration and the initial VOC/formaldehyde concentration in the chamber air are zero. More generous models such as Xu’s model and Wang’s model are semi-analytical solutions that require a finite difference method to solve [5,23]. Since Deng’s model gives results consistent with experimental measurements, it has been widely used by many researchers [3,7]. As it is good for predicting building material emissions under common practical conditions, we have used it to predict VOC/formaldehyde emissions from building materials in this study. The VOC/ formaldehyde concentration in the chamber air using Deng’s model can be predicted as:
Ca(t)~2C0b X?
n~1 qnsinqn
An
e{
Dq2n
L2t ð1Þ
where,Ca(t) is the predicted VOC/formaldehyde concentration in the chamber (mg/m3);Lis the thickness of the material (m); andtis
the time for prediction (s). With
An~½Kbz(a{q2n)K=Bimz2q2ncosqn
zqnsinqn½Kbz(a{3q2n)K=Bimza{q2n
ð2Þ
Bim~ hmL
D ,a~ NL2
D ,b~ AL
V ð3Þ
where,Ais the emission area of the material (m2);Vis the volume of the chamber (m3);Nis the air change rate in the chamber (h21); andhmis the convective mass transfer coefficient in the chamber (m/s).qnis the positive root of the following equation:
qntanqn~
a{q2 n
Kbz(a{q2
n)K=Bim
ð4Þ
Error analysis of Model Prediction in a Ventilated Chamber and a Reference Living Room
Experimental data from environmental chambers are available from previous chamber studies reported in the literature, e.g., the conditions of the chamber and the parameters of the building material found in Yao [24], Table 1. Formaldehyde concentration in the air in a 30 m3 ventilated chamber loaded with board furniture was measured for a period of a week. The formaldehyde concentration in the chamber air was measured by INNOVA-1312 as well as being predicted using Deng’s model. As discussed in previous sections, the measurement errors inD,K, andC0in statistical analysis are in the range from 10% to 30%. Therefore, reasonable errors620% in the measurement data ofD,K, andC0 were then added for model predictions of formaldehyde concen-trations in the chamber.
One of the main applications of the emission models is to predict VOC/formaldehyde emissions from furniture in the indoor environment, e.g., office room, living room, bedroom, which can be a useful tool for indoor VOC/formaldehyde source control or indoor decorating guidelines for chemical pollution. The model prediction in a real furnished room requires the input data of the VOC/formaldehyde emission characteristic parame-ters (D,K, andC0) of the furniture and the information about the room, such as room volume, furniture loading factor, ventilation etc. [25]. Since the measured parameters (D, K, and C0) always
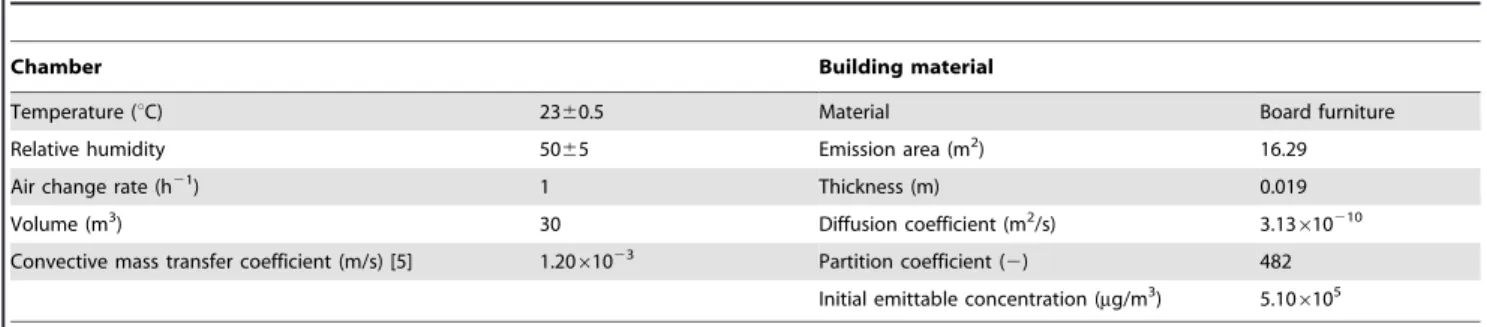
Table 1.Parameters of the chamber and the building material.
Chamber Building material
Temperature (uC) 2360.5 Material Board furniture
Relative humidity 5065 Emission area (m2) 16.29
Air change rate (h21) 1 Thickness (m) 0.019
Volume (m3) 30 Diffusion coefficient (m2/s) 3.13610210
Convective mass transfer coefficient (m/s) [5] 1.2061023 Partition coefficient (
2) 482
Initial emittable concentration (mg/m3) 5.106105
doi:10.1371/journal.pone.0080736.t001
Table 2.Parameters of the reference living room and the furniture.
Reference living room Furniture
Volume (m3) 57.2 Mean thickness of board (m) 0.019
Loading factor (m2/m3) 0.42 Diffusion coefficient (m2/s) 3.13610210
Air change rate (h21) 1 Partition coefficient (
2) 482
Convective mass transfer coefficient (m/s) 1.2061023 Initial emittable concentration (mg/m3) 5.106105
have errors, the influence of the measurement errors inD,K, and
C0on the model prediction error in indoor VOC/formaldehyde concentration needs to be studied.
The information of the reference living room (obtained by Yao in 2011 from a survey of 1500 homes in Beijing) is used in this error analysis for model prediction of emissions. The information of the reference living room in Beijing includes the volume, furniture loading factor, ventilation etc. The information of the reference living room and the emission characteristic parameters of the furniture are given in Table 2. Formaldehyde is selected as the chemical pollutant. Deng’s model is used for the prediction of the indoor formaldehyde concentration.
Results and Discussion
Error analysis of Model Prediction in a Ventilated Chamber
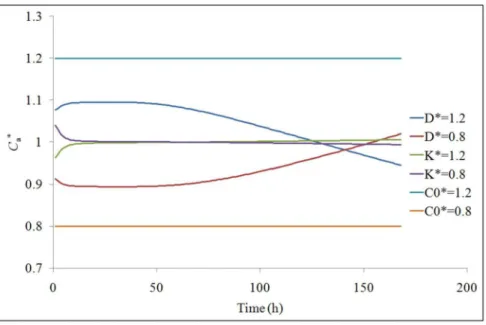
The influence of the measurement errors inD,K, andC0on the model prediction errors in Ca is shown in Figure 4. The normalizedD, K, andC0(represented asD*,K*, andC0*) are the ratio of D, K, and C0 with given errors (620%), to the measurement data of D, K, and C0. The normalized Ca (represented asCa*) is the ratio of the model prediction value of
CausingD,K, andC0with given errors to the model prediction value of Causing the measurement data of D, K, andC0. The values ofCa*are the same as the input values ofC0*indicating the errors inC0transferred directly into the model prediction errors in
Ca. The influence of the errors inDandKon the model prediction Figure 4. Influence of the measurement errors inD,K, andC0on the model prediction errors inCa(single variable).
doi:10.1371/journal.pone.0080736.g004
errors inCa,changes over time. A positive error inDresults in a positive error inCaduring the initial emission period. In contrast, a positive error inKresults in a negative error inCaduring the initial emission period. A 20% error inDresults in a maximum of 10% error inCa. A 20% error inKresults in a maximum of 4% error in
Ca. Therefore, the error inC0 has the greatest influence on the model prediction error in Cawhile the error in K has the least influence on the model prediction error inCa.
The measurement data and the model prediction of formalde-hyde concentrations in the ventilated chamber (Ca) are shown in Figure 5. The R2
value between the measurement data and the model prediction is 0.96. As analyzed before, positive errors inC0 andDand negative error inKresult in positive error inCa. The maximum positive error inCaexists when a 20% error exists inC0 and D, and a 220% error exists inK. The maximum negative error inCaexists when a220% error exists inC0and D, and a 20% error exists inK. The maximum positive and negative errors inCaare 35% and229%, respectively. Comparing theCacurve with positive error to the originalCa, the R-value and p-value are 0.99 and 0.009, respectively. Comparing the Ca curve with negative error to the originalCa, the R-value and p-value are 0.99 and 0.001, respectively.
Error Analysis of Model Prediction in a Reference Living Room
The error transfer in the reference living room is the same as in the ventilated chamber. The maximum positive error inCais 35% when a 20% error exists inC0andD, and a220% error exists in
K. The maximum negative error inCais229% when a220% error exists inC0andD, and a 20% error exists inK.
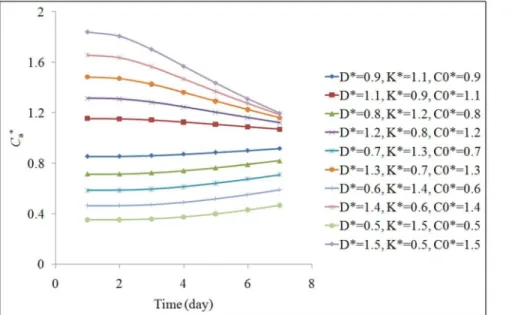
A series of error analyses are shown in Figure 6. The errors inD,
K, andC0are set in the range from610% to650% of their mean value. The errors inD,K, andC0can all result in the errors in the predictedCa. The additive effect magnifies the maximum errors of
Ca, which are in the range of615% when the errors in the input
D,K, andC0are in the range of610%. However, as time passes, the errors in the predictedCatend to converge.
To address the correlation betweenD*, K*, C0 *
, and Ca *
, the errors inD,K, andC0are randomly set by computer from610%
to650% and the error inCais calculated using Deng’s model. The series of the error analysis data were studied using the Lervenberg-Marquardt algorithm for regression to obtain the correlation betweenD*,K*,C0*andCa*. The fitted correlation for
D*,K*,C0*, andCa*is written as:
Ca~1:05D0:30K0:02C0exp ({0:02Dt) ð5Þ
TheR2value between the model prediction value ofCa *
and the correlation calculated value of Ca
*
is 0.93 when D is of the magnitude of 10210m2/s,Kis of the magnitude of 102(2), andC0 is of the magnitude of 105mg/m3.
Influence of Temperature on Model Prediction of Emissions
Temperature fluctuation is a common phenomenon in reality when measuring VOC/formaldehyde emissions from building materials in environmental chambers and in households that use air conditioning. There are standard guidelines for controlling temperature when measuring VOC/formaldehyde emissions from building materials in environmental chambers e.g., ASTM D6670 specifies that the temperature be 2360.5uC while the Chinese GB 18584 has a temperature requirement of 2362uC [26,27].
Temperature is an important environmental factor that has a great influence on the emission characteristic parameters of building materials. The experimental correlations between tem-perature and the emission parameters (D, K, andC0) in previous studies for formaldehyde in medium density board are summa-rized as:
D~A1T1:25|exp (B1=T) 28½ ð6Þ
K~A2T0:5|exp (B2=T) 29½ ð7Þ
C0~exp (A3{B3=T)=T½30 ð8Þ
where, T is the temperature (K);A1, A2, A3, B1, B2, B3 are the constants independent of temperature. Based on equations (6)–(8), the following relationships can be derived:
DDT
DDT~296K
~( T
296)
1:25|exp (B1 T {
B1
296) ð9Þ
KDT
KDT~296K
~( T 296)
0:5|exp (B2 T {
B2
296) ð10Þ
C0DT
C0DT~296K
~296
T exp ( B3 296{
B3
T) ð11Þ
where,B1=28032,B2= 6741, andB3= 7030.
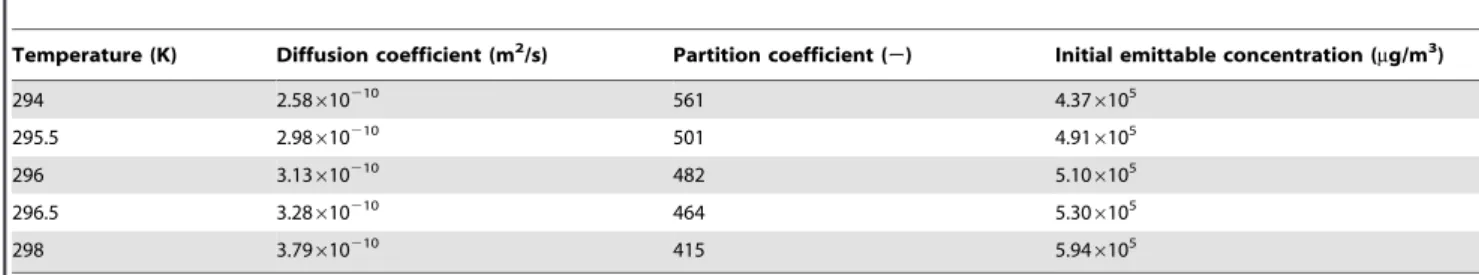
The calculation of the temperature effect was performed in the reference living room in Beijing using Deng’s model. The temperature and the emission parameters (D, K, andC0) at each temperature are calculated using the experimental correlations (9) to (11) and are listed in Table 3. The temperature fluctuation from
295.5 K to 296.5 K can result in errors inDfrom25% to 5%, in
Kfrom 4% to24%, and inC0from24% to 4%, respectively. A temperature fluctuation from 294 K to 298 K can result in errors inDfrom218% to 21%, inKfrom 16% to214%, and inC0from 214% to 16%, respectively.
A simulation of the indoor formaldehyde concentration in the reference living room over 1 month is shown in Figure 7. The concentration decreases from 101mg/m3to below 5mg/m3. The
temperature fluctuation range of 22.5uC to 23.5uC can result in a maximum error range in Ca of 26% to 7%. The temperature fluctuation range from 21uC to 25uC can result in a maximum error range inCaof210% to 29%. The values ofCaobtained under temperature fluctuation are compared with the value ofCa at 23uC. The p-values for the comparisons are much less than 0.01. In general, an increase in temperature results in positive errors in Ca, and a decrease in temperature results in negative errors inCa.
Model predictions of VOC/formaldehyde emissions from building materials make some assumptions to simplify the model, e.g., homogenous material, one dimension mass transfer and no chemical reactions. However, emissions of VOC/formaldehyde from building materials in reality are always much more complex. Environmental conditions such as temperature fluctuations, relative humidity, and air speed, can cause fluctuation of the VOC/formaldehyde concentration. Chemical reactions for active VOCs and formaldehyde in building materials and the air
Table 3.Parameters for temperature influence study.
Temperature (K) Diffusion coefficient (m2/s) Partition coefficient (
2) Initial emittable concentration (mg/m3)
294 2.58610210 561 4.376105
295.5 2.98610210 501 4.916105
296 3.13610210 482 5.106105
296.5 3.28610210 464 5.306105
298 3.79610210 415 5.946105
doi:10.1371/journal.pone.0080736.t003
sometimes occur, e.g., in the presence of ozone. However, model predictions provide ideal evaluations of VOC/formaldehyde concentrations in the indoor environment, and can agree well with the experimental data from well-performed environmental chamber tests [8,31,32].
Conclusions
This study investigates the influence of the measurement accuracy of the emission characteristic parameters of building materials on model prediction error when using a model to predict emissions in environmental chambers and in a reference living room in Beijing. A general correlation between the errors in the emission parameters (D, K, and C0), and the error in the model prediction value of VOC/formaldehyde concentration (Ca) in the air in indoor environment is derived. The error in C0 has the largest and linear influence on the error inCa, while the error inK has the least influence. The largest error inCaalways appears in the initial emission period and tends to converge thereafter. Temperature is an important environmental factor, the control accuracy of which can affect the emission parameters ofD,K, and
C0, and thus influences the calculation using mass transfer models
and results in the errors in predictions ofCa. Since temperature fluctuations can increase or decreaseDandC0at the same time, the additive effect always enhances the errors in Ca during the initial emission period.
This study provides statistical results summarizing the measure-ment accuracy of emission key parameters in previous studies, and addresses the influence of measurement errors in emission characteristic parameters on model prediction of indoor VOC/ formaldehyde concentrations. It is shown in this statistical study that the measurement errors in the emission characteristic parameters can reasonably result in 10% to 30% prediction errors in indoor VOC/formaldehyde concentrations. It might be helpful for researchers or engineers who do simulations of indoor air chemical pollutants to carefully select the emission characteristic parameters for model predictions.
Author Contributions
Conceived and designed the experiments: WW JX YZ. Performed the experiments: WW. Analyzed the data: WW JX. Contributed reagents/ materials/analysis tools: WW JX. Wrote the paper: WW JX YZ.
References
1. World Health Organization (WHO) (2000) Guidelines for air quality. Airimpacts website. Available: http://www.airimpacts.org/documents/local/AQGUIDE. pdf. Accessed 2013 July 13.
2. Choi H, Schmidbauer N, Sundell J, Hasselgren M, Spengler J, et al. (2010) Common household chemicals and the allergy risks in pre-school age children. Plos One 5: 1–10.
3. Liu Z, Ye W, Little JC (2013) Predicting emissions of volatile and semivolatile organic compounds from building materials: a review. Building and Environ-ment 64: 7–25.
4. Yu CWF, Kim JT (2013) Material emissions and indoor simulation. Indoor and Built Environment 22: 21–29.
5. Xu Y, Zhang YP (2003) An improved mass transfer based model for analyzing VOC emissions from building materials. Atmospheric Environment 37: 2497– 2505.
6. Deng BQ, Kim CN (2004) An analytical model for VOCs emission from dry building materials. Atmospheric Environment 38: 1173–1180.
7. Li F, Niu JL (2005) Simultaneous estimation of VOCs diffusion and partition coefficients in building materials via inverse analysis. Building and Environment 40: 1366–1374.
8. Cox SS, Liu Z, Little JC, Howard-Reed C, Nabinger SJ, et al. (2010) Diffusion-controlled reference material for VOC emissions testing: proof of concept. Indoor Air 20: 424–33.
9. Cox SS, Zhao DY, Little JC (2001) Measuring partition and diffusion coefficients for volatile organic compounds in vinyl flooring. Atmospheric Environment 35: 3823–3830.
10. Cox SS, Little JC, Hodgson AT (2001) Measuring concentrations of volatile organic compounds in vinyl flooring. Journal of the Air & Waste Management Association 51: 1195–1201.
11. Xiong JY, Zhang YP, Wang XK, Chang DW (2008) Macro-meso two-scale model for predicting the VOC diffusion coefficients and emission characteristics of porous building materials. Atmospheric Environment 42: 5278–5290. 12. Wang XK, Zhang YP (2009) A new method for determining the initial mobile
formaldehyde concentrations, partition coefficients, and diffusion coefficients of dry building materials. Journal of the Air & Waste Management Association 59: 819–825.
13. He ZK, Wei WJ, Zhang YP (2010) Dynamic-static chamber method for simultaneous measurement of the diffusion and partition coefficients of VOCs in barrier layers of building materials. Indoor and Built Environment 19: 465–475. 14. Xiong JY, Yao Y, Zhang YP (2011) C-history method: rapid measurement of the initial emittable concentration, diffusion and partition coefficients for formalde-hyde and VOCs in building materials. Environmental Science & Technology 45: 3584–3590.
15. Xiong JY, Yan W, Zhang YP (2011) Variable volume loading method: a convenient and rapid method for measuring the initial emittable concentration and partition coefficient of formaldehyde and other aldehydes in building materials. Environmental Science & Technology 45: 10111–10116.
16. Xiong JY, Huang SD, Zhang YP (2012) A Novel Method for Measuring the Diffusion, Partition and Convective Mass Transfer Coefficients of Formaldehyde and VOC in Building Materials. Plos One 7: 1–8.
17. Haghighat F, Lee CS, Ghaly WS (2002) Measurement of diffusion coefficients of VOCs for building materials: review and development of a calculation procedure. Indoor Air 12: 81–91.
18. Mlynar MF (1998) Formaldehyde round robin testing update. Tappi Journal 81: 185–188.
19. De Bortoli M, Kephalopoulos S, Kirchner S, Schauenburg H, Vissers H (1999) State-of-the-art in the measurement of volatile organic compounds emitted from building products: Results of European interlaboratory comparison. Indoor Air 9: 103–116.
20. Rappengluck B, Apel E, Bauerfeind M, Bottenheim J, Brickell P (2006) The first VOC intercomparison exercise within the Global Atmosphere Watch (GAW). Atmospheric Environment 40: 7508–7527.
21. Oppl R (2008) Reliability of VOC emission chamber testing - progress and remaining challenges. Gefahrstoffe Reinhaltung Der Luft 68: 83–86. 22. Howard-Reed C, Liu Z, Benning J, Cox SS, Samarov D, et al. (2011)
Diffusion-controlled reference material for volatile organic compound emissions testing: Pilot inter-laboratory study. Building and Environment 46: 1504–1511. 23. Wang XK, Zhang YP (2011) General analytical mass transfer model for VOC
emissions from multi-layer dry building materials with internal chemical reactions. Chinese Science Bulletin 56: 222–228.
24. Yao Y, Xiong JY, Liu WW, Mo JH, Zhang YP (2011) Determination of the equivalent emission parameters of wood-based furniture by applying C-history method. Atmospheric Environment 45: 5602–5611.
25. Yao Y (2011) Research on Some Key Problems of Furniture VOC Emission Labeling System. Ph.D thesis Tsinghua University.
26. ASTM D6670 (2007) Standard practive for full-scale chamber determination of volatile organic emissions from indoor materials/products.
27. GB 18584 (2013) Limit of harmful substances of wood based furniture. In draft. 28. Deng QQ, Yang XD, Zhang JS (2009) Study on a new correlation between diffusion coefficient and temperature in porous building materials. Atmospheric Environment 43: 2080–2083.
29. Zhang YP, Luo XX, Wang XK, Qian K, Zhao RY (2007) Influence of temperature on formaldehyde emission parameters of dry building materials Atmospheric Environment 41: 3203–3216.
30. Xiong JY, Wei WJ, Huang SD, Zhang YP (2013) Association between the emission rate and temperature for chemical pollutants in building materials: General correlation and understanding. Environmental Science & Technology 47: 8540–8547.
31. Wei WJ, Greer S, Howard-Reed C, Persily A, Zhang YP (2012) VOC emissions from a LIFE reference: Small chamber tests and factorial studies. Building and Environment 57: 282–289.