ACPD
14, 10463–10514, 2014Distributions and overlap of various
cloud types
J. Li et al.
Title Page
Abstract Introduction
Conclusions References
Tables Figures
◭ ◮
◭ ◮
Back Close
Full Screen / Esc
Printer-friendly Version Interactive Discussion
Discussion
P
a
per
|
D
iscussion
P
a
per
|
Discussion
P
a
per
|
Discuss
ion
P
a
per
|
Atmos. Chem. Phys. Discuss., 14, 10463–10514, 2014 www.atmos-chem-phys-discuss.net/14/10463/2014/ doi:10.5194/acpd-14-10463-2014
© Author(s) 2014. CC Attribution 3.0 License.
Atmospheric Chemistry and Physics
Open Access
Discussions
This discussion paper is/has been under review for the journal Atmospheric Chemistry and Physics (ACP). Please refer to the corresponding final paper in ACP if available.
Distributions and radiative forcings of
various cloud types based on active and
passive satellite datasets – Part 1:
Geographical distributions and overlap of
cloud types
J. Li1, J. Huang1, K. Stamnes2, T. Wang1, Y. Yi3, X. Ding1, Q. Lv1, and H. Jin1
1
Key Laboratory for Semi-Arid Climate Change of the Ministry of Education, College of Atmospheric Sciences, Lanzhou University, Lanzhou, China
2
Department of Physics and Engineering Physics, Stevens Institute of Technology, Hoboken, NJ, USA
3
ACPD
14, 10463–10514, 2014Distributions and overlap of various
cloud types
J. Li et al.
Title Page
Abstract Introduction
Conclusions References
Tables Figures
◭ ◮
◭ ◮
Back Close
Full Screen / Esc
Printer-friendly Version Interactive Discussion
Discussion
P
a
per
|
D
iscussion
P
a
per
|
Discussion
P
a
per
|
Discuss
ion
P
a
per
Received: 12 February 2014 – Accepted: 4 April 2014 – Published: 25 April 2014
Correspondence to: J. Huang ([email protected])
ACPD
14, 10463–10514, 2014Distributions and overlap of various
cloud types
J. Li et al.
Title Page
Abstract Introduction
Conclusions References
Tables Figures
◭ ◮
◭ ◮
Back Close
Full Screen / Esc
Printer-friendly Version Interactive Discussion
Discussion
P
a
per
|
D
iscussion
P
a
per
|
Discussion
P
a
per
|
Discuss
ion
P
a
per
|
Abstract
Based on four year’ 2B-CLDCLASS-Lidar (Radar-Lidar) cloud classification product from CloudSat, we analyze the geographical distributions of different cloud types and their co-occurrence frequency across different seasons, moreover, utilize the vertical distributions of cloud type to further evaluate the cloud overlap assumptions.
5
The statistical results show that more high clouds, altocumulus, stratocumulus or stratus and cumulus are identified in the Radar-Lidar cloud classification product com-pared to previous results from Radar-only cloud classification (2B-CLDCLASS product from CloudSat). In particularly, high clouds and cumulus cloud fractions increased by factors 2.5 and 4–7, respectively. The new results are in more reasonable agreement 10
with other datasets (typically the International Satellite Cloud Climatology Project (IS-CCP) and surface observer reports). Among the cloud types, altostratus and altocumu-lus are more popular over the arid/semi-arid land areas of the Northern and Southern Hemispheres, respectively. These features weren’t observed by using the ISCCP D1 dataset.
15
For co-occurrence of cloud types, high cloud, altostratus, altocumulus and cumulus are much more likely to co-exist with other cloud types. However, stratus/stratocumulus, nimbostratus and convective clouds are much more likely to exhibit individual features. After considering the co-occurrence of cloud types, the cloud fraction based on the random overlap assumption is underestimated over the vast ocean except in the west-20
central Pacific Ocean warm pool. Obvious overestimations are mainly occurring over land areas in the tropics and subtropics. The investigation therefore indicates that in-corporate co-occurrence information of cloud types based on Radar-Lidar cloud clas-sification into the overlap assumption schemes used in the current GCMs possible be able to provide an better predictions for vertically projected total cloud fraction.
ACPD
14, 10463–10514, 2014Distributions and overlap of various
cloud types
J. Li et al.
Title Page
Abstract Introduction
Conclusions References
Tables Figures
◭ ◮
◭ ◮
Back Close
Full Screen / Esc
Printer-friendly Version Interactive Discussion
Discussion
P
a
per
|
D
iscussion
P
a
per
|
Discussion
P
a
per
|
Discuss
ion
P
a
per
1 Introduction
As the most important regulators of the Earth’s climate system, clouds may significantly affect the radiation budget, the hydrological cycle and the large-scale circulation of the Earth (Hartmann et al., 1992; Stephens, 2005). However, due to an incomplete knowledge of the underlying physical processes, clouds are still poorly represented in 5
climate and weather models (Zhang et al., 2005), and thus are considered as the major source of uncertainty in predictions of climate change by general circulation models (GCMs) (Cess et al., 1990).
In various cloud properties, cloud type and their overlap, which are two of the impor-tant cloud macro-physical properties, are of particular significance for the earth’s radia-10
tion budget and hydrological cycle. On the one hand, different cloud types are governed by different kinds of atmospheric motions and have different microphysical properties, thus can result in quite different cloud radiative forcings (Ackerman et al., 1988; Betts and Boers, 1990; Hartmann et al., 1992) and may bring about distinguishing precip-itation forms and intensities. On the other hand, frequent co-occurrences of different 15
cloud types in the atmosphere further intensify the complexity of present cloud clima-tology studies. Cloud overlap variations can significantly change atmospheric radia-tive heating/cooling rates, atmospheric temperature, hydrological processes, and daily variability (Chen and Cotton, 1987; Liang and Wu, 2005; Morcrette and Jakob, 2000), with important implications for the radiative balance of the surface-troposphere system 20
(Stephens et al., 2004). In addition, the presence of cloud overlap also introduces sig-nificant errors in the retrievals of cloud properties with passive satellite cloud retrieval techniques (Stephens et al., 2004), which are based on the typical single-layered cloud assumption. Therefore, to further aid radiation calculations of climate prediction models and help understand cloud physical processes and evaluate the schemes for generat-25
ACPD
14, 10463–10514, 2014Distributions and overlap of various
cloud types
J. Li et al.
Title Page
Abstract Introduction
Conclusions References
Tables Figures
◭ ◮
◭ ◮
Back Close
Full Screen / Esc
Printer-friendly Version Interactive Discussion
Discussion
P
a
per
|
D
iscussion
P
a
per
|
Discussion
P
a
per
|
Discuss
ion
P
a
per
|
Until now, many related works with cloud type and cloud overlap, which based on several fundamentally different types of passive observational datasets (typically the In-ternational Satellite Cloud Climatology Project (ISCCP) and surface observer reports), have focused on the geographic distributions and long-term variations of different cloud types (e.g. Rossow and Schiffer, 1991, 1999; Hahn et al., 2001; Warren et al., 2007; 5
Eastman et al., 2011, 2013), and their radiative effect investigations (Hartmann et al., 1992; Chen et al., 2000; Yu et al., 2004), or specially aimed at the cloud properties retrieval of multilayered cloud by using multi-channel measurements from passive sen-sors (Chang and Li, 2005a, b; Huang et al., 2005, 2006a; Minnis et al., 2007), and the statistics of cloud overlap based on the surface weather reports and the measure-10
ments from the ground-based cloud radar (Warren et al., 1985; Minnis et al., 2005; Hogan and Illingworth, 2000). However, these studies have non-negligible limitations and uncertainties due to passive detection methods and cloud classification algorithms generally fail to effectively detect multilayered clouds. First, the existence of overlapping cloud layers may cause the upper clouds to be hidden from the view of a ground ob-15
server, and lower clouds to be hidden from the view of a passive satellite which leads to a significant underestimation of high and low cloud frequencies by surface observer re-ports and ISCCP, thus introduce significant biases in the trends analysis of cloud-type cover, retrievals of cloud properties and evaluation of cloud radiative forcings of diff er-ent cloud types. Second, most of these studies are limited to specific locations, time 20
periods or multilayered cloud systems, systematic researches about the co-occurrence statistics of different cloud types on a global scale still have received much less atten-tion. Thus, compared to passive observations, observational studies of cloud types and co-occurrence variations on a global scale based on active remote sensing from satel-lites are recognized as an important step to improve cloud representation in weather 25
unprece-ACPD
14, 10463–10514, 2014Distributions and overlap of various
cloud types
J. Li et al.
Title Page
Abstract Introduction
Conclusions References
Tables Figures
◭ ◮
◭ ◮
Back Close
Full Screen / Esc
Printer-friendly Version Interactive Discussion
Discussion
P
a
per
|
D
iscussion
P
a
per
|
Discussion
P
a
per
|
Discuss
ion
P
a
per
dented opportunity for detailed studying the three-dimensional structures of cloud and related radiative forcings on a global scale. Since becoming available in the middle of June 2006, CALIPSO and CloudSat data have been widely used to investigate the three-dimensional distributions and structures of hydrometeor, and improve the cloud overlap assumption used in GCMs (e.g. Luo et al., 2009; Kato et al., 2010; Barker, 5
2008). In this study, we plan to use the latest cloud classification product based on the combined measurements of these two active sensors to investigate the geograph-ical distributions and co-occurrence frequencies of different cloud types, and further evaluate how well the cloud overlap assumptions can characterize the overlap of two apparently separated cloud types. Although some statistical results are in reasonable 10
agreement with previous works, additional new insights are also gained in this investi-gation. It is hoped that these new results will be useful for future GCM evaluation and improvement.
The study is organized as follows. The dataset used is described in Sect. 2. Section 3 mainly analyzes the global, zonal distributions and diurnal variations of different cloud 15
types based on the new dataset. Comparisons of global mean fractions of different cloud types from several datasets are provided in Sect. 4. Section 5 firstly gives the zonal distributions and global statistics of co-occurrence frequency of different cloud types, then further evaluates the performance of cloud overlap assumptions based on co-occurrence frequency of cloud types.
20
2 Data
In the following study, four years (2007–2010) of data from the latest release of the CloudSat 2B-CLDCLASS-Lidar (version 1.0) product, which is referred as Radar-Lidar cloud classification, are collected to analyze cloud types and discuss their geographi-cal distributions and overlap variations on a global sgeographi-cale. The algorithm of this product 25
aux-ACPD
14, 10463–10514, 2014Distributions and overlap of various
cloud types
J. Li et al.
Title Page
Abstract Introduction
Conclusions References
Tables Figures
◭ ◮
◭ ◮
Back Close
Full Screen / Esc
Printer-friendly Version Interactive Discussion
Discussion
P
a
per
|
D
iscussion
P
a
per
|
Discussion
P
a
per
|
Discuss
ion
P
a
per
|
iliary measurements from the other passive sensors (such as, infrared and microwave radiometers). It is well known that traditional surface observations identify cloud by using some basic features (e.g. base height, horizontal and vertical dimensions, pre-cipitation types) of the major cloud types (World Meteorological Organization, 1956; Parker, 1988; Moran et al., 1997). Based on these basic cloud characteristics, Wang 5
and Sassen (2001) classified cloud types into eight classes and further indicated the overall agreement (about 70 %) between the results from their algorithm and surface visual observations from the Southern Great Plains (SGP) CART site.
According to the algorithm presented by Wang and Sassen (2001), the Radar-Lidar cloud classification identifies the cloud types by using two main steps. First, combined 10
radar and lidar cloud mask results are used to find a cloud cluster according to their persistence in the horizontal and vertical directions. A minimum horizontal extent for a cluster is required, therefore, a cloud cluster permits horizontally broken, but verti-cally similar cloud fields. By performing the cloud clustering analysis, a CloudSat gran-ule may be divided into a number of cloud clusters depending on the cloud systems 15
present. Once a cloud cluster is found, cloud height and phase, maximum effective Radar reflectivity factor (Ze) and its temperature, as well as the occurrence of precipi-tation, are then determined. Second, the cluster mean properties as well as spatial in-homogeneties in terms of cloud top height, lidar and radar maximum signals are sent to a fuzzy classifier to classify the cluster into one cloud type with an assigned confidence 20
level. To improve classification flexibility, a combination of rule based and fuzzy logical based classification is used in this algorithm. The cloud phase determination is based on rule-based logics and the cloud type classification is mainly based on the fuzzy logics (see Wang et al., 2010, Level 2 combined radar and lidar cloud scenario classi-fication product process description and interface control document, version 1.0, 2013, 25
ACPD
14, 10463–10514, 2014Distributions and overlap of various
cloud types
J. Li et al.
Title Page
Abstract Introduction
Conclusions References
Tables Figures
◭ ◮
◭ ◮
Back Close
Full Screen / Esc
Printer-friendly Version Interactive Discussion
Discussion
P
a
per
|
D
iscussion
P
a
per
|
Discussion
P
a
per
|
Discuss
ion
P
a
per
type includes cirrus, cirrocumulus and cirrostratus, and the Cu cloud type represents cumulus congestus and fair weather cumulus. These types may be further classified into sub-types to refine ice water path (IWC) and liquid water path (LWC) retrievals. Fol-lowed the study of Sassen and Wang (2008), we also combine two level cloud types (St and Sc) as St+Sc in present study in order to compare the results with other datasets. 5
Due to combine the unique complementary capabilities of Cloud profile radar (CPR) from CloudSat and space-based polarization lidar (CALIOP), some CPR weaknesses (e.g. high surface contamination in the lowest three to four vertical bins of CPR, and lower sensitivity to optically thin clouds) will be minimized in the latest Radar-Lidar cloud classification product, this eventually led to the significant improvement for High 10
(cirrus or cirrostratus) and lower cloud types (such as, St, Sc and Cu) identification in the 2B-CLDCLASS-Lidar product (please see Table 1 about the detail information).
Following cloud parameters in the 2B-CLDCLASS-Lidar product are used in this study: cloud layer (CL), Cloud Layer Type (CLTY). In order to map the regional vari-ability of the studied variable, we group the global area into 2◦
×2◦ grid boxes in order
15
to collect a sufficient number of samples in each grid box. Following the definitions of cloud fraction and cloud amount by Hagihara et al. (2010), cloud-type fractions in the following study are defined as the ratio of the number of profiles for a certain cloud type to the total number of sample profiles within a given grid box during spring (March, April and May), summer (June, July and August), autumn (September, October and 20
November) and winter (December, January and February). The cloud-type amounts in a given grid box are defined as the number of a certain cloud type profiles divided by the number of total cloud profiles collected in this box. In addition, cloud fraction differences for single-layered clouds and multilayered clouds (two or more cloud lay-ers in a profile) between day- and night-time also are further analyzed and discussed 25
ACPD
14, 10463–10514, 2014Distributions and overlap of various
cloud types
J. Li et al.
Title Page
Abstract Introduction
Conclusions References
Tables Figures
◭ ◮
◭ ◮
Back Close
Full Screen / Esc
Printer-friendly Version Interactive Discussion
Discussion
P
a
per
|
D
iscussion
P
a
per
|
Discussion
P
a
per
|
Discuss
ion
P
a
per
|
this 2B-CLDCLASS-Lidar product is used to improve the classifications of optically thin clouds and lower cloud types. Due to the strong solar noise signature, the difference of cloud types between day and night in present study will be affected by the solar noise effects, especially for cirrus of High cloud type. However, by analyzing the day-night dif-ference of highest (and presumably optically thinnest) cirrus at the tropical tropopause, 5
Sassen et al. (2008) showed that this type cirrus is not significantly different between day and night, but the frequency of deep convective anvil-cirrus somewhat below is noticeably greater at night. The observed diurnal variations of cirrus mostly reflect real cloud process (Sassen et al., 2009). For other cloud types, the uncertainty caused by the daylight noise for Lidar may be smaller. Thus, although slight overestimation is exist 10
for the day-night difference of cirrus, the observed diurnal variations of different cloud types in this investigation still are reliable.
3 Geographical distributions and diurnal variations of different cloud types 3.1 Global distribution and diurnal variation of each cloud type
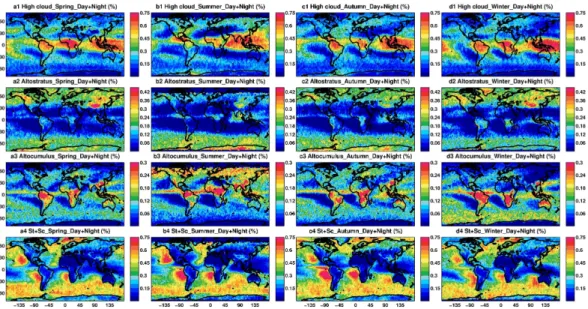
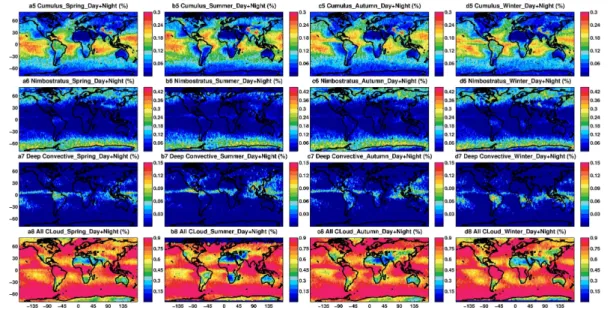
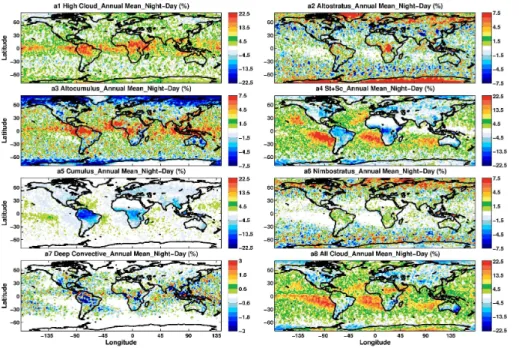
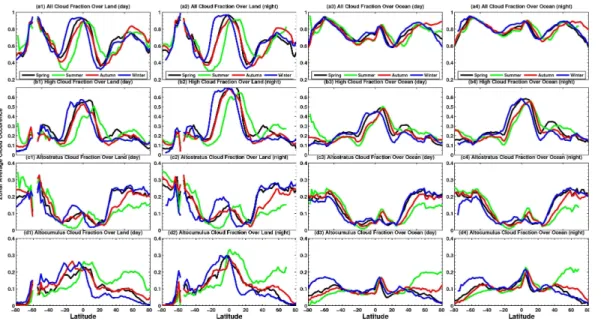
Figures 1 and 2 show the seasonal variations of mean day plus night frequencies and 15
global distributions of the annual mean night minus day frequencies for different cloud types, averaged over 2◦
×2◦ grid boxes based on the 2B-CLDCLASS-Lidar product, respectively. In Fig. 1, from left to right, the columns present the cloud fractions of dif-ferent cloud types during spring, summer, autumn and winter. As indicated by Fig. 1, the seasonal variations of spatial patterns and cloud fractions for most of the cloud 20
types are obvious. High clouds (cirrus, cirrostratus and cirrocumulus) are (Fig. 1a1–d1) mainly concentrated in the inter-tropical convergence zone (ITCZ), which is correlated with deep convective clouds (see Fig. 1a7–d7) (Mace et al., 2006; Sassen et al., 2009), and the cloud fractions may exceed 60 % over the several typical high-value centers, such as the equatorial central South America, western Africa, Indonesia and the west-25
ACPD
14, 10463–10514, 2014Distributions and overlap of various
cloud types
J. Li et al.
Title Page
Abstract Introduction
Conclusions References
Tables Figures
◭ ◮
◭ ◮
Back Close
Full Screen / Esc
Printer-friendly Version Interactive Discussion
Discussion
P
a
per
|
D
iscussion
P
a
per
|
Discussion
P
a
per
|
Discuss
ion
P
a
per
circulation, the small high cloud frequency is very apparent in the subtropics. It is worth noting that tropical high cloud fractions, especially at the several high-value centers, have noticeably higher frequencies at night compared to day (even exceeding 13.5 %) even if their patterns are quite similar, whereas high cloud frequencies in other regions (such as mid- to high latitudes) generally show small differences (see Fig. 2a1). For 5
cirrus of high clouds, Sassen et al. (2008) found a global average frequency of cirrus cloud occurrence of 16.7 % (mean day plus night), with 15.2 % for day and 18.3 % for night based on A-train overpasses. In this study, the global average high cloud fre-quencies are 24.3 % and 29.3 % for day- and night-time, respectively. Therefore, it is clear that the corresponding globally averaged frequencies of cirrostratus and cirrocu-10
mulus are about 9.1 % and 11 % for day- and night-time, respectively. Although cirrus and cirrostratus/cirrocumulus both contribute to the diurnal variability of the total day-night difference of the high cloud fraction, the pattern of difference due to cirrus still is very close to that due to high clouds, and its difference accounts for a significant great proportion (about 62 %) of the globally averaged difference. In view of the high and 15
thin tropopause transitional layer (TTL), cirrus clouds do not display a noticeable diur-nal variation. Thus, the effect of CALIOP signal noise from scattered sunlight only can cause a small part of the total cirrus cloud occurrence differences (Sassen et al., 2008). The diurnal cirrus patterns mostly still reflect real cloud processes. The apparent day-night difference over the tropical ocean (such as, western coastline of continents) and 20
tropical landmasses and island chains (such as, northern South America, equatorial Africa, and the western Pacific) are mainly caused by the prevalent subvisual (optical depth<0.03) and thin cirrus clouds (0.03<optical depth<0.3), respectively (Sassen et al., 2009). However, the recent work by Behrangi et al. (2012) showed by using 2B-CLDCLASS product that high clouds are much more abundant during daytime over the 25
generat-ACPD
14, 10463–10514, 2014Distributions and overlap of various
cloud types
J. Li et al.
Title Page
Abstract Introduction
Conclusions References
Tables Figures
◭ ◮
◭ ◮
Back Close
Full Screen / Esc
Printer-friendly Version Interactive Discussion
Discussion
P
a
per
|
D
iscussion
P
a
per
|
Discussion
P
a
per
|
Discuss
ion
P
a
per
|
ing mechanisms, including deep convection, synoptic jet stream, orographic lifting and frontal activity (Sassen, 2002; Warren et al., 1985) or condensation trails from aircraft (Boucher, 1999; Minnis et al., 2004). Thus night/day differences at these latitudes also reflect diurnal differences of generating mechanisms.
As one of the mid-level cloud types, altostratus (Fig. 1a2–d2) is widely distributed 5
at middle and high latitudes, such as over storm tracks and Antarctica. The obvious high-value centers are located at the Tibetan Plateau of China, northwest of USA and Canada and in most regions of Antarctica. But, they vary considerably across different seasons. For example, the altostratus cloud coverage over the Tibetan Plateau both during winter and spring reach maximum values (exceed 40 %), then apparently de-10
crease in summer and autumn. Based on the ISCCP dataset, Yu et al. (2004) pointed out that the seasonal variations of nimbostratus and altostratus clouds over subtrop-ical East Asia might be caused by the seasonal frictional and blocking effects of the Tibetan Plateau. In addition, during summer and autumn, the altostratus clouds also exhibit apparent high fractions (reaching 36 %) over Antarctica. Altostratus occurring at 15
the mid- and high latitudes, are possibly related to the frequent frontal activities in these regions. For the day-night difference of altostratus (Fig. 2a2), more altostratus clouds can be seen over the south-polar region and central Africa during night compared to day. However, the pattern is opposite at other latitudes (such as, storm tracks).
Altocumulus (Ac) clouds (Fig. 1a3–d3) show a high occurrence frequency over land 20
in tropical and subtropical regions, which are strongly correlated with deep convective activities (see Fig. 1a7–d7). The obvious seasonal variation of peak-value centers over land corresponds to the seasonal shift of ITCZ. In addition, altocumulus clouds over the India, Bangladesh (Subrahmanyam and Kumar, 2013), the southeast part of China, and the northern part of Australia also have high cloud fractions. The apparent diurnal 25
variations of altocumulus mainly occur in the tropics (negative difference) and the polar regions (positive difference).
cen-ACPD
14, 10463–10514, 2014Distributions and overlap of various
cloud types
J. Li et al.
Title Page
Abstract Introduction
Conclusions References
Tables Figures
◭ ◮
◭ ◮
Back Close
Full Screen / Esc
Printer-friendly Version Interactive Discussion
Discussion
P
a
per
|
D
iscussion
P
a
per
|
Discussion
P
a
per
|
Discuss
ion
P
a
per
ters can be found over the semi-permanent subtropical marine stratocumulus sheets (Wood, 2012), such as the west coasts of North America, South America, and West Africa, where strati-form cloud fractions even may exceed 60 %. In addition, strati-form clouds also are widespread over the vast oceans of the Southern Hemisphere (cloud fraction beyond 50 %), particularly in the storm track where the super-cooled water 5
clouds are very frequent as well (Hu et al., 2010). The larger stratocumulus cover for the Southern Hemisphere compared to the Northern Hemisphere may be driven by increased stability and subsidence related to the configuration of elevated terrain to their east (Xu et al., 2004). In addition, the noticeably higher frequencies of strati-form at night compared to day are found in our study. The results are consistent with 10
other previous studies (Rozendaal et al., 1995; Bergman and Salby, 1996), and maybe mainly caused by the strong diurnal cycle of solar insolation and consequently radia-tive absorption of solar radiation during daytime in the upper levels of the cloud and large-scale dynamics (Wood et al., 2009). As indicated in Fig. 2a4, there are more strati-form clouds (even reaching 20 %) during nighttime distributed over the ocean of 15
several subtropical stratocumulus regions. However, the pattern is inverse over land, especially over central Africa and equatorial central South America, where the strati-form cloud fraction difference between night and day can exceed 10 %.
Due to being driven by convective heating from below, cumulus clouds are mainly concentrated over the ocean between 30◦S and 30◦N (see Fig. 1a5–d5). Moreover, 20
they are also observed much more frequently over ocean than over land, such as, the western and central tropical and subtropical oceans (Norris, 1998), which is probably due to the proximity to a water source. The high values and broad maximum of ob-served cumulus frequency in equatorial and subtropical latitudes over oceans of both hemispheres represent the persistent occurrence of “trade cumulus” in these regions 25
ACPD
14, 10463–10514, 2014Distributions and overlap of various
cloud types
J. Li et al.
Title Page
Abstract Introduction
Conclusions References
Tables Figures
◭ ◮
◭ ◮
Back Close
Full Screen / Esc
Printer-friendly Version Interactive Discussion
Discussion
P
a
per
|
D
iscussion
P
a
per
|
Discussion
P
a
per
|
Discuss
ion
P
a
per
|
higher frequencies of cumulus during day compared to night are mainly seen over land, especially over central Africa and the northern part of equatorial central South Amer-ica, where the difference in cumulus fraction between day and night can reach 20 %. The diurnal variation of cumulus fraction is smaller over ocean than over land, the dif-ferences do not exceed 5 %. In other words, cumulus cloud fractions tend to exhibit 5
positive difference between night- and daytime over ocean, and negative difference over land.
The other two main precipitating cloud distributions (Ns and Dc) are showed in the Fig. 1a6–d6 and 1a7–d7. Similar with the reports by surface observers, the Ns clouds are primarily located in mid and high latitudes (Warren et al., 1986, 1988). Seasonal 10
variations of global patterns are not apparent. Over mid-latitudes oceans, diurnal Ns effects seem to alternate between day and night (Fig. 2a6). However, deep convective clouds (Dc) are found mainly in the tropics but extend into the mid-latitudes. Actually, their distributions tend to concentrate at the inter-tropical convergence zone, and are thus very important for correct estimations of radiative and latent heat as well as precip-15
itation over this region. Figure 2a7 indicates a complex pattern of diurnal Dc variability over both land and ocean. The complex pattern of diurnal Dc variability is not consistent with recent studies (Sato et al., 2009; Behrangi et al., 2012), which indicated strong ev-idence for an oceanic night maximum in deep convective clouds. Sassen et al. (2009) showed that more extended observations and studies are needed to better grasp the 20
complex variability in convective activity that could be tied to local terrain and weather interactions. In a word, seasonal and diurnal variations of total cloud fraction (Figs. 1a8–d8 and 2a8) mainly depend on the respective contribution of each cloud type.
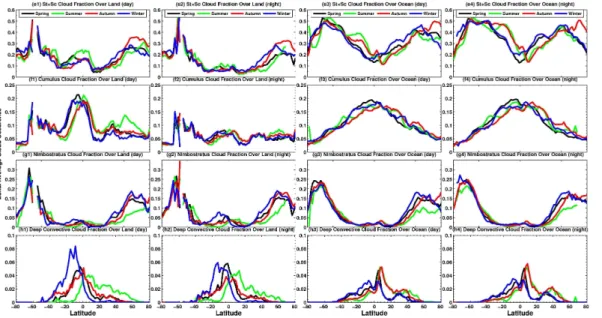
3.2 Zonal distributions of each cloud type
The seasonal variations of zonal distributions for different cloud types over land and 25
ACPD
14, 10463–10514, 2014Distributions and overlap of various
cloud types
J. Li et al.
Title Page
Abstract Introduction
Conclusions References
Tables Figures
◭ ◮
◭ ◮
Back Close
Full Screen / Esc
Printer-friendly Version Interactive Discussion
Discussion
P
a
per
|
D
iscussion
P
a
per
|
Discussion
P
a
per
|
Discuss
ion
P
a
per
(day) and ocean (night). For most of the cloud types, the cloud fractions over diff er-ent surfaces are significantly distinctive, and may mainly depend on the different water vapor supply, aerosol loading, surface temperature and topographies between ocean and land surfaces. For example, the most obvious differences over land and ocean of the total cloud fraction are located in the mid-latitudes and tropics, where more clouds 5
are present over land in the tropics and the trend is opposite in mid-latitudes. The peak in high clouds is found close to the mean latitude of the ITCZ and it is much more pronounced over land. In addition, we notice that there is peak of high clouds during spring (black line) in the northern middle latitudes that may be a result of high-level dust transport being misidentified as high ice clouds or a manifestation of actual 10
influences of dust on ice nucleation (Yu et al., 2012; Yuan and Oreopoulos, 2013). Cu-mulus and St/Sc are also observed much more frequently over the ocean than over land, and the results are consistent with surface observations (Warren et al., 1985). For the zonal distributions of these cloud types, strati-form and nimbostratus tend to increase in frequency toward the polar region, whereas the frequency of cumulus de-15
creases poleward. In addition, it is clear that the diurnal differences in cloud fraction and distributional patterns for different cloud types over the ocean are relatively smaller compared to land. The zonal patterns during different seasons are also different, partic-ularly over land. For examples, over land in the tropics, the seasonal variations of total cloud, high cloud, altostratus and deep convective cloud fractions are corresponding 20
to the seasonal north-south migration pattern of ITCZ over land (such as Africa and South America), which follows the annual march of the sun. The results are consistent with previous studies based on the highly reflective cloud (HRC) dataset of Waliser and Gautier (1993). However, over ocean in the tropics and subtropics, the seasonal varia-tions of cloud fraction are small for high, strati-form and deep convective clouds. Even 25
ACPD
14, 10463–10514, 2014Distributions and overlap of various
cloud types
J. Li et al.
Title Page
Abstract Introduction
Conclusions References
Tables Figures
◭ ◮
◭ ◮
Back Close
Full Screen / Esc
Printer-friendly Version Interactive Discussion
Discussion
P
a
per
|
D
iscussion
P
a
per
|
Discussion
P
a
per
|
Discuss
ion
P
a
per
|
most of the deep convective clouds or high clouds in our study almost are located in the tropics of the Northern Hemisphere except during winter. It is mainly due to the large thermal inertia and dynamical inertia of the wind-forced surface current structure of the equatorial ocean, the ITCZ migration over extended ocean regions lags slightly behind the ITCZs over land, particularly in the eastern Pacific and the Atlantic oceans (see 5
Fig. 1a7–d7). As a result, the ITCZs over the ocean tend to favor the Northern Hemi-sphere at most longitudes result in the large-scale convection cloud band also tends to favor the Northern Hemisphere with prevailing warm SSTs (Waliser and Gautier, 1993; Behrangi et al., 2012).
4 Comparisons of different cloud type-fractions based on different datasets 10
4.1 Statistical comparison of global averages
Several cloud classification products based on passive observational datasets (typi-cally ISCCP) and surface observer have been widely used to investigate the global or regional cloud climatologies (e.g. Hahn and Warren, 1999; Rossow and Schiffer, 1999; Yu et al., 2004). The cloud types identified by the remote sensing are basically different 15
from the cloud forms identified by surface observation. Such as, the ISCCP uses a com-bination of cloud top pressure and cloud optical depth to classify clouds into cumulus stratocumulus, stratus, altocumulus, altostratus, nimbostratus, cirrus/cirrostratus, and deep convective clouds. However, surface weather reporters classify clouds based on their visual texture and approximate cloud base height by using reporters’ knowledge 20
and experiences. Sassen and Wang (2008) preliminarily compared Radar-only based cloud classification (that is, 2B-CLDCLASS dataset from CloudSat) with the cloud clas-sification records from ISCCP and surface observer reports, and showed overall con-sistency among these datasets.
Following the study of Sassen and Wang (2008), we further compare the global av-25
ACPD
14, 10463–10514, 2014Distributions and overlap of various
cloud types
J. Li et al.
Title Page
Abstract Introduction
Conclusions References
Tables Figures
◭ ◮
◭ ◮
Back Close
Full Screen / Esc
Printer-friendly Version Interactive Discussion
Discussion
P
a
per
|
D
iscussion
P
a
per
|
Discussion
P
a
per
|
Discuss
ion
P
a
per
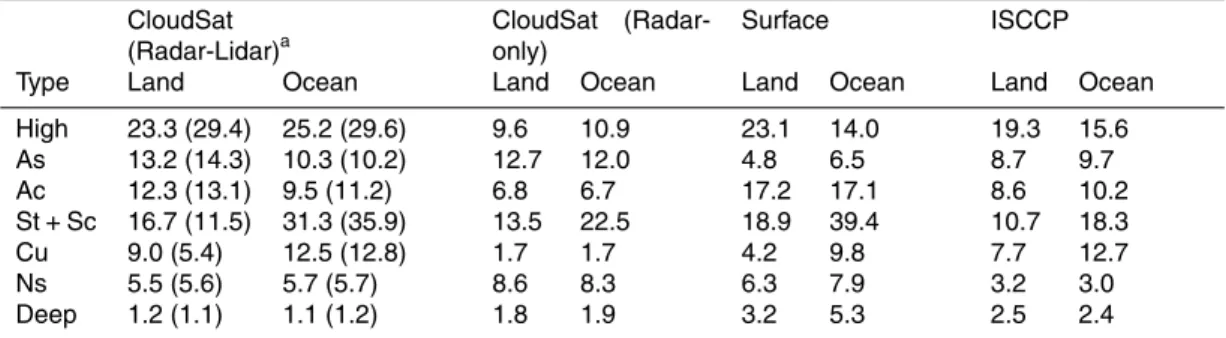
Table 1). One of them is based on extended surface observer reports (Hahn and War-ren, 1999), another one on ISCCP satellite observations from 1986–1993 (Rossow and Schiffer, 1999), a third dataset is the Radar-only cloud classification from Cloud-Sat, that is 2B-CLDCLASS product (from June 2006–June 2007), and the last one is the Radar-Lidar cloud classification from CloudSat, that is 2B-CLDCLASS–Lidar prod-5
uct (2007–2010). Here, the statistical results of the former three datasets in the Table 1 are all obtained from the study of Sassen and Wang (2008) (see Table 1 in their paper). These global mean values for each cloud type over land and ocean are cited and used to compare with our statistical findings based on the latest dataset of CloudSat. Since lidar has considerably better sensitivity to high clouds and better vertical resolution 10
than that of CPR, it is more suitable for providing high/middle or geometrically/optically thin cloud profiling and fine cloud structure (such as, cumulus, stratocumulus and al-tocumulus). From our results (Table 1), it is clear that more high clouds, altocumulus, stratocumulus or stratus and cumulus are identified by the Radar-Lidar cloud classifi-cation, in particularly for high clouds and cumulus with cloud fractions higher than in 15
previous results based on Radar-only cloud classification, increasing by factors about 2.5 and 4–7, respectively. Generally speaking, compared to the results from Radar-only cloud classification, the new results from Radar-Lidar cloud classification are in more reasonable agreement with at least one of the other datasets, typically ISCCP. By analyzing and comparing the zonal distributions of different cloud types for diff er-20
ent datasets (see the Fig. 2 of Sassen and Wang (2008) and Fig. 4 in this paper), we find that the zonal patterns are very similar between 2B-CLDCLASS–Lidar dataset and ISCCP for high clouds, altostratus and deep convective clouds, but the magnitudes are different, especially for the high cloud fractions (ISCCP miss high clouds by 35 % and 25 % over land and ocean, respectively, in the tropics). However, the zonal distri-25
ACPD
14, 10463–10514, 2014Distributions and overlap of various
cloud types
J. Li et al.
Title Page
Abstract Introduction
Conclusions References
Tables Figures
◭ ◮
◭ ◮
Back Close
Full Screen / Esc
Printer-friendly Version Interactive Discussion
Discussion
P
a
per
|
D
iscussion
P
a
per
|
Discussion
P
a
per
|
Discuss
ion
P
a
per
|
datasets, the more detailed comparison (such as, grid level) likely be required in future researches.
The overall agreement among the several cloud classifications is what we hope to see, but some difference in the results from several datasets still are inevitable because of different approaches and limitations. For surface observer reports, there are several 5
important biases have to be considered. The ground observers cannot detect cirrus and altostratus when they are present at night, which is referred to as “night detection bias”. Another bias is the underestimation of the frequency of upper clouds due to the possibility that an upper cloud is present behind a partial lower cloud cover yet reported absent because it does not intrude into the region of the sky which is visible through 10
the lower layer. This bias is referred to as “partial under-cast bias” (Warren et al., 1985). For passive satellite products (such as, ISCCP), an apparent drawback of their cloud classification is its dependence on only cloud top information in the cloud classification process. For example, when a high-level transparent cirrus cloud overlies a boundary layer stratus cloud, the retrieved cloud top heights typically lie between the cirrus and 15
the stratus cloud heights (e.g., Baum and Wielicki, 1994) leading to mis-assignment of cloud types by passive satellites. Therefore, the performance of the cloud classification algorithm will be affected by the presence of multilayer clouds. In addition, very thin cirrus can be detected from satellites due to their low temperature, even though it is not thick enough to be seen in reflected sunlight in visible channels. Some of these clouds 20
are “subvisible” and also will always be missed by surface reports (Sassen and Cho, 1992) and underestimated by the ISCCP (Liao et al., 1995). For the active sensors, the poor spatial coverage and short lifetime are possible limitations, which may eventually contribute to the cloud fraction differences for different cloud types between these four datasets. But, it is clear that the limitations of passive observations and contradictions 25
ACPD
14, 10463–10514, 2014Distributions and overlap of various
cloud types
J. Li et al.
Title Page
Abstract Introduction
Conclusions References
Tables Figures
◭ ◮
◭ ◮
Back Close
Full Screen / Esc
Printer-friendly Version Interactive Discussion
Discussion
P
a
per
|
D
iscussion
P
a
per
|
Discussion
P
a
per
|
Discuss
ion
P
a
per
this is very difficult to be obtained from passive satellites and surface weather reports on a global scale before the launch of the CloudSat and CALIPSO. Therefore, as de-scribed by the Hahn et al. (2001), a comparison of cloud types determined from surface observations to those obtained from satellite observations provides an assessment of the importance of the differences in perspective (above vs. below), spatial resolution, 5
field of view, and nature of the data (radiometric vs. visual).
4.2 The distributions of dominant cloud types
Figure 4 shows that the global distributions of the most frequent cloud type and corre-sponding cloud fractions during day- and night-time. It is evident from Fig. 4 that stra-tocumulus and stratus are the dominant cloud types worldwide, particularly over the 10
ocean. High clouds are mainly concentrated in the tropics and subtropics. In addition, over Antarctica, the most frequent cloud type is altostratus except for a small diff er-ence between day and night-time. These results are in reasonable agreement with the findings based on the ISCCP D1 dataset (Doutriaux-Boucher and Seze, 1998). But, Fig. 4 shows that altostratus also prevails over the arid/semi-arid land in the Northern 15
Hemisphere, such as, the northwestern part of China and North America. In contrast, altocumulus is the dominant cloud type over the arid/semi-arid land of the Southern Hemisphere, such as Australia and the southern part of Africa. However, all these fea-tures are not observed by Doutriaux-Boucher and Seze (1998) using the ISCCP D1 dataset. It is certain that these middle clouds are often of mixed-phase composition 20
means that any cloud layer temperature change will affect the balance of their phases (ice or water or mixed) with a potentially large radiative impact in local regions (Sassen and Khvorostyanov, 2007). In addition, over some deserts (such as the Sahara Desert), the most prevalent cloud type is a low level cloud (stratocumulus and stratus) in ISCCP D1 rather than a high cloud in our results. This discrepancy may be due to inadequate 25
ACPD
14, 10463–10514, 2014Distributions and overlap of various
cloud types
J. Li et al.
Title Page
Abstract Introduction
Conclusions References
Tables Figures
◭ ◮
◭ ◮
Back Close
Full Screen / Esc
Printer-friendly Version Interactive Discussion
Discussion
P
a
per
|
D
iscussion
P
a
per
|
Discussion
P
a
per
|
Discuss
ion
P
a
per
|
However, it is worth further noting that the cloud fractions of different cloud types in the above analyses, including single-layer and multilayered cloud fractions for certain types, are referred to as the total cloud fraction of each cloud type.
5 Simultaneous occurrence of different cloud types
Multilayered cloud systems, with two or more cloud types occurring simultaneously 5
over the same location but at different levels in the atmosphere have been frequently reported by surface and aircraft observations (Tian and Curry, 1989). The effects of in-dividual clouds on the surface and atmospheric radiation budgets depend on whether other clouds are also present above or below them. In this section, we will mainly discuss the co-occurrence frequencies of different cloud types and evaluate the perfor-10
mance of overlap assumptions by using the new dataset.
5.1 Zonal distributions and global statistics of co-occurrence frequency of dif-ferent cloud types
By detailed analysis, we further pick out the annual most frequently multi-layered cloud systems and provide their zonal distributions during day- and night-time (Fig. 5a–d) and 15
their zonal differences between land and ocean (Fig. 5e–h). Figure 5a–d clearly indi-cate that the zonal patterns of different combinations of cloud types are very different. For example, multilayered cloud systems which include high clouds either have one peak in the tropics (High+High, High+Ac and High+Cu) or three peaks in the tropics and mid-latitudes (High+St/Sc, High+Ns and High+As). The high clouds in the major 20
ACPD
14, 10463–10514, 2014Distributions and overlap of various
cloud types
J. Li et al.
Title Page
Abstract Introduction
Conclusions References
Tables Figures
◭ ◮
◭ ◮
Back Close
Full Screen / Esc
Printer-friendly Version Interactive Discussion
Discussion
P
a
per
|
D
iscussion
P
a
per
|
Discussion
P
a
per
|
Discuss
ion
P
a
per
tend to concentrate in the mid-latitudes (60◦ and pole-ward). In fact, the distributional patterns of cloud in different geographical regimes may depend on environmental fac-tors in these regimes, such as sea surface temperature, lower tropospheric stability, and vertical velocity (Norris and Leovy, 1994; Klein and Hartmann, 1993). In recent work, by studying the relations between various cloud types and sea surface tempera-5
ture over the tropical oceans, Behrangi et al. (2012) indicated that as SST increases, the fraction of multilayered clouds increases up to an SST of 303 K, and then decreases for SSTs greater than 303 K. For different combinations of cloud types, high cloud over strati-form or nimbostratus tend to occur between 292 and 294 K, but high cloud over altocumulus or altostratus or cumulus tend to exist between 302 and 304 K even though 10
almost all of them have major peak values in the tropics. However, other combinations (such as Ac-over-strati-form clouds or As-over-strati-form clouds) are more likely to oc-cur over the ocean with SST between 298 and 300 K or between 302 and 304 K. In addition, Yuan and Oreopoulos (2013) further indicated that large-scale pressure ver-tical velocity is found to anti-correlate well with the percentage of multilayered cloud 15
systems. Strong subsidence thus favors low cloud formation and suppresses ice cloud generation, explaining why multilayered clouds are very infrequent over major stratocu-mulus dominated oceanic areas around 30◦latitude. Further, cloud fraction di
fferences between land and ocean for these multi-layered cloud systems are non-negligible, and the zonal differences during daytime are also apparently different compared to the re-20
sults obtained during night, especially for high-over-Cu and high-over-St/Sc.
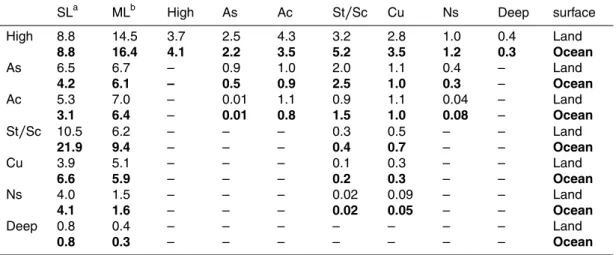
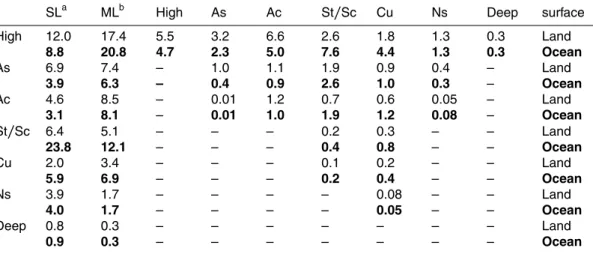
Global average overlapping percentages of different combinations of cloud types over land and ocean during daytime and nighttime are provided in Tables 2 and 3, respectively. These tables show that high cloud, As, Ac and cumulus types are much more likely to co-exist with other cloud types regardless of day or night, land or ocean. 25
fea-ACPD
14, 10463–10514, 2014Distributions and overlap of various
cloud types
J. Li et al.
Title Page
Abstract Introduction
Conclusions References
Tables Figures
◭ ◮
◭ ◮
Back Close
Full Screen / Esc
Printer-friendly Version Interactive Discussion
Discussion
P
a
per
|
D
iscussion
P
a
per
|
Discussion
P
a
per
|
Discuss
ion
P
a
per
|
tures, particularly for stratus/stratocumulus over the ocean. For convective clouds, they are also typically single. Although cumulus occurs in unstable air whereas altostratus occurs in stable air, there is still a small percentage of overlap between them. Globally, 44 % (50 %) and 35 % (39 %) of low clouds (St/Sc+Cu) over land and ocean during daytime (nighttime) are overlapped by other cloud types aloft, respectively. About 23 % 5
(26 %) and 20 % (25 %) of low clouds over land and ocean during daytime (nighttime) are connected with high clouds, respectively. These percentages are comparable with those (about 30 %) provided by Yuan and Oreopoulos (2013). Deep convective clouds are predominantly concentrated in the equatorial region, and account for about 1.1 % of total observations. Previous studies have shown that tropical cirrus clouds can be 10
stacked above deep convection (Garrett et al., 2004; Wang and Dessler, 2006), and sufficient overlapping can lead to net radiative cooling accompanied by subsidence and contribute to a mechanism for drying the air entering the stratosphere (Wang and Dessler, 2006; Hartmann et al., 2001). In our study, it is worth noting that high clouds also include cirrostratus and cirrocumulus, thus the overlap fraction of deep convec-15
tion lying below high clouds is about 29 %, and larger than the fraction (about 24 %) of cirrus-over-convection clouds based on ICESat/GLAS (Geoscience Laser Altimeter System) (Wang and Dessler, 2006).
Based on above figures and tables, we further plot the global distributions of annual mean dominant multiple cloud types during day- and night-time (see Fig. 6). Generally 20
speaking, the patterns are similar between day and night. Figure 6b and d show the multilayered cloud-type amount, defined as the ratio of the cloud fraction of one multi-layered cloud combination to the cloud fraction of total multimulti-layered cloud systems. In addition, we note that there is still some multilayered cloud systems (almost is high-over-St/Sc) over the major stratocumulus dominated oceanic areas, which are gen-25
ACPD
14, 10463–10514, 2014Distributions and overlap of various
cloud types
J. Li et al.
Title Page
Abstract Introduction
Conclusions References
Tables Figures
◭ ◮
◭ ◮
Back Close
Full Screen / Esc
Printer-friendly Version Interactive Discussion
Discussion
P
a
per
|
D
iscussion
P
a
per
|
Discussion
P
a
per
|
Discuss
ion
P
a
per
5.2 Evaluation of cloud overlap assumptions based on cloud types
The cloud overlap assumption has been widely used to describe the real cloud vertical distribution and parameterization of the total cloud fraction in a given model grid box. Several basic cloud overlap assumptions have been proposed, such as, maximum, ran-dom, random-maximum and minimum overlap (Hogan and Illingworth, 2000). However, 5
the choice of overlap assumption in GCMs could result in errors in instantaneous solar flux estimates on the order of several hundred W m−2 (Baker et al., 1999). The most common cloud overlap scheme in current GCMs is called “random-maximum” overlap. It assumes that cloud layers separated by any clear layers are randomly overlapped while vertically-continuous cloud layers overlap maximally (Stephens et al., 2004). If 10
given the cloud fractions of upper and lower layers asC1 andC2, the total cloud
frac-tions of the two cloud layers based on these overlap assumpfrac-tions thus are given by:
Crandom=C1+C2−C1·C2, Cmax=max(C1,C2), and
Cmin=min(1,C1+C2). (1)
15
In addition, if we know the real overlap fractionCoverlap, then the observed total cloud
fractionCrealcan be written as:
Creal=C1+C2−Coverlap (2)
However, Hogan and Illingworth (2000) showed that contrary to the assumption made 20
in most models, the vertically continuous cloud layers tend not to be maximally over-lapped but random overover-lapped as vertical separation of these two layers is increased. Thus, they proposed a simpler and more useful expression for the degree of cloud layer overlap (that is, exponential random overlap). In the expression, the mean ob-served cloud fraction of two cloud layers can be determined by the linear combination 25
of maximum and random overlap in terms of an “overlap parameter”aas:
ACPD
14, 10463–10514, 2014Distributions and overlap of various
cloud types
J. Li et al.
Title Page
Abstract Introduction
Conclusions References
Tables Figures
◭ ◮
◭ ◮
Back Close
Full Screen / Esc
Printer-friendly Version Interactive Discussion
Discussion
P
a
per
|
D
iscussion
P
a
per
|
Discussion
P
a
per
|
Discuss
ion
P
a
per
|
Here, the overlap parameterais considered as a function of layer separation. Ifa=0 corresponds to random overlap anda=1 to maximum overlap. AsCreal departs more
and more from Cmax (trends toward Cmin), a becomes negative. But, in the case of
vertically non-continuous cloud, they indicated that random overlap assumption works well. Based on the several months’ data from ICESat/GLAS observations, Wang and 5
Dessler (2006) already evaluated how well random overlap can describe the real over-lap of two separated cloud types (vertical separation>0.5 km). Their results showed that overlap difference between observed and based on random overlap still exist. How-ever, their work only focused on the tropical area and is limited to simple cloud clas-sification based on space-based lidar. To expand their study to the global scale and 10
more complete cloud classification, we plan to follow the study of Wang and Dessler (2006) to further estimate the overlap of two separated cloud types of each combina-tion of different cloud types in each grid box by using the observations of CloudSat and CALIPSO, moreover evaluate the performances of random and maximum overlap assumptions and calculate the overlap parameterafor each multilayered cloud type in 15
each grid box.
In order to do this, we first group each multilayered cloud system. For example, for the High+St/Sc multilayered cloud systems in same grid box, we don’t group them into many layers according to the vertical separation of two types for convenience, but only consider two layers and group all high clouds into the upper layer and all 20
strati-from clouds are grouped into the lower layer. Then, four possible values for the combined cloud fraction of the two cloud types at different layers are calculated by assuming random overlap, maximum overlap, minimum overlap and actually observed. In view of random cloud overlap is extensively thought to better characterize cloud overlap behavior than minimum overlap and maximum overlap, here we only provide 25
ACPD
14, 10463–10514, 2014Distributions and overlap of various
cloud types
J. Li et al.
Title Page
Abstract Introduction
Conclusions References
Tables Figures
◭ ◮
◭ ◮
Back Close
Full Screen / Esc
Printer-friendly Version Interactive Discussion
Discussion
P
a
per
|
D
iscussion
P
a
per
|
Discussion
P
a
per
|
Discuss
ion
P
a
per
only one value of overlap parameterafor each multilayered cloud system in each grid is obtained. Thea may be considered as the mean value of all overlap parameters at different layer separation. Based on above consideration, we use the 2B-CLDCLASS-Lidar product to calculate the four possible values for the combined cloud fraction based on different overlap assumptions, and evaluate cloud overlap schemes used by GCMs. 5
Here, the relative difference (RD) between random and real overlap for one of the multilayered cloud types is defined as:
RD=(Crandom−Creal)/Creal (4)
In addition, the cumulative relative difference (CRD) between random and real overlap for all multilayered cloud types (about 17 different combinations of different cloud types) 10
in each 2◦
×2◦grid box is given by:
CRD=
17 X
i=1
RDi·wi i =1, 2, 3,. . ., 17 (5)
Similar with the definition of CRD, we define cumulative overlap parameter (COP) in each 2◦
×2◦ grid box as:
COP=
17 X
i=1
ai·wi i=1, 2, 3,. . ., 17 (6)
15
wherew is the weight coefficient for one of multilayered cloud types in each 2◦
×2◦grid box. It can be written as follows:
wi=fi/(
17 X
i=1
fi) i =1, 2, 3,. . ., 17 (7)
ACPD
14, 10463–10514, 2014Distributions and overlap of various
cloud types
J. Li et al.
Title Page
Abstract Introduction
Conclusions References
Tables Figures
◭ ◮
◭ ◮
Back Close
Full Screen / Esc
Printer-friendly Version Interactive Discussion
Discussion
P
a
per
|
D
iscussion
P
a
per
|
Discussion
P
a
per
|
Discuss
ion
P
a
per
|
Figure 7 shows the zonal distributions of the relative difference for ten of the main multilayered cloud types and the cumulative relative difference of all multilayered cloud types during day- and night-time. The results show that differences still exist even if random cloud overlap assumption is thought to better describe cloud overlap behavior than other schemes when the cloud layers appear to be separated. The cloud frac-5
tions based on the random overlap assumption are underestimated for High+St/Sc, As+St/Sc and Ac+St/Sc at all latitudes. These differences even exceed−5 %. Among these types, a negative difference is also obvious for Ac+St/Sc, especially at the Nouthern Hemisphere. The cloud fraction of high-over-altocumulus system is overes-timated at all latitudes. The peak values of difference are mainly located at mid- and 10
high- latitudes in both Hemispheres and can reach 5 %. For other types, the relative differences are smaller than for the above four types, and alternate with latitudes. In summary, the cumulative relative difference of all multilayered cloud types is small (gray lines), and almost is negative at the all latitudes. In the Fig. 8, we further show the zonal distributions of overlap parameter for ten of the main multilayered cloud types and the 15
cumulative overlap parameter of all multilayered cloud types during day- and night-time. It is clear that the overlap parameters for High+St/Sc, As+St/Sc and Ac+St/Sc at all latitudes all are negative, indicate that their Creal depart from Cmax (trend toward Cmin) and a tendency for an even lower degree of overlap than that predicted by the
random overlap assumption. Thus, the linear combination of maximum and random 20
overlap assumptions, which has an exponential parameterization of overlap parame-tera, possible are problematic due to negative overlap parameters at those regions, where above three multilayered cloud types are dominant, especially over the major stratocumulus dominated oceanic areas where the High+St/Sc accounts for 80 % of multilayered cloud. However, the overlap parameters almost are positive for High+Ns 25
and High+Ac. This indicates that theirCreal more trend to take values anywhere
be-tween theCmaxand Crandom, thus the exponential random overlap can predict the real
ACPD
14, 10463–10514, 2014Distributions and overlap of various
cloud types
J. Li et al.
Title Page
Abstract Introduction
Conclusions References
Tables Figures
◭ ◮
◭ ◮
Back Close
Full Screen / Esc
Printer-friendly Version Interactive Discussion
Discussion
P
a
per
|
D
iscussion
P
a
per
|
Discussion
P
a
per
|
Discuss
ion
P
a
per
of all multilayered cloud types (gray lines) almost are negative at the all latitudes. But, there are two points still need to be further interpreted. First, the cumulative overlap pa-rameters at tropics and Nouthern Hemisphere have small values (even have positive values), thus random overlap or exponential random overlap still can works well. Sec-ond, at the Southern Hemisphere, the cumulative overlap parameters become larger 5
and more trend towardCmin, thus it is difficult to provide better prediction by using the
random overlap or exponential random overlap. Based on these results, we suggest that a linear combination of minimum and random overlap assumptions possible may further improve the predictions of real cloud fraction for those multilayered cloud types at the Southern Hemisphere (e.g. As+St/Sc and Ac+St/Sc), especially over the ocean 10
of 40◦S pole-ward. These results also further indicate that incorporating co-occurrence information of different cloud types on a global scale by using Radar-Lidar cloud clas-sification into the overlap assumption schemes used in the current GCMs possible be able to provide an better predictions for vertically projected total cloud fraction.
The global distributions of the cumulative relative difference and the cumulative over-15
lap parameter for all multilayered cloud types during day- and night-time are shown in Fig. 9. The upper panels of this figure are for the cumulative relative difference, whereas the lower panels are for the cumulative overlap parameter. Based on the upper panels of this figure, we find that the cloud fractions based on random overlap assumption main are underestimated over the vast ocean except the west-central Pacific Ocean 20
warm pool. Obvious overestimations are mainly located at the lands of tropics and sub-tropics, particularly at the regions with low multilayered cloud fraction, such as equa-torial central South America, southern and northern Africa, Australia and the Antarctic continent, where the high-over-altocumulus system is the dominant multilayered cloud type. This pattern indicates that land surface effects may favor an exponential ran-25
ACPD
14, 10463–10514, 2014Distributions and overlap of various
cloud types
J. Li et al.
Title Page
Abstract Introduction
Conclusions References
Tables Figures
◭ ◮
◭ ◮
Back Close
Full Screen / Esc
Printer-friendly Version Interactive Discussion
Discussion
P
a
per
|
D
iscussion
P
a
per
|
Discussion
P
a
per
|
Discuss
ion
P
a
per
|
the cumulative overlap parameter are similar with those results of cumulative relative difference. Negative overlap parameters also main occur over the vast ocean except the west-central Pacific Ocean warm pool. The typical negative high-values centers are correspondence with the major stratocumulus dominated oceanic areas very well. The positive overlap parameters almost locate the lands of tropics and subtropics and the 5
Antarctic continent.
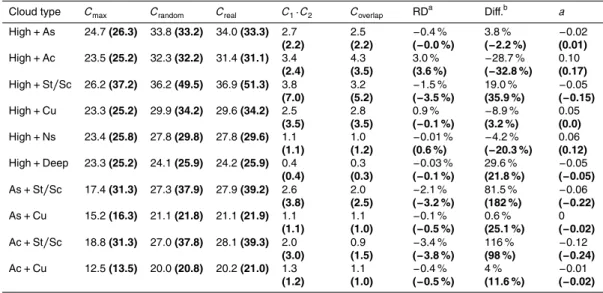
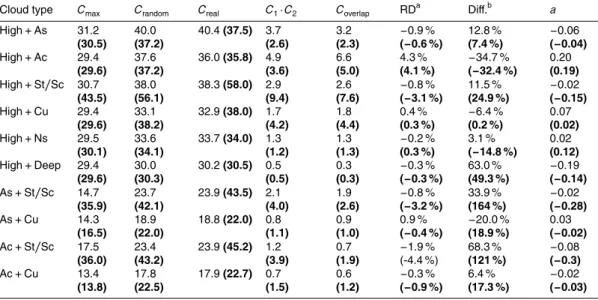
Finally, Tables 4 and 5 provide the global statistical results of several important multi-layered cloud types during day- and night-time. Globally, by using the random overlap, the overlap fractions are overestimated by 19 %, 29.6 %, 81.5 % and 116 % for high clouds with strati-form clouds and deep convective, or altostratus and altocumulus with 10
strati-form clouds over land during daytime, respectively. The overestimation also hap-pens for altostratus or altocumulus over cumulus. However, the overlap of high cloud with altocumulus and cumulus are underestimated by 28.7 % and −8.9 % over land during daytime, respectively. It is clear that the overlap differences are obvious different between land and ocean. For nighttime, the difference of overlap fractions are more 15
complicated. In summary, the difference between Coverlap and Creal are more obvious
for high cloud over altocumulus, strati-form clouds and altocumulus over strati-form clouds.
6 Summary and discussion
Since the cloud types and their co-occurrence variations are the most significant com-20
ponents of the global climate system and cloud climatology studies, GCMs are difficult to make correct climate predictions before cloud types and cloud overlap have not been completely depicted by observations and further reasonably represented in the mod-els. By using the ranging capabilities of active sensors, we analyze the geographical distributions of different cloud types and their co-occurrence frequency across different 25
ACPD
14, 10463–10514, 2014Distributions and overlap of various
cloud types
J. Li et al.
Title Page
Abstract Introduction
Conclusions References
Tables Figures
◭ ◮
◭ ◮
Back Close
Full Screen / Esc
Printer-friendly Version Interactive Discussion
Discussion
P
a
per
|
D
iscussion
P
a
per
|
Discussion
P
a
per
|
Discuss
ion
P
a
per
in reasonable agreement with previous works, additional new insights are gained in this paper.
By using 2B-CLDCLASS–Lidar dataset, more high clouds, altocumulus, stratocu-mulus or stratus and custratocu-mulus are identified by the Radar-Lidar cloud classification. In particular for high clouds and cumulus, the cloud fractions are higher than shown 5
in previous results by a factor of 2.5 and 4–7, respectively. Compared to the results from Radar-only cloud classification, the new results from Radar-Lidar cloud classi-fication are in more reasonable agreement with at least one of the other datasets, typically ISCCP. The global distributions of the most frequent cloud types show that stratocumulus and stratus are the dominant cloud types worldwide, particularly over 10
the ocean. However, high clouds are mainly concentrated in the tropics and subtrop-ics. These results are agreement with the findings based on the ISCCP D1 dataset (Doutriaux-Boucher and Seze, 1998). In addition, we also find some features, which weren’t observed by Doutriaux-Boucher and Seze (1998) using the ISCCP D1 dataset. For example, altostratus and altocumulus prevail over the arid/semi-arid land of the 15
Northern Hemisphere (northwestern part of China and North America) and the South-ern Hemisphere (Australia and the southSouth-ern part of Africa), respectively. Besides these, over some deserts (such as Sahara Desert), the most prevalent cloud type is a low level cloud (stratocumulus and stratus) in ISCCP D1 rather than a high cloud in our results.
The statistical results clearly show that the zonal patterns of different combina-20
tions of cloud types are very different due to different environmental factors, such as sea surface temperature, lower tropospheric stability and vertical velocity. The high cloud, altostratus, altocumulus and cumulus types are much more likely to co-exist with other cloud types regardless of day or night, land or ocean. However, the stra-tus/stratocumulus and nimbostratus, which typically are under large-scale subsidence 25