ACPD
9, 24193–24223, 2009Formaldehyde and its relation to CO, PAN,
and SO2
B. Rappengl ¨uck et al.
Title Page
Abstract Introduction
Conclusions References
Tables Figures
◭ ◮
◭ ◮
Back Close
Full Screen / Esc
Printer-friendly Version
Interactive Discussion
Atmos. Chem. Phys. Discuss., 9, 24193–24223, 2009 www.atmos-chem-phys-discuss.net/9/24193/2009/ © Author(s) 2009. This work is distributed under the Creative Commons Attribution 3.0 License.
Atmospheric Chemistry and Physics Discussions
This discussion paper is/has been under review for the journal Atmospheric Chemistry and Physics (ACP). Please refer to the corresponding final paper in ACP if available.
Formaldehyde and its relation to CO, PAN,
and SO
2
in the Houston-Galveston
airshed
B. Rappengl ¨uck1, P. K. Dasgupta2, M. Leuchner1,*, Q. Li2, and W. Luke3 1
Department of Earth and Atmospheric Sciences, University of Houston, Houston, Texas, USA 2
Department of Chemistry, The University of Texas at Arlington, Arlington, Texas, USA 3
NOAA-ARL, Silver Spring, Maryland, USA *
now at: Fachgebiet f ¨ur ¨Okoklimatologie, Technische Universit ¨at M ¨unchen, Freising, Germany
Received: 27 October 2009 – Accepted: 3 November 2009 – Published: 12 November 2009
Correspondence to: B. Rappengl ¨uck ([email protected])
ACPD
9, 24193–24223, 2009Formaldehyde and its relation to CO, PAN,
and SO2
B. Rappengl ¨uck et al.
Title Page
Abstract Introduction
Conclusions References
Tables Figures
◭ ◮
◭ ◮
Back Close
Full Screen / Esc
Printer-friendly Version
Interactive Discussion
Abstract
The Houston-Galveston Airshed (HGA) is one of the major metropolitan areas in the US that is classified as a nonattainment area of Federal ozone standards. Formaldehyde (HCHO) is a key species in understanding ozone related air pollution; some of the highest HCHO concentrations in North America have been reported for the HGA. We
5
report on HCHO measurements in the HGA from summer 2006. Among several sites, maximum HCHO mixing ratios were observed in the Houston Ship Channel (HSC), a region with a very high density of industrial/petrochemical operations.
HCHO levels at the Moody Tower (MT) site close to downtown were dependent on the wind direction: southerly maritime winds brought in background levels (0.5–1 ppbv)
10
while trajectories originating in the HSC resulted in high HCHO (up to 31.5 ppbv). Based on the best multiparametric linear regression model fit, the HCHO levels at the
MT site can be accounted for as follows: 38.5±12.3% from primary vehicular emissions
(using CO as an index of vehicular emission), 24.1±17.7% formed photochemically
(using peroxyacetic nitric anhydride (PAN) as an index of photochemical activity) and
15
8.9±11.2% from industrial emissions (using SO2 as an index of industrial emissions).
The balance 28.5±12.7% constituted the residual which cannot be easily ascribed to
the above categories and/or which is transported into the HGA. The CO related HCHO fraction is dominant during the morning rush hour (06:00–09:00 h , all times are given in CDT); on a carbon basis, HCHO emissions are up to 0.7% of the CO emissions. The
20
SO2related HCHO fraction is significant between 09:00–12:00 h. After 12:00 h HCHO
is largely formed through secondary processes. The HCHO/PAN ratios are dependent
on the SO2 levels. The SO2 related HCHO fraction at the downtown site originates
in the ship channel. Aside from traffic-related primary HCHO emissions, HCHO of
industrial origin serves as an appreciable source for OH in the morning.
ACPD
9, 24193–24223, 2009Formaldehyde and its relation to CO, PAN,
and SO2
B. Rappengl ¨uck et al.
Title Page
Abstract Introduction
Conclusions References
Tables Figures
◭ ◮
◭ ◮
Back Close
Full Screen / Esc
Printer-friendly Version
Interactive Discussion
1 Introduction
The Houston Galveston Airshed (HGA) continues to be a non-attainment region under
United States federal ozone standards. Rapid ozone (O3) formation processes are
as-sociated with releases of highly reactive volatile organic compounds (HRVOCs) from industrial facilities predominantly located in Houston’s Ship Channel (HSC), which
com-5
prise large agglomerations of petrochemical industries (Kleinman et al., 2002; Daum et al., 2003, 2004; Ryerson et al., 2003; Berkowitz et al., 2005); the impact of non methane hydrocarbons on downwind non-industrialized areas has been extensively studied (Leuchner and Rappengl ¨uck, 2009). Among HRVOCs compounds that serve as radical sources are of particular concern. Formaldehyde (HCHO) is considered to
10
be an important radical precursor through photolytic formation of HCO·and H·that then
variously lead to HO2·and·OH radicals.
While HCHO may be emitted primarily from incomplete combustion in either mobile or stationary sources (Zweidinger et al., 1988; Altshuller, 1993; Chen et al., 2004; Das-gupta et al., 2005), it can also be formed from ozonolysis of terminal olefins, a pathway
15
that does not consume OH. Relatively stable at night, HCHO rapidly photolyzes after sunrise and serves as an important source for early morning radicals.
Some of the highest HCHO levels in North America have been reported for the HGA,
in particular the HSC area, ranging from∼35 to 52 ppbv (Dasgupta et al., 2005; Eom
et al., 2008). Airborne HCHO measurements in HGA likewise exceeded 30 ppbv on
20
some occasions; terminal olefins were identified as the most important precursors (Wert et al., 2003). In the HSC, HCHO events, e.g. short-term increases of HCHO
mixing ratios up to 15 ppbv during nighttime, have been reported to coincide with SO2
and H2O2excursions, suggesting that HRVOCs may be co-emitted with SO2from
spe-cific sources and lead to rapid production of peroxy radicals (Dasgupta et al., 2005).
25
ACPD
9, 24193–24223, 2009Formaldehyde and its relation to CO, PAN,
and SO2
B. Rappengl ¨uck et al.
Title Page
Abstract Introduction
Conclusions References
Tables Figures
◭ ◮
◭ ◮
Back Close
Full Screen / Esc
Printer-friendly Version
Interactive Discussion
Several previous studies in various urban areas (Anderson et al., 1996; Possanzini et al., 1996; Friedfeld et al., 2002; Possanzini et al., 2002; Rappengl ¨uck et al., 2005; Garcia et al., 2006) estimated contributions of primary emissions to the observed HCHO; up to 37% was estimated for the HGA (Friedfeld et al., 2002). The primary
HCHO fraction originating from traffic emissions showed strong diurnal variation
(Rap-5
pengl ¨uck et al., 2005; Garcia et al., 2006) with morning rush hour maxima (up to 100%) and midday minima (down to 20%) as insolation intensity reached a maximum.
In August–September 2006, we made continuous measurements of HCHO and other gases on the University of Houston (UH) Moody Tower (MT). With the help of two other continuous HCHO measurement sites in the HSC area, we decipher and discuss the
10
potential HCHO sources in the HGA.
2 Methods
The MT site (lat./long. 29.717639◦/−95.341250◦, 4 km southeast of downtown Houston
(see Fig. 1) is 60 m above ground level in the 2.2 km2 UH campus: all other campus
buildings are substantially lower in height. Meteorological as well as air chemistry
15
data were collected from a 12-m high sampling tower installed on the top of MT from
18 August 2006–15 October 2006. The site is sufficiently removed from the impact
of local surface emissions and is well-suited for assessing photochemical process-ing in the HGA boundary layer. Formaldehyde was measured usprocess-ing the fluorometric Hantzsch reaction (FHR, model AL4021, http://www.aerolaser.com). Other custom
in-20
strumentation based on the same FHR chemistry (Eom et al., 2008) were deployed at US Environmental Protection Agency (USEPA) site number 48-201-0803, Houston, TX
(HRM-3, lat/long.: 29.765278◦/−95.181111◦) and at USEPA site number 48-201-1015,
Baytown, TX (LF, Lynchburg Ferry, lat/long.: 29.764444◦/−95.077778◦), both near the
HSC (Fig. 1). These sites provided HCHO data from 22 August 2006–14 October 2006.
25
ACPD
9, 24193–24223, 2009Formaldehyde and its relation to CO, PAN,
and SO2
B. Rappengl ¨uck et al.
Title Page
Abstract Introduction
Conclusions References
Tables Figures
◭ ◮
◭ ◮
Back Close
Full Screen / Esc
Printer-friendly Version
Interactive Discussion
2005; Apel et al., 2008; Wisthaler et al., 2008). The limit of detection for the three HCHO instruments ranged from 50–120 pptv (three times signal-to-noise ratio); the
estimated uncertainty was∼10%. Absolute calibration was performed with aqueous
standards monthly or with solution change; an on-board permeation source was used for daily calibration; instruments were also zeroed daily. Data for HRVOC’s were
ob-5
tained by using automated gas chromatography – flame ionization detection (Leuchner
and Rappengl ¨uck, 2009). At the MT site, CO, SO2, and oxides of nitrogen (NO, NO2,
NOx) were also determined using methods outlined in Luke et al., (2007 and 2009).
PAN was measured using a modified Metcon gas chromatograph coupled to an elec-tron capture detector, GC/ECD). At all sites, basic meteorological measurements were
10
made.
3 Results and discussion
3.1 General observations
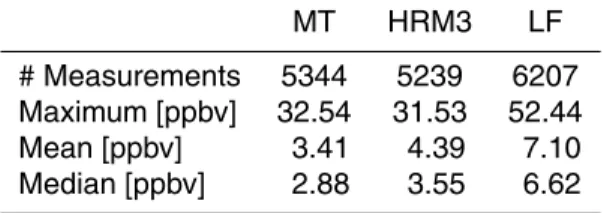
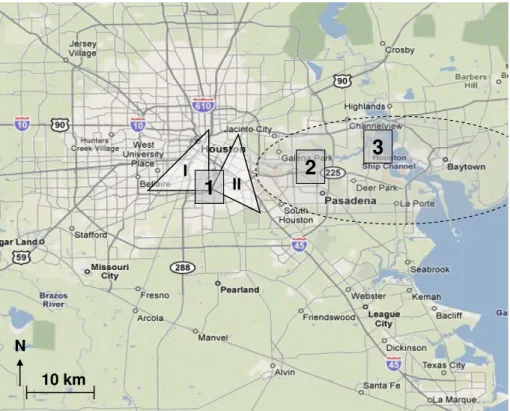
The high, mean (median) concentrations at the MT, HRM3 and LF sites, respectively were 32.5, 3.4 (2.9); 31.5, 4.4 (3.6); and 52.4, 7.1 (6.6) ppbv. A statistical summary is
15
given in Table 1. The LF site typically exhibited the highest mixing ratios. The mean median and standard deviation of diurnal variations of HCHO are shown in Fig. 2. The mixing ratios at HRM3 and LF are higher than those at MT, especially during daytime periods; also, the mean LF HCHO levels were 2–3 ppbv higher than others. In contrast to the HSC sites, median HCHO levels at MT show a peak in the median values during
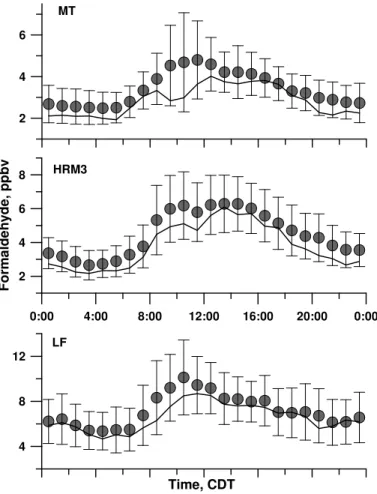
20
the morning hours (06:00–10:00 h) likely indicating rush hour impact. Figure 3 displays the MT HCHO data separated into “urban” and “HSC” wind sectors (see Fig. 1). The two peaks in the MT(urban) data, morning rush hour and the mid-afternoon, are of similar magnitude. The MT(HSC) concentrations are up to three times higher and approach the LF levels. The MT(urban) and MT(HSC) levels are similar only briefly
25
ACPD
9, 24193–24223, 2009Formaldehyde and its relation to CO, PAN,
and SO2
B. Rappengl ¨uck et al.
Title Page
Abstract Introduction
Conclusions References
Tables Figures
◭ ◮
◭ ◮
Back Close
Full Screen / Esc
Printer-friendly Version
Interactive Discussion
layer during this field campaign (Rappengl ¨uck et al., 2008) and thus with the peak atmospheric mixing period. The MT(HSC) diurnal maximum occurs between the two MT(urban) HCHO peaks. The standard deviation (Fig. 2) is an indicator of short term HCHO events; this is highest for LF. For all sites, the highest standard deviation occurs during 10:00–13:00 h; this is the same period when HCHO levels generally peak at
5
all the sites (Figs. 2 and 3). During the morning rush hour at MT, it is notable that the absolute standard deviation is low despite high HCHO levels, reflecting traffic emissions that are reproducible on a day to day basis.
In an approach to explore the presence of primary HCHO we split the HCHO data set into daytime (defined as 09:00–21:00 h) and nighttime (21:00–09:00 h) values.
“Night-10
time” as defined in this case would include some hours of early daylight in the morning, but this time period was selected based on a combination of criteria: (1) limited solar radiation, (2) limited turbulent and convective atmospheric mixing, (3) likelihood of low boundary layer heights (e.g., Rappengl ¨uck et al., 2008; Day et al., 2009), and (4) the presence of rush hour emissions. This selection would most likely include time periods
15
with the maximum fraction of primary HCHO in ambient HCHO. In fact we carried out the same study for nighttime periods excluding the timeframe 07:00–09:00 h, i.e. with-out major parts of the morning rush hour and actually found slightly higher HCHO/CO ratios. We believe that this may be due to some non negligible remnants of HCHO which was photochemically produced the day before.
20
Figure 4 displays HCHO daytime and nighttime wind roses for all sites. Daytime and nighttime median values are quite similar for each site. This holds for the spatial distribution as well as for the absolute amount of HCHO mixing ratios. The minima occur at night with southerly wind; this is the same for minima of other primarily emitted anthropogenic trace gases such as acetylene (not further discussed here). HCHO
25
levels of 0.5–1 ppbv are observed at MT under these conditions, we take this range to be representative of background air masses coming from the Gulf of Mexico.
Median nighttime values at LF are comparable to those at daytime (∼8 ppbv); for
ACPD
9, 24193–24223, 2009Formaldehyde and its relation to CO, PAN,
and SO2
B. Rappengl ¨uck et al.
Title Page
Abstract Introduction
Conclusions References
Tables Figures
◭ ◮
◭ ◮
Back Close
Full Screen / Esc
Printer-friendly Version
Interactive Discussion
daytime and nighttime maximum median values are associated with E and NE winds (5–6.5 ppbv); the HSC is ENE of MT. For HRM3 higher nighttime median values are mainly associated with three sectors: NNE-NE (3.5–4.1 ppbv), ESE-SE (3.4–3.6 ppbv),
and SW (∼4.6 ppbv). Maximum values also show some distinct dependencies on wind
direction. It should be noted that nighttime maximum values can reach about 17 ppbv
5
at the LF site and between 10–15 ppbv at the other sites. These findings suggest some relation to small scale plume events. The observed nighttime HCHO may be primary or originates from ozone-olefin reactions.
3.2 Possible contributions to ambient HCHO levels
CO originates exclusively from combustion; CO has previously been used as an index
10
of vehicular emissions (Anderson et al., 1996; Possanzini et al., 1996; Friedfeld et al., 2002; Garcia et al., 2006; Rappengl ¨uck et al., 2005). This ratio is typically 0.001–0.002
for gasoline engine passenger cars but can be 10× higher for diesel cars (Schmitz
et al., 1999); in all cases this strongly depends on driving conditions that can substan-tially influence CO and/or HCHO emission per unit carbon consumed (Herndon et al.,
15
2007) and motor vehicle fuel oxygenate composition. Consequently, HCHO/CO ratio may vary with the sampling location. In addition, it will be modified when secondary production of HCHO occurs during the daytime.
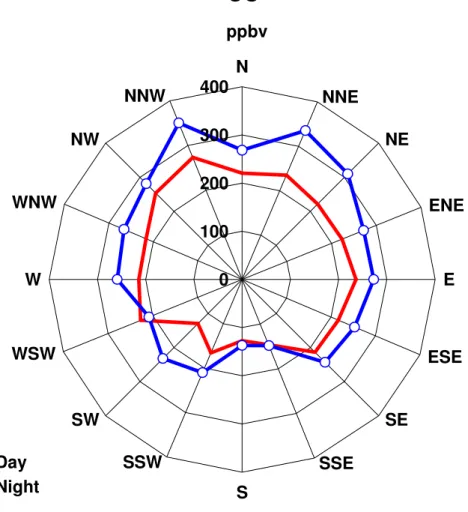
At MT, CO mixing ratios are largely independent of wind direction, except that distinct minima (about 50% less than the average median values) are always observed with
20
southerly maritime wind (see Fig. 5); traffic emissions therefore contribute the same
way for MT(urban) and MT(HSC) wind sectors.
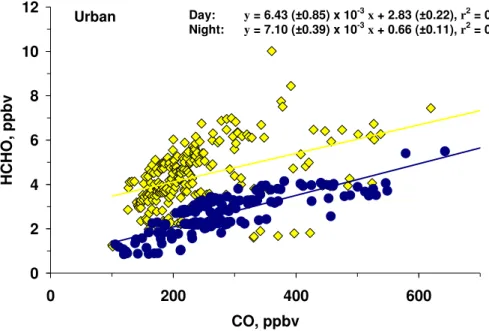
The HCHO−CO relationships for MT(urban) and MT(HSC) are shown in Fig. 6. By
far the best HCHO−CO correlation (linear r2=0.66) is for nighttime MT(urban) (this
includes much of the morning rush hour) with a slope of 7.1 pptv HCHO/ppbv CO.
25
The next best correlated data, the nighttime MT(HSC) data, exhibit a slope of 5.2 pptv
HCHO/ppbv CO, with a much poorer linearr2 of 0.23, indicating weak dependencies.
ACPD
9, 24193–24223, 2009Formaldehyde and its relation to CO, PAN,
and SO2
B. Rappengl ¨uck et al.
Title Page
Abstract Introduction
Conclusions References
Tables Figures
◭ ◮
◭ ◮
Back Close
Full Screen / Esc
Printer-friendly Version
Interactive Discussion
slope at that location albeit correlation is weaker still (r2=0.20). MT(HSC) daytime data show little correlation (r2=0.13). Weaker correlations during the daytime are most likely due to the importance of daytime photochemistry leading to varying amount of HCHO.
Based on the MT nighttime data sets we thus estimate the upper limit for traffic related
primary HCHO emissions to be 0.5–0.7% of the CO emissions.
5
Previous studies have used CO for estimating the primary HCHO fraction. For esti-mating secondary HCHO fractions either ozone (Friedfeld et al., 2002) or glyoxal (CHO-CHO) (Garcia et al., 2006) were used. In our study we apply multiple surrogates for HCHO: (i) CO as a surrogate for vehicular source, (ii) PAN as an unambiguous pho-tochemical tracer (in contrast to ozone, HCHO is not among the precursors for PAN,
10
formation of PAN is not related to HCHO chemistry) and (iii) SO2 as an indicator for
industrial sources. PAN is a likely better surrogate for photochemical processes than ozone, since (i) background concentrations of PAN are negligible and (ii) PAN is not
a priori related to HCHO. Based on the MT data set (it offered the most complete trace
gas data sets among the three sites) we obtained the following best fit equation (using
15
the least squares fitting routine in Microsoft Excel SolverTM (Dasgupta, 2008), and the
Solveraidapproach (de Levie, 2004) to calculate 95% uncertainty bounds):
[HCHO]=(5.55±0.40)×10−3[CO]+1.88±0.06[PAN]+0.172±0.008[SO2]
+0.857±0.107,r2=0.80 (1)
where all concentrations are in ppbv. The intercept represents residual HCHO that cannot be accounted for by the above sources and likely represents a mixture of both
20
secondary and primary HCHO. It may also include transport from areas outside the HGA. We checked the usefulness of additionally incorporating ethylene as a marker of flare emissions; however, this did not significantly improve the fit (r2=0.81) and was not further pursued. On the other hand, the correlation dropped markedly (r2=0.64) if
the SO2term was omitted.
ACPD
9, 24193–24223, 2009Formaldehyde and its relation to CO, PAN,
and SO2
B. Rappengl ¨uck et al.
Title Page
Abstract Introduction
Conclusions References
Tables Figures
◭ ◮
◭ ◮
Back Close
Full Screen / Esc
Printer-friendly Version
Interactive Discussion
3.3 Illustrative examples for regression model fit
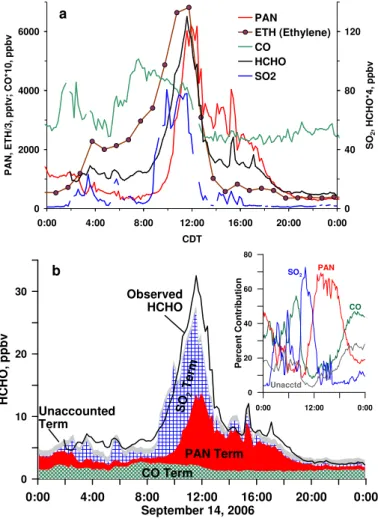
We consider here two separate periods; in both cases the data spans from near back-ground values to a significant excursion. On 14 September 2006 the overnight HCHO
background at MT is<5 ppbv at 02:00 h (Fig. 7a), beginning at ∼08:00 h, the HCHO
concentration begins rising and reaches a peak of 32.5 ppbv at 11:40 h. The rise in
5
HCHO is accompanied by excursions of SO2, ethylene, and PAN. There is a slight
decrease in CO. The prediction agrees very well with the observed values as shown in Fig. 7b which also depicts the contributions of each of the terms in Eq. (1); it also portrays the diurnal change in the relative contributions of each of the parameters.
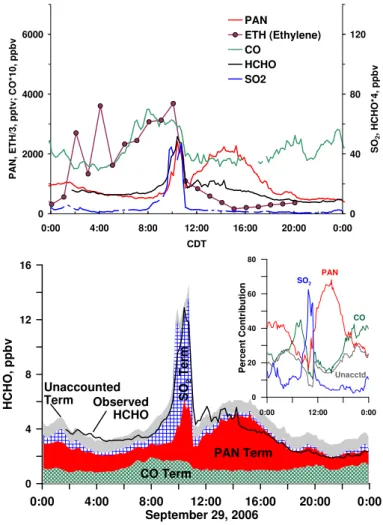
The HCHO excursion on 29 September (Fig. 8a) peaks even earlier in the
morn-10
ing, between 09:30–10:00 h. A backward trajectory analysis using the University of Houston Real-time Interactive Trajectory System (Byun et al., 2004) (Fig. 9) shows the
air mass came directly from the HSC area to MT. Both SO2 and PAN (and NO; not
shown) show peak values essentially coincident with the HCHO excursion, while CO
and C2H4, both of which were high prior to the HCHO peak, begins to decrease as
15
the HCHO peak begins to subside. The fact that CO levels abruptly decrease dur-ing this time suggests that transport from the HSC area may also be impacted by the break-up of the morning inversion that may have resulted in downward mixing of any
SO2, HCHO, and PAN present in layers aloft. Tethersonde data (Day et al., 2009)
suggest low nocturnal boundary layers (100–200 m agl) in the HGA; radiosonde data
20
at 07:00 h on that day also indicates a boundary layer height of ≤200 m agl. There
have been indications for stratified SO2 plumes aloft based on early morning ozone
sonde launchings (Rappengl ¨uck et al., 2008), others have previously observed
simul-taneously elevated SO2 and HCHO at HSC (Dasgupta et al., 2005), possibly related
to refinery flare emissions or emissions from collocated facilities. It is possible that this
25
ACPD
9, 24193–24223, 2009Formaldehyde and its relation to CO, PAN,
and SO2
B. Rappengl ¨uck et al.
Title Page
Abstract Introduction
Conclusions References
Tables Figures
◭ ◮
◭ ◮
Back Close
Full Screen / Esc
Printer-friendly Version
Interactive Discussion
and during the excursion, albeit the post excursion values in the afternoon and contin-uing into the evening and night are somewhat over-predicted by the regression model.
Both events have in common that the HCHO/PAN ratios were higher by>2×during the
HCHO events relative to subsequent afternoon hours.
3.4 HCHO/PAN ratio and SO2
5
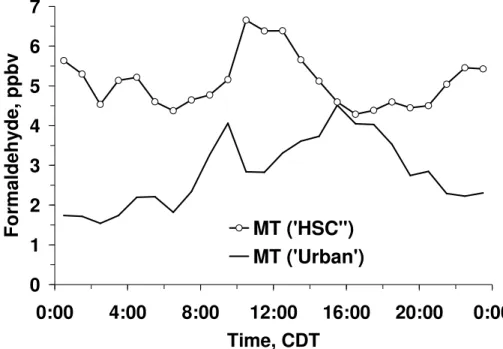
We observe that when the HCHO and PAN data for the MT(HSC) wind sector are
plotted against each other, they fall in three classes that largely depend on the SO2
concentration (Fig. 10). For<20 ppbv SO2(blue and green symbols in Fig. 10), HCHO
is always<15 ppbv, more than 90% of the time it is<10 ppbv (blue symbols in Fig. 10). For<10 ppbv SO2, the PAN levels are linearly correlated with HCHO (r
2
=0.51, slope
10
1.54 ppbv HCHO/ppbv PAN). Similar values are obtained for MT(urban). However,
MT(urban) SO2levels never exceeded 10 ppbv and this aspect will therefore will not be
further discussed. While the data group indicated by the green symbols (SO2levels
be-tween 10–20 ppbv) in Fig. 10 is somewhat less correlated, the third group represented
by red dots shows stronger linear correlation (r2=0.86, slope 4.36 ppbv HCHO/ppbv
15
PAN). This group consists of samples with SO2 concentrations 20–60 ppbv with a few
containing 60+ppbv SO2. The different slope values are consistent with the
observa-tion that HCHO events are accompanied by significantly higher HCHO/PAN ratios. The
possibilities include: (i) some primary HCHO is associated with SO2 emitting sources
and (ii) VOCs that react to form both HCHO and PAN are (a) co-emitted with SO2
20
and/or (b) emitted from sources collocated to SO2 emission sources. The correlation
between HCHO and PAN is both significant and bimodal; this suggests at least two
different types of VOCs that are being emitted. For instance, photochemical
degrada-tion of ethylene would lead to the formadegrada-tion of HCHO but not PAN, whereas propylene would be able to serve as a precursor for both HCHO and PAN.
ACPD
9, 24193–24223, 2009Formaldehyde and its relation to CO, PAN,
and SO2
B. Rappengl ¨uck et al.
Title Page
Abstract Introduction
Conclusions References
Tables Figures
◭ ◮
◭ ◮
Back Close
Full Screen / Esc
Printer-friendly Version
Interactive Discussion
3.5 Overall contributions
As shown in the insets of Figs. 7b and 8b, we can evaluate the fraction of HCHO asso-ciated with each surrogate. Considering all days, the HCHO levels at the MT site can
be accounted for as follows: 38.5±12.3% from primary vehicular emissions (using CO
as an index; this is slightly higher than the 37% previously suggested (Friedfeld et al.,
5
2002), 24.1±17.7% formed photochemically (using PAN as an index) and 8.9±11.2%
from industrial emissions (using SO2 as an index). The balance 28.5±12.7%
con-stituted the residual which cannot be easily ascribed to the above categories and/or which is transported into the HGA. All fractions show distinct diurnal variations that are closely linked to the diurnal variations of emissions, photochemical processes and wind
10
patterns (see Figs. 7b and 8b): The primary HCHO is dominant in the morning rush
hour (06:00–09:00 h); the SO2related HCHO fraction, which occurs under wind
direc-tions from the HSC, prevails between 09:00–12:00 h. In the afternoon HCHO is dom-inantly of secondary origin. Residual HCHO shows only limited diurnal variation. On an hourly basis, the range of the fractions are: CO-related HCHO (8.9–74.8%),
PAN-15
related HCHO (1.7%–70.8%.), SO2 related HCHO (0.1–67.2%), and residual HCHO
(3.5–60.8%).
The SO2 related HCHO fraction as well as residual HCHO have a strong
depen-dence on wind direction (Fig. 11) and thus their diurnal variations are controlled by local wind systems, e.g. the land sea breeze system, which favors morning transport
20
of polluted air masses from the Ship Channel, or synoptic conditions which often pro-vide persistent southerly winds and advect unpolluted marine air masses (Rappengl ¨uck
et al., 2008). The SO2 fraction displays a distinct maximum under E-ENE wind, (also
SW during daytime) and more importantly under E-NNE wind during nighttime,
sug-gesting point sources. Median SO2-related HCHO fraction for these wind directions
25
ACPD
9, 24193–24223, 2009Formaldehyde and its relation to CO, PAN,
and SO2
B. Rappengl ¨uck et al.
Title Page
Abstract Introduction
Conclusions References
Tables Figures
◭ ◮
◭ ◮
Back Close
Full Screen / Esc
Printer-friendly Version
Interactive Discussion
(between≈47–50%) when marine winds come in, suggesting background air masses.
3.6 Dependence on wind direction
Figure 12 displays contributions to ambient HCHO mixing ratios and their dependence on wind direction. In addition, median mixing ratios of selected olefins are included. Background HCHO contributions range from 500 pptv–1 ppbv and show the least
di-5
rectional dependence. Under “urban” and HSC wind directions, the secondary HCHO fraction exceeds the primary HCHO fraction during the day. At night, the primary HCHO fraction dominates. As can be seen for the daytime data, the wind roses for ethylene and propylene largely correlate with the non-CO HCHO fraction, suggesting OH driven
photochemistry during daytime. As mentioned before, the SO2fraction plays a distinct
10
role under very specific wind directions, predominantly coming from the HSC area. While mixing ratios of ethylene and propylene seem to better correlate with the
PAN-related HCHO fraction than the SO2 related fraction during the daytime, they show
a closer relationship with the SO2-related fraction during nighttime. In all cases,
propy-lene correlates better than ethypropy-lene with the SO2-related fraction, displaying a
maxi-15
mum r2=0.94 during nighttime. This close relationship either implies co-emission of
HCHO or HCHO formation through ozonolysis of alkenes during nighttime. Though the simultaneous occurrence of PAN may hint exclusively to secondary production of HCHO, the possibility that other processes may be co-occurring cannot be excluded.
At the MT site, after the breakdown of the morning inversion, there are frequently
20
excursions of HCHO, together with those of SO2 and PAN; the SO2 related HCHO
fraction observed at MT is distinctively linked to trajectories passing the highly
indus-trialized HSC area. Apart from traffic-related primary vehicular HCHO emissions,
in-dustrial releases of HCHO may be non-negligible in the HGA and may serve as an appreciable source for OH in the early morning.
ACPD
9, 24193–24223, 2009Formaldehyde and its relation to CO, PAN,
and SO2
B. Rappengl ¨uck et al.
Title Page
Abstract Introduction
Conclusions References
Tables Figures
◭ ◮
◭ ◮
Back Close
Full Screen / Esc
Printer-friendly Version
Interactive Discussion
4 Conclusions
In-situ measurements of formaldehyde performed in Houston, Texas, in summer 2006 showed a wide dynamic range. At the Moody Tower site close to the downtown area of Houston HCHO was found to correlate with PAN, indicating photochemical formation,
with CO, indicating primary traffic related sources, and with SO2, indicating industry
5
related impacts. On a carbon basis, HCHO emissions from mobile sources are up to 0.7% of the corresponding CO emissions. This HCHO fraction is dominant during
the morning rush hour (06:00–09:00 h). The SO2 related HCHO fraction occurs
be-tween 09:00–12:00 h. After 12:00 h HCHO is largely of secondary origin. HCHO/PAN
ratios depend on SO2levels. The SO2related HCHO fraction at the Moody Tower site
10
is distinctively linked to trajectories passing the industrial Ship Channel area. Apart
from traffic-related primary HCHO emissions, industrial releases of HCHO may be
non-negligible and may serve as an appreciable source for OH in the morning.
Acknowledgements. The authors would like to thank the Houston Advanced Research Center
(HARC) and Texas Commission on Environmental Quality (TCEQ) for their support. Special 15
thanks to L. Pedemonte and J. Massingale for working on VOC data reduction as well as to B. Lefer and J. Flynn for the MT wind data. Backward trajectory analysis was provided by B. Czader using the Real-time Interactive Trajectory System.
References
Altshuller, A. P.: Production of aldehydes as primary emissions and from secondary atmo-20
spheric reactions of alkenes and alkanes during the night and early morning hours, Atmos. Environ., 27A, 21–32, 1993.
Anderson, L. G., Lanning, J. A., Barrell, R., Miygishima, J., Jones, R. H., and Wolfe, P.: Sources and sinks of formaldehyde and acetaldehyde: an analysis of Denver’s ambient concentration data, Atmos. Environ., 30, 2113–2123, 1996.
25
ACPD
9, 24193–24223, 2009Formaldehyde and its relation to CO, PAN,
and SO2
B. Rappengl ¨uck et al.
Title Page
Abstract Introduction
Conclusions References
Tables Figures
◭ ◮
◭ ◮
Back Close
Full Screen / Esc
Printer-friendly Version
Interactive Discussion Steigner, D., Steinbrecher, R., Gomez Alvarez, E., M ¨uller, K., Burrows, J. P., Schade, G.,
Solomon, S. J., Ladst ¨atter-Weißenmayer, A., Simmond, P., Young, D., Hopkins, J. R., Lewis, A. C., Legreid, G., Reimann, S., Hansel, A., Wisthaler, A., Blake, R. S., Ellis, A. M., Monks, P. S., and Wyc, K. P.: Intercomparison of oxygenated volatile organic compound (OVOC) measurements at the SAPHIR atmosphere simulation chamber, J. Geophys. Res., 5
113, D20307, doi:10.1029/2008JD009865, 2008.
Berkowitz, C. M., Spicer, C. W., and Doskey, P. V.: Hydrocarbon observations and ozone pro-duction rates in Western Houston during the Texas 2000 Air Quality Study, Atmos. Environ., 39, 3383–3396, 2005.
Byun, D. W., Kim, S.-B., Moon, N.-K., Ngan, F., Li, Y., Ng, T.: Real-Time Trajectory Analy-10
sis Operation and Tool Development Project H-10-2003 Final Report, Texas Environmental Research Consortium, Houston, TX, 2004.
C ´ardenas, L. M., Brassington, D. J., Allen, B. J., Coe, H., Alicke, B., Platt, U., Wilson, K. M., Plane, J. M. C., and Penkett, S. A.: Intercomparison of formaldehyde measurements in clean and polluted atmospheres, J. Atmos. Chem., 37, 53–80, 2000.
15
Chen, J., So, S., Lee, H., Fraser, M. P., Curl, R. F., Harman, T., and Tittel, F. K.: Atmospheric formaldehyde monitoring in the greater Houston area in 2002, Appl. Spectrosc., 58, 243– 247, 2004.
Dasgupta, P. K., Li, J., Zhang, G., Luke, W. T., McClenny, W. A., Stutz, J., and Fried, A.: Sum-mertime ambient formaldehyde in five U.S. metropolitan areas: Nashville, Atlanta, Houston, 20
Philadelphia, and Tampa, Environ. Sci. Technol., 39, 4767–4783, 2005.
Dasgupta, P. K.: Chromatographic peak resolution using Microsoft Excel Solver. The merit of time shifting input arrays, J. Chromatogr. A, 1213, 50–55, 2008.
Daum, P. H., Kleinman, L. I., Springston, S. R., Nunnermacker, L. J., Lee, Y.-N., Weinstein-Lloyd, J., Zheng, J., and Berkowitz, C.: A comparative study of O3formation in the Houston 25
urban and industrial plumes during the TEXAQS 2000 study, J. Geophys. Res., 108, 4715, doi:10.1029/2003JD003552, 2003.
Daum, P. H., Kleinman, L. I., Springston, S. R., Nunnermacker, L. J., Lee, Y.-N., Weinstein-Lloyd, J., Zheng, J., and Berkowitz, C.: Origin and properties of plumes of high ozone observed during Texas 2000 Air Quality Study (TEXAQS 2000), J. Geophys. Res., 109, 30
D17306, doi:10.1029/2003JD004311, 2004.
Noctur-ACPD
9, 24193–24223, 2009Formaldehyde and its relation to CO, PAN,
and SO2
B. Rappengl ¨uck et al.
Title Page
Abstract Introduction
Conclusions References
Tables Figures
◭ ◮
◭ ◮
Back Close
Full Screen / Esc
Printer-friendly Version
Interactive Discussion TexAQS-II, Atmos. Environ., doi:10.1016/j.atmosenv.2009.01.031, in press, 2009.
de Levie, R.: Advanced Excel for Scientific Data Analysis, Oxford University Press, 2004. Eom, I.-Y., Li, Q., Li, J., and Dasgupta, P.: Robust hybrid flow analyzer for formaldehyde,
Envi-ron. Sci. Technol., 42, 1221–1226, 2008.
Friedfeld, S., Fraser, M., Ensor, K., Tribble, S., Rehle, D., Leleux, D., and Tittel, F.: Statistical 5
analysis of primary and secondary atmospheric formaldehyde, Atmos. Environ., 36, 4767– 4775, 2002.
Garcia, A. R., Volkamer, R., Molina, L. T., Molina, M. J., Samuelson, J., Mellqvist, J., Galle, B., Herndon, S. C., and Kolb, C. E.: Separation of emitted and photochemical formaldehyde in Mexico City using a statistical analysis and a new pair of gas-phase tracers, Atmos. Chem. 10
Phys., 6, 4545–4557, 2006
Gilpin, T., Apel, E., Fried, A., Wert, B., Calvert, J., Genfa, Z., Dasgupta, P. K., Harder, J. W., Heikes, B. G., Hopkins, B., Westberg, H., Kleindienst, T., Lee, Y.-N., Zhou, X., Lonneman, W., and Sewell, S.: Intercomparison of six ambient [CH2O] measurement techniques, J. Geo-phys. Res., 102, 21161–21188, 1997.
15
Hak, C., Pundt, I., Trick, S., Kern, C., Platt, U., Dommen, J., Ord ´o ˜nez, C., Pr ´ev ˆot, A. S. H., Junkermann, W., Astorga-Llorns, C., Larsen, B. R., Mellqvist, J., Strandberg, A., Yu, Y., Galle, B., Kleffmann, J., L ¨orzer, J. C., Braathen, G. O., and Volkamer, R.: Intercompari-son of four different in-situ techniques for ambient formaldehyde measurements in urban air, Atmos. Chem. Phys., 5, 2881–2900, 2005,
20
http://www.atmos-chem-phys.net/5/2881/2005/.
Herndon, S. C., Zahniser, M. S., Nelson Jr., D. D., Shorter, J., McManus, J. B., Jim ´enez. R., Warneke, C., and de Gouw, J. A.: Airborne measurements of HCHO and HCOOH during the New England Air Quality Study 2004 using a pulsed quantum cascade laser spectrometer, J. Geophys. Res., 112, D10S03, doi:10.1029/2006JD007600, 2007.
25
Kleinman, L. I., Daum, P. H., Imre, D., Lee, Y.-N., Nunnermacker, L. J., Springston, S. R., Weinstein-Lloyd, J., and Rudolph, J.: Ozone production rate and hydrocarbon re-activity in 5 urban areas. A cause of high ozone concentrations in Houston, Geo-phys. Res. Lett., 29, 1467, doi:10.1029/2001GL014569, 2002, Correction: 30, 1639, doi:10.1029/2003GL017485, 2004.
30
Mea-ACPD
9, 24193–24223, 2009Formaldehyde and its relation to CO, PAN,
and SO2
B. Rappengl ¨uck et al.
Title Page
Abstract Introduction
Conclusions References
Tables Figures
◭ ◮
◭ ◮
Back Close
Full Screen / Esc
Printer-friendly Version
Interactive Discussion surements, Calculations and Uncertainties, edited by: Friedrich, R. and Reis, S., Springer
Verlag, Berlin Heidelberg, 2003.
Leuchner, M. and Rappengl ¨uck, B.: VOC Source-Receptor Relationships in Houston during TexAQS-II, Atmos. Environ., doi:10.1016/j.atmosenv.2009.02.029, in press, 2009.
Luke, W.T, Kelley, P., Lefer, B. L., Flynn, J., Rappengl ¨uck, B., Leuchner, M., Dibb, J. E., 5
Ziemba, L. D., Anderson, C. H., and Buhr, M. P.: Measurements of primary trace gases and NOy speciation during TRAMP, Atmos. Environ., doi:10.1016/j.atmosenv.2009.08.014, in press, 2009.
Luke, W. T., Arnold, J. R., Gunter, R. L., Watson, T. B., Wellman, D. L., Dasgupta, P. K., Li, J., Riemer, D., and Tate, P.: The NOAA Twin Otter and its role in BRACE: platform description, 10
Atmos. Environ., 41, 4177–4189, 2007.
Possanzini, M., Di Palo, V., and Cecinato, A.: Sources and photodecomposition of formalde-hyde and acetaldeformalde-hyde in Rome ambient air, Atmos. Environ., 36, 3195–3201, 2002. Possanzini, M., Di Palo, V., Petricca, M., Fratarcangeli, R., and Brocco, D.: Measurements of
lower carbonyls in Rome ambient air, Atmos. Environ., 30, 3757–3764, 1996. 15
Rappengl ¨uck, B., Perna, R., Zhong, S., and Morris, G. A.: An analysis of the vertical structure of the atmosphere and the upper-level meteorology and their impact on surface ozone levels in Houston, Texas, J. Geophys. Res., 113, D17315, doi:10.1029/2007JD009745, 2008. Rappengl ¨uck, B., Schmitz, R., Bauerfeind, M., Cereceda-Balic, F., v. Baer, D., Jorquera, H.,
Silva, Y., and Oyola, P.: An urban photochemistry study in Santiago de Chile, Atmos. Envi-20
ron., 39, 2913–2931, 2005.
Ryerson, T. B., Trainer, M., Angevine, W. M., Brock, C. A., Dissly, R. W., Fehsenfeld, F. C., Frost, G. J., Goldan, P. D., Holloway, J. S., H ¨ubler, G., Jakoubek, R. O., Kuster, W. C., Neu-man, J. A., Nicks Jr., D. K., Parrish, D. D., Roberts, J. M., Sueper, D. T., Atlas, E. L., Don-nelly, S. G., Flocke, F., Fried, A., Potter, W. T., Schauffler, S., Stroud, V., Weinheimer, A. J., 25
Wert, B. P., Wiedinmyer, C., Alvarez, R. J., Banta, R. M., Darby, L. S., and Senff, C. J.: Effect of petrochemical industrial emissions of reactive alkenes and NOxon tropospheric ozone for-mation in Houston, Texas, J. Geophys. Res., 108, 4249, doi:10.1029/2002JD003070, 2003. Schmitz, T., Hassel, D., and Weber, F. J.: Zusammensetzung der Kohlenwasserstoffe im
Ab-gas unterschiedlicher AbAb-gaskonzepte. Berichte des Forschungszentrums J ¨ulich, J ¨UL-3646, 30
1999.
ACPD
9, 24193–24223, 2009Formaldehyde and its relation to CO, PAN,
and SO2
B. Rappengl ¨uck et al.
Title Page
Abstract Introduction
Conclusions References
Tables Figures
◭ ◮
◭ ◮
Back Close
Full Screen / Esc
Printer-friendly Version
Interactive Discussion Environ., 39, 3431–3443, 2005.
Wert, B. P., Trainer, M., Fried, A., Ryerson, T. B., Henry, B., Potter, W., Angevine, W. M., Atlas, E., Donnelly, S. G., Fehsenfeld, F. C., Frost, G. J., Goldan, P. D., Hansel, A., Hol-loway, J. S., Hubler, G., Kuster, W. C., Nicks Jr., D. K., Neuman, J. A., Parrish, D. D., Schauf-fler, S., Stutz, J., Sueper, D. T., Wiedinmyer, C., and Wisthaler, A.: Signatures of terminal 5
alkene oxidation in airborne formaldehyde measurements during TexAQS 2000, J. Geophys. Res., 108, 4104, doi:10.1029/2002JD002502, 2003.
Wisthaler, A., Apel, E. C., Bossmeyer, J., Hansel, A., Junkermann, W., Koppmann, R., Meier, R., M ¨uller, K., Solomon, S. J., Steinbrecher, R., Tillmann, R., and Brauers, T.: Technical Note: Intercomparison of formaldehyde measurements at the atmosphere simulation chamber 10
SAPHIR, Atmos. Chem. Phys., 8, 2189–2200, 2008, http://www.atmos-chem-phys.net/8/2189/2008/.
Zweidinger, R. B., Sigsby, J. E., Tejada, S. B., Stump, F. D., Dropkin, D. L., Ray, W. D., and Duncan, J. W.: Detailed hydrocarbon and aldehyde mobile source emissions from roadway studies, Environ. Sci. Technol., 22, 956–962, 1988.
ACPD
9, 24193–24223, 2009Formaldehyde and its relation to CO, PAN,
and SO2
B. Rappengl ¨uck et al.
Title Page
Abstract Introduction
Conclusions References
Tables Figures
◭ ◮
◭ ◮
Back Close
Full Screen / Esc
Printer-friendly Version
Interactive Discussion
Table 1. Statistical data for HCHO measurements at the MT, HRM3, and LF site based on 10-min data.
MT HRM3 LF
# Measurements 5344 5239 6207 Maximum [ppbv] 32.54 31.53 52.44
Mean [ppbv] 3.41 4.39 7.10
ACPD
9, 24193–24223, 2009Formaldehyde and its relation to CO, PAN,
and SO2
B. Rappengl ¨uck et al.
Title Page
Abstract Introduction
Conclusions References
Tables Figures
◭ ◮
◭ ◮
Back Close
Full Screen / Esc
Printer-friendly Version
Interactive Discussion
2
3
1
I
II
N
10 km
ACPD
9, 24193–24223, 2009Formaldehyde and its relation to CO, PAN,
and SO2
B. Rappengl ¨uck et al.
Title Page
Abstract Introduction
Conclusions References
Tables Figures
◭ ◮
◭ ◮
Back Close
Full Screen / Esc
Printer-friendly Version
Interactive Discussion 2
4 6
0:00 4:00 8:00 12:00 16:00 20:00 0:00 2
4 6 8
F
o
rm
a
ld
e
h
y
d
e
,
p
p
b
v
MT
Time, CDT 4
8 12
HRM3
LF
ACPD
9, 24193–24223, 2009Formaldehyde and its relation to CO, PAN,
and SO2
B. Rappengl ¨uck et al.
Title Page
Abstract Introduction
Conclusions References
Tables Figures
◭ ◮
◭ ◮
Back Close
Full Screen / Esc
Printer-friendly Version
Interactive Discussion
0
1
2
3
4
5
6
7
0:00
4:00
8:00
12:00
16:00
20:00
0:00
Time, CDT
F
o
rm
a
ld
e
h
y
d
e
,
p
p
b
v
MT ('HSC'')
MT ('Urban')
ACPD
9, 24193–24223, 2009Formaldehyde and its relation to CO, PAN,
and SO2
B. Rappengl ¨uck et al.
Title Page Abstract Introduction Conclusions References Tables Figures ◭ ◮ ◭ ◮ Back Close
Full Screen / Esc
Printer-friendly Version
Interactive Discussion Median Values Maximum Values
Day 0 2 4 6 8
10N NNE
NE ENE E ESE SE SSE S SSW SW WSW W WNW NW NNW MT HRM3 LF ppbv Night 0 2 4 6 8 10 N NNE NE ENE E ESE SE SSE S SSW SW WSW W WNW NW NNW MT HRM3 LF ppbv Day 0 10 20 30 40 N NNE NE ENE E ESE SE SSE S SSW SW WSW W WNW NW NNW MT HRM3 LF ppbv Night 0 5 10 15 20 N NNE NE ENE E ESE SE SSE S SSW SW WSW W WNW NW NNW MT HRM3 LF ppbv
ACPD
9, 24193–24223, 2009Formaldehyde and its relation to CO, PAN,
and SO2
B. Rappengl ¨uck et al.
Title Page
Abstract Introduction
Conclusions References
Tables Figures
◭ ◮
◭ ◮
Back Close
Full Screen / Esc
Printer-friendly Version
Interactive Discussion
CO
0 100 200 300 400
N
NNE
NE
ENE
E
ESE
SE
SSE
S SSW
SW WSW
W WNW
NW
NNW
Day Night
ppbv
ACPD
9, 24193–24223, 2009Formaldehyde and its relation to CO, PAN,
and SO2
B. Rappengl ¨uck et al.
Title Page
Abstract Introduction
Conclusions References
Tables Figures
◭ ◮
◭ ◮
Back Close
Full Screen / Esc
Printer-friendly Version
Interactive Discussion
0 2 4 6 8 10 12
0 200 400 600
CO, ppbv
H
C
H
O
,
p
p
b
v
Urban Day: y = 6.43 (±0.85) x 10-3x + 2.83 (±0.22), r2 = 0.20
Night: y = 7.10 (±0.39) x 10-3x + 0.66 (±0.11), r2 = 0.66
ACPD
9, 24193–24223, 2009Formaldehyde and its relation to CO, PAN,
and SO2
B. Rappengl ¨uck et al.
Title Page
Abstract Introduction
Conclusions References
Tables Figures
◭ ◮
◭ ◮
Back Close
Full Screen / Esc
Printer-friendly Version
Interactive Discussion 0
10 20 30 40
0 400 800 1200
CO, ppbv
H
C
H
O
,
p
p
b
v
HSC Day: y = 1.71 (±0.19) x 10-3 x + 2.14 (±0.49), r2 = 0.13
Night: y = 5.16 (±0.45) x 10-3 x + 2.88 (±0.17), r2 = 0.23
ACPD
9, 24193–24223, 2009Formaldehyde and its relation to CO, PAN,
and SO2
B. Rappengl ¨uck et al.
Title Page Abstract Introduction Conclusions References Tables Figures ◭ ◮ ◭ ◮ Back Close
Full Screen / Esc
Printer-friendly Version Interactive Discussion 0 2000 4000 6000
0:00 4:00 8:00 12:00 16:00 20:00 0:00 CDT P A N , E T H /3 , p p tv ; C O *1 0 , p p b v 0 40 80 120 S O2 , H C H O *4 , p p b v PAN ETH (Ethylene) CO HCHO SO2
0:00 4:00 8:00 12:00 16:00 20:00 0:00
September 14, 2006 0 10 20 30 H C H O , p p b v CO Term PAN Term SO 2 Te rm Unaccounted Term Observed HCHO
0:00 12:00 0:00
0 20 40 60 80 P e rc e n t C o n tr ib u ti o n CO PAN SO2 Unacctd a b
ACPD
9, 24193–24223, 2009Formaldehyde and its relation to CO, PAN,
and SO2
B. Rappengl ¨uck et al.
Title Page Abstract Introduction Conclusions References Tables Figures ◭ ◮ ◭ ◮ Back Close
Full Screen / Esc
Printer-friendly Version Interactive Discussion 0 2000 4000 6000
0:00 4:00 8:00 12:00 16:00 20:00 0:00 CDT P A N , E T H /3 , p p tv ; C O *1 0 , p p b v 0 40 80 120 S O2 , H C H O *4 , p p b v PAN ETH (Ethylene) CO HCHO SO2
0:00 4:00 8:00 12:00 16:00 20:00 0:00
September 29, 2006
0 4 8 12 16 H C H O , p p b v CO Term PAN Term S O2 T e rm Unaccounted Term Observed
HCHO 0:00 12:00 0:00
0 20 40 60 80 P e rc e n t C o n tr ib u ti o n CO PAN SO2 Unacctd
ACPD
9, 24193–24223, 2009Formaldehyde and its relation to CO, PAN,
and SO2
B. Rappengl ¨uck et al.
Title Page
Abstract Introduction
Conclusions References
Tables Figures
◭ ◮
◭ ◮
Back Close
Full Screen / Esc
Printer-friendly Version
Interactive Discussion
ACPD
9, 24193–24223, 2009Formaldehyde and its relation to CO, PAN,
and SO2
B. Rappengl ¨uck et al.
Title Page
Abstract Introduction
Conclusions References
Tables Figures
◭ ◮
◭ ◮
Back Close
Full Screen / Esc
Printer-friendly Version
Interactive Discussion
0
10
20
30
0
1
2
3
4
5
6
7
PAN, ppbv
H
C
H
O
,
p
p
b
v
20-60+
10-20
< 10
SO
2, ppbv
ACPD
9, 24193–24223, 2009Formaldehyde and its relation to CO, PAN,
and SO2
B. Rappengl ¨uck et al.
Title Page
Abstract Introduction
Conclusions References
Tables Figures
◭ ◮
◭ ◮
Back Close
Full Screen / Esc
Printer-friendly Version
Interactive Discussion HCHO fractions (Day)
0 20 40 60 N
NNE
NE
ENE
E
ESE
SE
SSE S SSW SW WSW
W WNW
NW NNW
PAN fraction CO fraction SO2 fraction background
%
HCHO fractions (Night)
0 20 40 60 N
NNE
NE
ENE
E
ESE
SE
SSE
S SSW SW WSW
W WNW
NW NNW
PAN fraction CO fraction SO2 fraction background
%
ACPD
9, 24193–24223, 2009Formaldehyde and its relation to CO, PAN,
and SO2
B. Rappengl ¨uck et al.
Title Page Abstract Introduction Conclusions References Tables Figures ◭ ◮ ◭ ◮ Back Close
Full Screen / Esc
Printer-friendly Version
Interactive Discussion
HCHO fractions (Day)
0.0 0.5 1.0 1.5 2.0 2.5 N NNE NE ENE E ESE SE SSE S SSW SW WSW W WNW NW NNW PAN fraction CO fraction SO2 fraction background propylene/3 ethylene/3 ppbv
HCHO fractions (Night)
0.0 0.5 1.0 1.5 2.0 2.5 N NNE NE ENE E ESE SE SSE S SSW SW WSW W WNW NW NNW PAN fraction CO fraction SO2 fraction background propylene/3 ethylene/3 ppbv