DOI: http://dx.doi.org/10.15388/infedu.2015.06
A Few Observations and Remarks on Time
Effectiveness of Interactive Electronic Testing
Martin MAGDIN, Milan TURČÁNI
Department of Informatics, Faculty of Natural Sciences Constantine the Philosopher University in Nitra Tr. A. Hlinku 1, 949 74 Nitra, Slovak Republic e-mail: mmagdin@ukf.sk, mturcani@ukf.skReceived: February 2014
Abstract. In the paper, we point out several observations and remarks on time effectiveness of electronic testing, in particular of its new form (interactive tests). A test is often used as an effec-tive didactic tool for evaluating the extent of gained cognieffec-tive capabilities. According to authors Rudman (1989) and Wang (2003) it is provable that the relationship towards e-testing depends on the degree of previous experiences with this form of examination. Conducted experiments (not only by these authors) show that students using the traditional testing form (putting answers down on a paper) are happy to have the opportunity to use a computer for testing. The reason is the fact that they are usually used to a complete explanation of the educational content, frontal examina-tion during the lesson and also in the course of the school year and more limited possibilities to use the Internet for educational purposes. Most of them do not even know about the possibilities of e-learning and electronic evaluation. On the other hand, the group of students who are being tested using the traditional form and at the same time using computers usually prefer the traditional form, while using multimedia tools is more or less normal to them.
Keywords: interactivity, interactive animations, time effective, electronic testing, interactive tests.
1. Introduction
84
activity domains. The accomplished studies indicated that the students substantially appreciate the e-learning method, due to the facilities: the facile information access, a better storage of the didactic material, the curricula harmonization between univer-sities, personalized instruction (Stanescu et al., 2008). As e-learning is emerging as nontraditional learning approach, it’s becoming more acceptable to our society. Al-though the driving force of evolving Internet and other supporting technologies render the delivery of online courses easily accessible to students, e-learning might create a paradigm in education industry (Bih, 2006). The e-Learning is currently considered as a valid and effective didactic methodology in several study courses at different levels such as scholastic and university education as well as lifelong learning. In scientific fields the adoption of e-Learning is more complex since the study courses have to include not only theoretical concepts but also practical activities on specific instru-mentation (Peretto, 2008). The most widespread and most popular educational system for managing the learning is LMS Moodle. Moodle communicates extremely well with many web-based resources allowing developers creativity and versatility whilst enabling tailoring of the system to individual needs. These environments have been developed in partnership with teachers, as an enhancement to face-to-face teaching, for both curricular and extracurricular learning (Shulamit and Yossi, 2011).
2. Testing
Several authors of professional publications (e.g. educators or psychologists) spe-cializing in the field of online education point out in their studies (Wybrow et al., 2013) “that online teaching, learning and assessment design, which positively influences stu-dents’ outcomes, is complex design work that needs to be iteratively informed by lear-ners’ experiences. It also points to the importance of recognizing the skills and resources required to prepare for and work in online environments. In addition, it has shown that publisher materials are no substitute for appropriate investment in staff skill and design processes and that such investment pays high dividends in enhanced student learning and experience and teaching quality”.
But is it really so? Are such studies valid in each country? The paper highlights a number of observations of electronic testing students.
3. Didactic Tests
Development of critical thinking is a crucial element of the change of traditional school into a modern one, and it is being actively implemented in electronic testing. Examina-tion using didactic tests is seen as the best way of gaining relevant results (verificaExamina-tion of didactic effectiveness) from the point of view of adjustment and implementation of study materials into e-learning systems. We therefore claim that they can be considered a tool for objective measuring of impact in educational process. According to Kominarec
et al. (2004), we can use didactic tests to determine the extent and quality of knowledge, the ability to apply it, the speed of problem solving etc.
The aim of didactic tests is to objectively determine the level of mastering of the educational content by a specific group of people. The main difference between a con-ventional exam and a didactic test is the fact that the didactic test is designed, verified, evaluated and interpreted according to a set of rules formulated in advance. Definition of a didactic test by Byčovský (1982) is very concise: “A didactic test is a tool of syn -tactic determining (measuring) of the results of education”. In pedagogical practice, we come across a variety of didactic tests of different quality and types. Individual types of didactic test have specific characteristics and differ in the kind of information we obtain from them.
Didactic test in electronic version presents fast and precise, modern and effective form of feedback from students to teacher. Electronic test, as a highly formalized instru-ment of evaluation of the students’ preparation and knowledge, has its own unique place in the whole education process (Horovčák and Stehlíková, 2007).
86
Examples of such tests are divergent or conceptual tasks. Divergent tasks allow for discovering of creative students; they make them think, explore, generalize and deepen their actual knowledge. They do not always have simple, trivial solution, they are open and do not directly relate to learned content, they motivate, develop creativity, unveil understanding of the problem in wider context. Their solution presumes search for a number of different and atypical correct answers. Conceptual tasks, on the other hand, focus on exploration of understanding of different notions and their relations. They are not considered a standard solution for verifying didactic effectiveness, while they are not being used very often because of the difficult nature of their execution. They represent a combination of problem tasks and tasks requiring non-specific transfer of knowledge, or creative tasks. Their solving emphasizes the numeric solution of the problem which leads to only one correct answer and is based on the use of an appropriate algorithm, usually one learned by heart. According to Haláková (2008), conceptual tasks are the only tool which lets students gain experience, improve their understanding and ability to apply the learned skills and knowledge in new situations, they boost critical thinking and spark interest in science and learning in students. They give the students an impulse to adopt a new way of learning. They are an important and useful part of diagnosing students’ misconceptions, exploring their understanding of notions, they help uncover students’ mental models and their qualitative perceptions.
4. Experiment, Part A – Time Effectiveness of Electronic Didactic Tests
There are different measures for determining the overall effectiveness of didactic tests, the most common are didactic and time effectiveness. The time effectiveness is defined by the time needed to take the didactic test. For interactive tests, which represent a new form of electronic testing of students, the determining of these aspects is a very impor-tant step in their consequent evaluation.
While conducting experiments focusing on didactic and time effectiveness, it was necessary to implement a special type of module into the LMS Moodle environment: Interactive questions by Dmitry Pupinin. The module allows connection of the data and the database. Thanks to this connection, we can statistically evaluate values of variables representing correctly or incorrectly solved parts of the interactive task and allocate partial or overall evaluation to individual students.
To determine time effectiveness of interactive tests, we conducted an experiment in the winter term of 2011/2012. During the term, we evaluated the method of work, but also the extent of gained knowledge and skills of students of Computer Architecture 1. As a part of this subject, interactive tasks representing simple didactic tests were created. Computer Architecture is a technical subject for students of Applied Informatics. The subject’s content focuses on the area of logical systems, electro-technical and electronic components which together form the core (inner structure) of computers.
A course of the same name on edu.ukf.sk server was available for the control group and it was equivalent in all aspects to the course located on divai.ukf.sk/moodle, except for the Interactive question module. Students in the control group took the same tests as students in experimental group, however, in control group, the tests were in classic pa-per form. The number of students was the same in both expa-perimental and control group. Each group consisted of 14 students. This state resulted from the number of enrolled students and their division into groups at the beginning of the semester, and therefore had to be respected.
Experiment conduction procedure:
Establishment of the control and the experimental group. (1)
Creation of quality measurement procedures. (2)
Execution of the plan of the experiment. (3)
Understanding of the data. (4)
Validation of the used statistic methods. (5)
Data analysis and interpretation of the results. (6)
Implemented methods:descriptive statistics, analysis of the dispersion for repeated measurements with more than two levels.
4.1. Interactive Tasks = Didactic Tests
The use of interactive tasks can be summarized into 3 basic points: Interactive animations can be implemented into these tasks. (1)
Interactive type of task = didactic test (conceptual task). (2)
They let us determine and verify time and didactic effectiveness. (3)
Based on the knowledge from didactics, we can say that cognitive process takes place in two main levels – at the level of sense perception and at the level of mental perception.
Experimental verification of didactic effectiveness together with research in peda-gogy and psychology point to the fact that efficiency of cognition and remembering is directly proportional to the number of sensors activated while gaining knowledge. Ac-cording to Driensky and Hrmo (2004), from this point of view, the greatest significance in implementing interactive animations can be attributed to sight (83% of information), also auditory perception (11%) and other sensors extending sense perception (touch, scent, taste) and preserving the principle of Inquiry-based learning:
“Tell me and I will forget. Show me and I will remember. Involve me and I will understand...”
The share of individual components of remembering using interactive animations, depending on the way of information acquisition, is as follows: approx. 30% is designat-ed for cognition, 20% for listening and 10% for reading (Driensky and Hrmo, 2004).
concrete-88
ness also leads to development of the intensity of the look on life. Their use is important mostly on the level of abstract thinking which helps students not only to develop their imagination but also builds fundamentals for logical thinking.
As one of the basic requirements for didactic tools, didactic efficiency depends above all on the success of education in didactic transformation of educational content in ac-cordance to the requirements set to comply with the profile of the student for whom the didactic tool is designated. (Driensky and Hrmo 2004).
Determining the state of didactic efficiency of study materials (its increase or de-crease) is a considerably difficult step of a research focusing on any kind of implemen-tation of didactic tool into educational process, while the classic question – what is the function or what tasks or effect does the didactic tool have – always gets the same answer: its task is to support the development of cognitive and intellectual skills of the student thus teaching him or her something new...
This response is mostly based on a verified statement of Mayer R.E. (1997, 2001) and Mayer, Chandler (2001) or Moreno and Valdez (2005) who claimed that the more diverse learning methods a person uses, the more effective the remembering of informa-tion is. Didactic efficiency of the use of innovated support materials to which interactive animations were implemented is therefore very difficult to quantify.
Examination using didactic tests is seen as the best way of gaining relevant results (verification of didactic effectiveness) from the point of view of adjustment and imple-mentation of study materials into e-learning systems. We therefore claim that they can be considered a tool for objective measuring of impact in educational process. We can use didactic tests to determine the extent and quality of knowledge, the ability to apply it, the speed of problem solving etc. (Kominarec, 2004).
4.2. Processing the results of the research
The aim of the experiment was to determine and verify the effectiveness of interactive types of tasks from the aspect of time needed to solve them. Based on the used measuring procedures and methods, it is possible to show, using a simple experiment, how much time have the students spent solving the didactic tests in individual groups. The students were divided into two groups – control and experimental. The control group took the di-dactic tests using the classic paper form and the experimental group used interactive types of tasks which formed the didactic test. Tests for both groups consisted of the same num-ber of questions, the assessments of tasks were identical. The experiment aimed to show time differences that can occur while taking the test either in classic or innovated form.
The data of time needed to solve interactive type of tasks for the experimental group were obtained by analysis of log files. From the available time information, we chose only the values for “net” time for taking of the test, i.e. the time excluding the intervals, when the user left the (unfinished) test open. The data of time needed to finish the tests for the control group (paper form) were obtained by analysis of the time written down at the beginning and at the end of the test.
Table 1
Descriptive characteristics of the scale of individual items (aspect of time) – Experiment, part A
Factor level N Average St. deviation St. error –95% +95% Solving time T1
Total 28 406.6429 654.9628 123.7763 152.6748 660.611
Test form paper 14 197.8571 49.7515 13.2966 169.1315 226.583 Test form electronic 14 615.4286 891.3957 238.2355 100.7520 1130.105
Solving time T2
Total 28 450.8571 230.1287 43.49024 361.6225 540.0918 Test form paper 14 352.7857 50.9286 13.61123 323.3804 382.1910 Test form electronic 14 548.9286 294.4195 78.68692 378.9358 718.9213
Solving time T3
Total 28 374.9286 242.8920 45.90227 280.7449 469.1122 Test form paper 14 298.7143 72.1456 19.28173 257.0587 340.3699 Test form electronic 14 451.1429 323.7520 86.52636 264.2140 638.0717
Solving time T4
Total 28 444.1071 656.2839 124.0260 189.6268 698.587 Test form paper 14 290.0000 66.9179 17.8846 251.3628 328.637 Test form electronic 14 598.2143 915.9252 244.7913 69.3748 1127.054
Solving time T5
Total 28 789.071 750.1553 141.7660 498.1916 1079.951
Test form paper 14 395.000 167.7590 44.8355 298.1388 491.861 Test form electronic 14 1183.143 897.8499 239.9605 664.7398 1701.546
Solving time T6
Total 28 563.6429 901.406 170.3496 214.1143 913.171
Test form paper 14 251.6429 88.452 23.6398 200.5721 302.714 Test form electronic 14 875.6429 1212.468 324.0457 175.5847 1575.701
Solving time T7
Total 28 152.3571 100.0338 18.90461 113.5681 191.1462 Test form paper 14 167.0714 120.8460 32.29746 97.2970 236.8459 Test form electronic 14 137.6429 75.5855 20.20108 94.0011 181.2846
Solving time T8
Total 28 327.4643 229.5720 43.38503 238.4456 416.4830 Test form paper 14 262.8571 59.6591 15.94457 228.4110 297.3033 Test form electronic 14 392.0714 311.3056 83.19991 212.3290 571.8139
Solving time T9
90
and interval estimation of the average, standard deviation and standard error of the esti-mation of the average).
Based on the results, we need to verify the validity of the following hypothesis with statistic value of zero:
H0: There is no statistically significant difference between the control
and experimental group from the aspect of time needed to finish the
tests either in electronic or in classic (paper) form.
We are not looking to accept the hypothesis, but its rejection could allow us to intro-duce an equivalent showing statistically important difference between the experimental and control group from the aspect of time needed to finish the tests.
To test the hypothesis, we will use analysis of the dispersion of repeated measure-ments (Table 2).
Explanations of abbreviations of Table 2: SS – sum of squares
df – degrees of freedom
MS – a mean square (or MS) is some estimate of the variance based on certain sources of variation available to us in our experiment
F value – the F-value says us how far away we are from the hypothesis
p – in statistical significance testing the p-value is the probability of obtaining a test statistic at least as extreme as the one that was actually observed, assuming that the null hypothesis is true (Goodman, 1999).
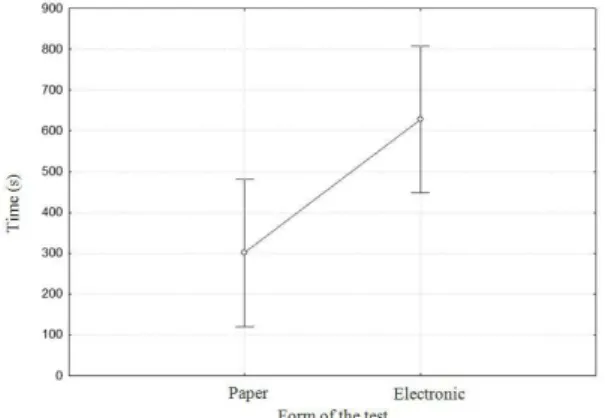
Based on the analysis of the dispersion and adjusted (Table 3) levels of variance, we reject the zero hypothesis, which claims that the difference between the experimental and control groups is statistically insignificant, i.e. there is a relation between the two groups. This relation is visualized in a chart of the average and interval of reliability (Fig. 1).
At the same time, after rejecting H0 and based on the visualisation presented in the chart of the average and the interval of reliability, we can ask the following question:
Table 2
Analysis of the dispersion of repeated measurements (aspect of time) – Experiment, part A
SS df MS F p
abS. unit 54353005 1 54353005 56.09889 0.000000 teStForM 6754197 1 6754197 6.97115 0.013822 error 25190837 26 968878
Table 3
Adjusted levels of variance (aspect of time) – Experiment, part A
H-F H-F H-F H-F
Epsilon Adjusted df Adjusted df Adjusted p value
“Which two tests differ statistically the most?” The results of the multiple comparisons are to be found in the Table 4. The Table 4 shows there are several differences between individual pairs of tests. The differences are found not only between electronic and paper form of the test, but also between the tests within the same form.
4.3. Results of the Research
The following statistical zero hypothesis was formed according to input data on the basis of which the descriptive characteristics of the scale of individual items were formed:
Fig. 1. Chart of the average and interval of reliability of the testing from the aspect of time.
Table 4
Table of multiple comparisons of tests from the aspect of time
92
H0: There is no statistically significant difference between the control
and experimental group from the aspect of time needed to solve tests either in electronic or in classic (paper) form.
This hypothesis cannot be accepted, while the conducted analysis of the dispersion and multiple comparisons of items let us reject it with 99% reliability. With the reliabil-ity chart, we could definitively visualise determined differences in time needed to finish the test in electronic and in classic paper form. In this case, the results are explicitly in favour of the paper form of testing of knowledge and skills of students.
5. Experiment B – Analysis of Students’ Results from the Aspect of Their Motivation and Development of Cognitive Skills
The second part of the experiment was also conducted in the winter semester of 2011/2012. During this semester, we not only evaluated the time aspect in taking elec-tronic and classic (paper) tests evaluating the extent of gained knowledge of students of Computer Architecture 1, but we focused mainly on analyzing the students’ results in solving the tests in both forms.
Experiment conduction procedure:
Establishment of control and experimental group. (1)
Creation of quality measurement procedures. (2)
Execution of the plan of the experiment. (3)
Understanding of the data. (4)
Data analysis and interpretation of the results. (5)
Implemented methods: analysis of the results based on a consultation with psycholo-gists and special pedagogues, conversations with students.
9 tests in total were available for students (8 interactive ones and 1 with multiple an-swers) with a different number of interactive tasks aimed to determine their knowledge and development of intellectual or psychomotor skills. In case of electronic testing in LMS Moodle, the start and the end of the test was recorded automatically (and thus also their duration) and the students were awarded according to their finished test. The test was in no way time-limited in any of the cases. The students had a limited number of tries in taking of the test, though only the first try was used as a part of our analysis. This allowed us to gain the same input conditions from the point of view of assigned score according to the time needed to solve the test in electronic or classic (paper) form. During the semester, the control group was continually taking tests with the same contents, but in a paper form.
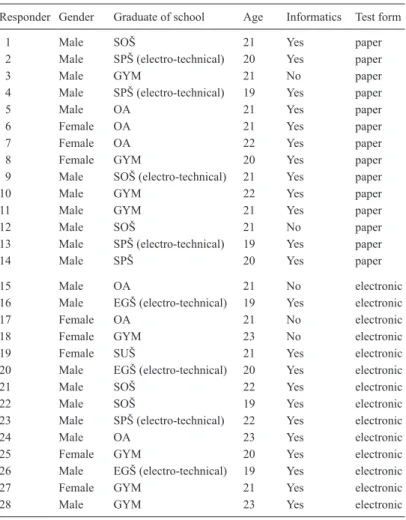
In the analysis of taken tests, we focused especially on identification of missing parts that determine the final (gained) score from the test. The Table 5 shows the general (fac-tual) data about the responders.
Definition of abbreviations (Table 5):
As we can see in the table of general data, both groups are homogenous in age, completing of the subject Informatics at high school and gender. The total number of taken tests in each form was 9, however, we will only analyze one of them – test no. 3. No extremes have arisen in conduction of tests 1–9 and the results of their analyses are identical, which gave us the reason to only analyze one of the tests in the paper.
The described test was taken in paper form on a strictly set date of 24.10.2011. The stu-dents taking the electronic tests were not limited in any way by the time needed to finish the interactive test, the only limitation for them was to continue with to the next lesson. If the students gained at least 8 of 10 points (i.e. minimum of 80%), the next lesson appeared.
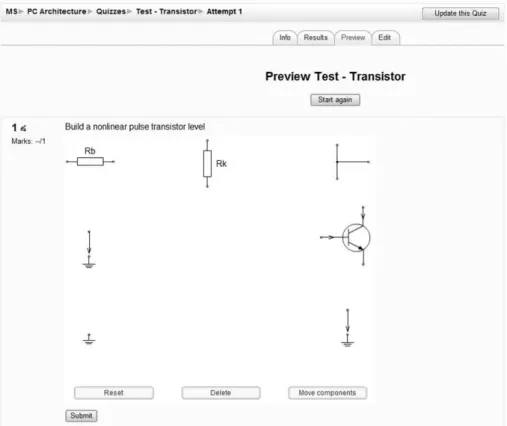
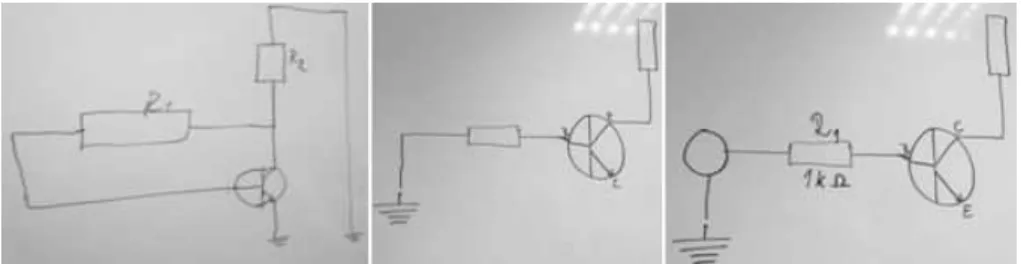
In case of autotest no. 3, the students solved the following interactive task in elec-tronic form (Fig. 2).
The students’ task was to use components defined in advance to form a nonlinear transistor level. By solving the task, we wanted to verify not only students’ knowledge in the area, but also to determine their psycho-motor skills and abilities.
Table 5 Table of the general data
Responder Gender Graduate of school Age Informatics Test form
1 Male SOŠ 21 Yes paper
2 Male SPŠ (electro-technical) 20 Yes paper
3 Male GYM 21 No paper
4 Male SPŠ (electro-technical) 19 Yes paper
5 Male OA 21 Yes paper
6 Female OA 21 Yes paper
7 Female OA 22 Yes paper
8 Female GYM 20 Yes paper
9 Male SOŠ (electro-technical) 21 Yes paper
10 Male GYM 22 Yes paper
11 Male GYM 21 Yes paper
12 Male SOŠ 21 No paper
13 Male SPŠ (electro-technical) 19 Yes paper
14 Male SPŠ 20 Yes paper
15 Male OA 21 No electronic
16 Male EGŠ (electro-technical) 19 Yes electronic
17 Female OA 21 No electronic
18 Female GYM 23 No electronic
19 Female SUŠ 21 Yes electronic
20 Male EGŠ (electro-technical) 20 Yes electronic
21 Male SOŠ 22 Yes electronic
22 Male SOŠ 19 Yes electronic
23 Male SPŠ (electro-technical) 22 Yes electronic
24 Male OA 23 Yes electronic
25 Female GYM 20 Yes electronic
26 Male EGŠ (electro-technical) 19 Yes electronic
27 Female GYM 21 Yes electronic
94
Students in the control group were taking a test identical in content, but this time in paper form. The following figure (Fig. 3) shows the assessment and components defined in advance for students to use.
To draw an image of the proportion of gained score of students in each group, the Table 6 includes descriptive characteristics and 95% intervals of reliability of the es-timated average for total score of points gained for finishing all of the tests (point and interval estimation of the average, standard deviation and standard error of estimation of the average).
Fig. 2. Interactive type of task in autotest no. 3 – electronic form.
Table 6
Descriptive characteristics of the scale of individual items (score)
Factor level N Average St. deviation St. error –95% +95% Points solv. T1
Total 28 7.594643 1.697121 0.320726 6.936568 8.252718 Test form paper 14 7.484286 2.121453 0.566982 6.259395 8.709176 Test form electronic 14 7.705000 1.206315 0.322401 7.008494 8.401506
Points solv. T2
Total 28 5.953929 2.300917 0.434832 5.061726 6.846131 Test form paper 14 5.324286 2.442696 0.652838 3.913915 6.734657 Test form electronic 14 6.583571 2.043288 0.546092 5.403812 7.763331
Points solv. T3
Total 28 6.994286 1.697563 0.320809 6.336039 7.652532 Test form paper 14 6.845714 1.349220 0.360594 6.066698 7.624731 Test form electronic 14 7.142857 2.029083 0.542295 5.971300 8.314415
Points solv. T4
Total 28 6.445357 1.910777 0.361103 5.704435 7.186279 Test form paper 14 6.473571 1.985469 0.530639 5.327196 7.619947 Test form electronic 14 6.417143 1.907666 0.509845 5.315689 7.518597
Points solv. T5
Total 28 6.497143 3.466025 0.655017 5.153159 7.841127 Test form paper 14 5.178571 4.097875 1.095203 2.812529 7.544614 Test form electronic 14 7.815714 2.100819 0.561468 6.602737 9.028691
Points solv. T6
Total 28 4.033214 2.167950 0.409704 3.192571 4.873858 Test form paper 14 3.274286 1.404546 0.375381 2.463325 4.085246 Test form electronic 14 4.792143 2.558955 0.683909 3.314646 6.269639
Points solv. T7
Total 28 5.625000 4.982609 0.941625 3.692946 7.55705 Test form paper 14 1.428571 3.631365 0.970523 –0.668116 3.52526 Test form electronic 14 9.821429 0.668153 0.178571 9.435648 10.20721
Points solv. T8
Total 28 4.744643 2.022240 0.382167 3.960500 5.52879 Test form paper 14 4.489286 1.690391 0.451776 3.513283 5.465289 Test form electronic 14 5.000000 2.344273 0.626533 3.646457 6.353543
Points solv. T9
96
Based on the results, we need to verify the validity of the following hypothesis with statistic value zero:
H0: There is no statistically significant difference between the control
and experimental group from the aspect of points awarded for finished
tests either in electronic or in classic (paper) form.
We are not looking to accept the hypothesis, but its rejection could allow us to intro-duce an equivalent showing statistically important difference between the experimental and control group from the aspect of points needed to pass the test. To test the hypoth-esis, we will use analysis of the dispersion of repeated measurements (Table 7).
The analysis of the dispersion of repeated measurements shows, that the significance level ‘p’ reaches critical values, it is, therefore, necessary to adjust the levels of variance in the results using the Huynh-Feldt correction, similarly to the case of the analysis of time needed to finish the tests.
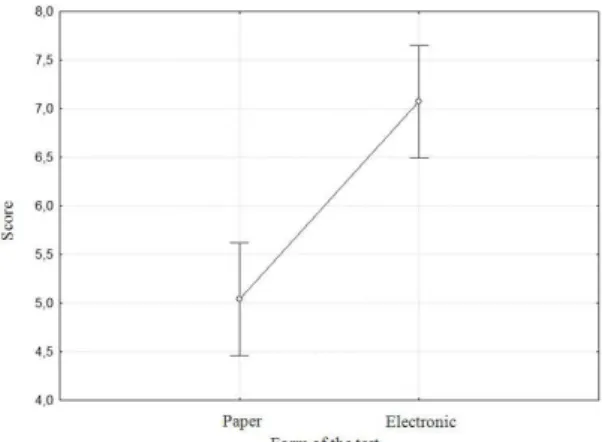
Based on the analysis of the dispersion and adjusted (Table 8) levels of variance, we reject the zero hypothesis, which claims that the difference in the point valuation of the tests between the experimental and control groups is statistically insignificant, i.e. there is a relation between the two groups. This relation is visualized in a chart of the average and interval of reliability (Fig. 4).
The results visualized in the chart of the average and the interval of reliability show the difference between the point value in tests 1–9 which was assigned to students upon their finishing of the tests in either paper or electronic form.
The results from the aspect of time needed to take the tests are in favour of the pa-per form of testing (Expa-periment – part A), but from the aspect of assigned points, the electronic form seems to be more effective, we were curious to know why such extreme differences have risen between individual test forms. We sought the answer in analysis of the finished classic and electronic tests.
Table 7
Analysis of the dispersion of repeated measurements (score)
SS df MS F p
abs. unit 9239.809 1 9239.809 915.1545 0.000000 Test form 260.511 1 260.511 25.8022 0.000027 Error 262.508 26 10.096
Table 8
Adjusted levels of variance (point valuation)
H-F H-F H-F H-F
Epsilon Adjusted df Adjusted df Adjusted p value
ITEM 0.799869 6.398956 166.3729 0.000000
The right side of the Fig. 5 shows an example of students’ solving of the problem in elec-tronic form. The correct solution of the assessment is shown on the left side of the Fig. 5. Note: In evaluation, the technical part of the solution was taken into consideration over the visual part. The system, therefore, evaluated all of the technically correct connections.
In autotest no. 3, in which the priority was to form a correct connection of nonlinear transistor level, 6 of the total 14 students solving the test in electronic form gained point evaluation 80% (i.e. 8 out of 10 points). In classic (paper) form of testing, only one of the students gained a satisfactory point evaluation (8.21 points = 82%).
The analysis of finished didactic tests shown on the Fig. 6 (paper form) shows us the absence of crucial parts of the scheme and their description which is necessary from the electro-technical point to determine the correct functioning of the scheme. While the students did not gain comparable average score in the paper form as the students who took the test electronically, we were interested to find, what score they would get if they solved the test in classic form.
Fig. 4. Chart of the average and interval of reliability of the testing from the aspect of awarded points.
98
As the figure Fig. 7 shows, the students did not get to the same score after taking the same didactic test after some time (1 month) either in paper form or on the blackboard. At the same time, the results of the repeated tests show that during their taking, many problems in critical thinking and in the creation of the formal transcription arose.
The experiment was made very interesting because of the fact, that in repeated tes-ting in electrical form, the students had no problems to gain satisfactory score.
Conversation with the students, which we used as one of the methods of analysis of obtained experiment data, showed that in classic form of verification of gained know-ledge and skills, in each of finished tests, the time effectiveness is purely on psycho-logical level. This means that students’ priority in this form of testing is to finish the test as soon as possible not taking into consideration the score they will be awarded for the test. On the other hand, taking interactive tests, they realize they have a chance to interfere with the verification of their knowledge and since there is no time limit for taking the test, they leave themselves a chance to actively enter the whole process (Note: analogy test = game is valid in this case). In their opinion, the problem of the development of their intellectual and cognitive skills or psycho-motor abilities lies in
Fig. 6. Example of incorrectly solved task – paper form (original scan in Slovak language).
the interactive tests themselves. Even though in electronic form of interactive tests they have the option to use the Inquiry-Based Learning principle, paradoxically they lose the ability to be creative and use elements of formal transcription and schemes in classic form of testing (Fig. 6 and Fig. 7).
This finding was confirmed by the statement by Dr. Lovasová1:
“At first sight, memory and motivation can be linked to the results re -garding the mentioned cognitive abilities. When it comes to memory – if there was approx. month long period between the tests, there
could have been some loss of memory. But this is not confirmed by the unified result. Second case would be the motivation given by the test -ing process. If in the PC assessment, they were to move the proposed components (pictures), they were motivated to use and implement all of them and not only to choose several as in the case of drawing them. Another question would be, whether they were able to evalu-ate their results right away on the PC or not (immedievalu-ate feedback). This would mean the test had some attributes of a PC game. Was I successful or not? Did I manage to master the task? The paper test was “just” an exam. According to the differences in average time, I would say the reason was the motivation. This generation (especially when it comes to technical study discipline) is more accustomed to work with written PC communication than with a scheme on a paper.
All in all, they had more fun which is why the final results are better,
more substantial and reliable.”
Results of the Research
The following statistical zero hypothesis was formed according to input data on the basis of which the descriptive characteristics of the scale of individual items were formed:
H0: There is no statistically significant difference between the control
and experimental group from the aspect of points awarded for finished
tests either in electronic or in classic (paper) form.
This hypothesis cannot be accepted, while the conducted analysis of the dispersion and multiple comparisons of items lets us reject it with 99% reliability. With the relia-bility chart, we could definitively visualise determined differences in point valuation of solved tests in electronic and in classic paper form. In this case, the results are explicitly in favour of the electronic form of testing of knowledge and skills of students. At the same time, we introduce the following findings:
1 Vladimíra Lovasová, assistant professor, Department of psychology ZCU (http://www.zcu.cz/
100
From the aspect of time needed for their solving, interactive tests are not more (1)
effective than classic = paper tests.
Students get higher average score (successfulness percentage) taking interactive (2)
test than while solving the same test in classic = paper form.
Comparison of interactive and classic tests shows that this new form of testing (3)
in fact lowers the development of critical thinking and formal notation of stu-dents, on the other hand, it increases their motivation and development of their cognitive abilities.
6. Conclusion
Being used side by side with classical learning, electronic learning is nowadays seen as one of the modern forms of education. This form of learning motivates the students and gives them a chance to more actively and responsibly take part in gaining knowledge in attractive educational space via e-learning courses conducted over the Internet (Kapusta
et al., 2009; Khan, 2005). Similar analogy or parallel between classic, i.e. traditional education and e-learning education can be found in using of electronic testing. Elec-tronic testing is a relatively new phenomenon of quick review of students’ knowledge and skills, which brings a new impulse and new possibilities to schools. Digital content transformed into electronic form as didactic tests, has become a new dimension in evalu-ation of gained knowledge. Students gradually learn how to effectively process infor-mation and continue to create new knowledge based on this activity. It has to be noted, though, that obtaining of information is not the main task of the educational process. It is only a tool at the beginning when we need a database of knowledge so that we can continue in the educational process. If one has a lot of information, they can be educated, but the way they use this knowledge is way more important.
References
Bih, J. (2006). Deploy a successful e-learning strategy. In: Advances in Computer, Information, and Systems Sciences, and Engineering – Proceedings of IETA 2005, TeNe 2005, EIAE 2005. 473–480.
Byčkovský, P. (1983). Základy Měření Výsledků Výuky. Tvorba Didaktického Testu. VÚIS (ČVUT), Praha. Cismas, S.C. (2010). Foreign languages as instruments of professional development in consulting archives. In:
Zadeh, L.A., Kacprzyk, J., Mastorakis, N., Kuri-Morales, A., Borne, P., Kazovsky, L. (Eds.), Proceedings
of the 9th WSEAS International Conference on Artificial Intelligence, Knowledge Engineering and Data
Bases (AIKED’10). World Scientific and Engineering Academy and Society (WSEAS), Stevens Point, Wisconsin, USA, 384–387.
Driensky, D., Hrmo, R. (2004). Materiálne Didaktické Prostriedky : Experimentálny Učebný Text Grantového
Projektu KEGA. Slovenská technická univerzita v Bratislave, Bratislava.
Goodman, S.N. (1999). Toward evidence-based medical statistics. 1: The P value fallacy. Annals of Internal Medicine, 130(12), 995–1004.
Haláková, Z. (2008). Vedomostné testy v didaktickom výskume. Acta Fac. Paed. Univ. Tyrnaviensis, 18, 113–118.
Henrich, A., Sieber, S. (2009). Blended learning and pure e-learning concepts for information retrieval: Expe-riences and future directions. Information Retrieval, 12(2), 117–147.
Horovčák, P., Stehlíková, B. (2007). Electronic testing of knowledge and factors influencing its results. Acta Montanistica Slovaca, 12, 102–113.
Munk, M., Kapusta, J., Švec, P. (2009). Data preprocessing dependency for web usage mining based on sequence rule analysis. In: Proceedings of the IADIS European Conference on Data Mining 2009, ECDM’09 Part of
the IADIS Multi Conference on Computer Science and Information Systems, MCCSIS 2009,179–181. Khan, B.H. (2005). E-learning: Design, Delivery and Evaluation (J. Zhang, C. Qi, Y. Sun, H. Li, H. Wu,
Trans.). Beijing Normal University Press, China, Beijing.
Kominarec, I., Šuťáková, V., Dargová, J. (2004). Základy Pedagogiky : Vybrané Pedagogické Problémy. PU v Prešove, Fakulta humanitných a prírodných vied, Prešov.
Mayer, R.E. (1997). Multimedia learning: Are we asking the right questions. Educational Psychologist, 32, 1–19.
Mayer, R.E. (2001). Multimedia Learning. Cambridge University Press, Cambridge.
Mayer, R.E., Chandler, P. (2001). When learning is just a click away: Does simple user interaction foster deeper understanding of multimedia messages? Journal of Educational Psychology, 93(2), 390–397.
Moreno, R., Valdez, A. (2005). Cognitive load and learning effects of having students organize pictures and words in multimedia environments: The role of student interactivity and feedback. Educational Technology Research and Development, 53(3), 35–45.
Peretto, L., Rapuano, S., Riccio, M., Bonatti, D. (2008). Distance learning of electronic measurements by means of measurement set-up models. Measurement: Journal of the International Measurement Confed-eration, 41(3), 274–283.
Rudman, H.C. (1989). Integrating testing with teaching. Practical Assessment, Research & Evaluation, 1(6). http://PAREonline.net/getvn.asp?v=1&n=6
Saadé, R. G., Morin, D., & Thomas, J. D. E. (2012). Critical thinking in E-learning environments. Computers in Human Behavior, 28(5), 1608–1617.
Shulamit, K., & Yossi, E. (2011). Development of E-learning environments combining learning skills and science and technology content for junior high school. Paper presented at the Procedia – Social and
Be-havioral Sciences, 11, 175–179.
Stanescu, L., Spahiu, C.S., Ion, A., Spahiu, A. (2008). Question generation for learning evaluation. In: Pro-ceedings of the International Multiconference on Computer Science and Information Technology, IMCSIT 2008, 3. 509–513.
Wang, Y. (2003). Assessment of learner satisfaction with asynchronous electronic learning systems. Informa-tion and Management, 41(1), 75–86.
Wybrow, R., Taylor, P., Smorfitt, D. (2013). Designing online assessment for improved student learning and experience. In: Frielick, S., Buissink-Smith, N., Wyse, P., Billot, J., Hallas, J., Whitehead, E. (Eds.),
Re-search and Development in Higher Education: The Place of Learning and Teaching (1–4 July 2013). Auckland, New Zealand, 524–534.
Zhan, Q., Yuan, M. (2009). The design of a ubiquitous learning enviroment from the holistic view. In:
102
M. Magdin works as a professor assistant at the Department of Computer Science. He deals with the theory of teaching informatics subjects, mainly implementation interac-tivity elements in e-learning courses. He participates in the projects aimed at the usage of new competencies in teaching and also in the projects dealing with learning in virtual environment using e-learning courses.
M. Turčáni is head of Department of Computer Science and works as a professor at the
Department of Informatics. He deals with the theory of teaching informatics subjects, mainly implementation e-learning in learning process. He participates in the projects aimed at the usage of new competencies in teaching and also in the projects dealing with learning in virtual environment using e-learning courses. He is supervisor of important projects, with a focus to the area of adaptive hypermedia systems.
Keletas įžvalgų ir pastabų apie laiko efektyvumą interaktyviuose
elektroniniuose testuose
Martin MAGDIN, Milan TURČÁNI
Straipsnyje pristatoma keletas įžvalgų ir pastabų apie laiko efektyvumą elektroninio testavi
-mo metu, būtent, interaktyvaus testavi-mo metu. Testas dažnai taikomas kaip efektyvus didaktinis įrankis siekiant įvertinti įgytas žinias. Remiantis Rudman (1989) ir Wang (2003) įrodyta, kad el. testavimo taikymo nuostatos yra susiję su ankstesne tokios egzaminavimo formos taikymo patir