UPLC-MRM Mass Spectrometry Method for
Measurement of the Coagulation Inhibitors
Dabigatran and Rivaroxaban in Human
Plasma and Its Comparison with Functional
Assays
Joachim Kuhn1*, Tatjana Gripp1, Tobias Flieder1, Marcus Dittrich2, Doris Hendig1, Jessica Busse1, Cornelius Knabbe1, Ingvild Birschmann1
1Institute for Laboratory and Transfusion Medicine, Heart and Diabetes Center North Rhine-Westphalia, Ruhr University Bochum, Bad Oeynhausen, Germany,2Department of Bioinformatics, Biocenter, University of Würzburg, Würzburg, Germany
*jkuhn@hdz-nrw.de
Abstract
Introduction
The fast, precise, and accurate measurement of the new generation of oral anticoagulants such as dabigatran and rivaroxaban in patients’plasma my provide important information in different clinical circumstances such as in the case of suspicion of overdose, when patients switch from existing oral anticoagulant, in patients with hepatic or renal impairment, by con-comitant use of interaction drugs, or to assess anticoagulant concentration in patients’ blood before major surgery.
Methods
Here, we describe a quick and precise method to measure the coagulation inhibitors dabi-gatran and rivaroxaban using ultra-performance liquid chromatography electrospray ioniza-tion-tandem mass spectrometry in multiple reactions monitoring (MRM) mode (UPLC-MRM MS). Internal standards (ISs) were added to the sample and after protein precipitation; the sample was separated on a reverse phase column. After ionization of the analytes the ions were detected using electrospray ionization-tandem mass spectrometry. Run time was 2.5 minutes per injection. Ion suppression was characterized by means of post-column infusion.
Results
The calibration curves of dabigatran and rivaroxaban were linear over the working range between 0.8 and 800μg/L (r>0.99). Limits of detection (LOD) in the plasma matrix were 0.21μg/L for dabigatran and 0.34μg/L for rivaroxaban, and lower limits of quantification a11111
OPEN ACCESS
Citation:Kuhn J, Gripp T, Flieder T, Dittrich M, Hendig D, Busse J, et al. (2015) UPLC-MRM Mass Spectrometry Method for Measurement of the Coagulation Inhibitors Dabigatran and Rivaroxaban in Human Plasma and Its Comparison with Functional Assays. PLoS ONE 10(12): e0145478. doi:10.1371/ journal.pone.0145478
Editor:Pablo Garcia de Frutos, IIBB-CSIC-IDIBAPS, SPAIN
Received:January 23, 2015
Accepted:December 6, 2015
Published:December 23, 2015
Copyright:© 2015 Kuhn et al. This is an open access article distributed under the terms of the Creative Commons Attribution License, which permits unrestricted use, distribution, and reproduction in any medium, provided the original author and source are credited.
Data Availability Statement:All relevant data are within the paper.
Funding:The authors have no support or funding to report.
(LLOQ) in the plasma matrix were 0.46μg/L for dabigatran and 0.54μg/L for rivaroxaban. The intraassay coefficients of variation (CVs) for dabigatran and rivaroxaban were<4% and 6%; respectively, the interassay CVs were<6% for dabigatran and<9% for rivaroxa-ban. Inaccuracy was<5% for both substances. The mean recovery was 104.5% (range 83.8–113.0%) for dabigatran and 87.0% (range 73.6–105.4%) for rivaroxaban. No signifi-cant ion suppressions were detected at the elution times of dabigatran or rivaroxaban. Both coagulation inhibitors were stable in citrate plasma at -20°C, 4°C and even at RT for at least one week. A method comparison between our UPLC-MRM MS method, the commercially available automated Direct Thrombin Inhibitor assay (DTI assay) for dabigatran measure-ment from CoaChrom Diagnostica, as well as the automated anti-Xa assay for rivaroxaban measurement from Chromogenix both performed by ACL-TOP showed a high degree of correlation. However, UPLC-MRM MS measurement of dabigatran and rivaroxaban has a much better selectivity than classical functional assays measuring activities of various coag-ulation factors which are susceptible to interference by other coagulant drugs.
Conclusions
Overall, we developed and validated a sensitive and specific UPLC-MRM MS assay for the quick and specific measurement of dabigatran and rivaroxaban in human plasma.
Introduction
A new generation of oral anticoagulants known as direct thrombin inhibitors (DTI, dabigatran, etexilate) and the direct factor Xa inhibitors (DXaI, rivaroxaban, apixaban) have been approved for clinical use in patients with thrombosis prophylaxis in high-risk orthopedic patients and for stroke prevention in cases of non-valvular atrial fibrillation. In addition, the drugs are licensed for the treatment of and as secondary prophylaxis for deep vein thrombosis and
pul-monary embolism, as well as—for rivaroxaban—a secondary prevention after acute coronary
syndrome [1]. Further direct oral anticoagulants, such as the DXaI endoxaban, will be released
soon [2]. Due to their pharmacological profiles, dabigatran, rivaroxaban and apixaban can be
taken without routine monitoring [3–6]. On the other hand, assessing these drugs may be
use-ful in emergency situations such as overdose, active bleeding, unknown medication, bridging with heparin or before surgery.
The influences on routine coagulation assays of direct oral anticoagulants (DOACs) have been described in several publications. For example, the effect on prothrombin time (PT) and activated partial thromboplastin time (aPTT) has been evaluated using various reagents, vari-ous applications and a wide range of laboratory instruments. Both PT and aPTT show a posi-tive dose response to increasing DOAC concentrations; however, responsiveness varies based
on the screening test and reagent [7–10].
Monitoring of the drugs can be done via clotting assays (diluted thrombin time, ecarin
clot-ting time), chromogenic assays or liquid chromatography-mass spectrometry [11–15].
DOACs in plasma [13–15]. Each of these methods has its own advantage or disadvantage which will be discussed including the results of our LC-MRM MS method in the subsection
“Comparison with other LC-MS assays”in the“Results and Discussion”section of this paper.
In the present study, a fast and sensitive UPLC-MRM MS method has been developed and validated for the simultaneous determination of dabigatran and rivaroxaban in human plasma. This method enables the user to measure the sample independent of co-medication, hemolysis or lipaemic/icteric plasma. Furthermore, a method comparison between the validated
UPLC-MRM MS assay and the commercially available Direct Thrombin Inhibitor assay (DTI assay) for dabigatran measurement from CoaChrom Diagnostica and the anti-Xa assay for riv-aroxaban measurement from Chromogenix were performed, respectively.
Materials and Methods
Reagents, internal standards, calibrators, and quality-control materials
Methanol and LC-MS-grade water were obtained from Fisher Scientific GmbH (Schwerte, Ger-many). Ammonium acetate, formic acid, and hydrochloric acid were purchased from
Sigma-Aldrich (Deisenhofen, Germany). Dabigatran (the active form of dabigatran etexilate), [13C6
]-dabigatran, rivaroxaban, and [13C6]-rivaroxaban were purchased from Alsachim (Strasbourg,
France).
Primary stock solution of dabigatran, [13C6]-dabigatran, rivaroxaban, and [13C6
]-rivaroxa-ban, each at a concentration of 10 mg/L, were prepared separately in methanol/water (50:50) and stored at -20°C. Using drug-free citrate plasma, we prepared several calibrators (0.8, 1.6,
3.1, 6.3, 12.5, 25.0, 50.0, 100, 200, 400 and 800μg/L of both dabigatran and rivaroxaban) for
the assay. Commercially available quality-control samples for dabigatran and rivaroxaban pur-chased from Technoclone GmbH (Vienna, Austria) were used.
An internal standard solution including 20μg/L [13C6]-dabigatran, as well as 20μg/L
[13C6]-rivaroxaban, was prepared by mixing 1 ml [13C6]-dabigatran stock solution, 1 ml
[13C6]-rivaroxaban stock solution and 498 ml methanol/water (90:10) containing 10 mmol/L
hydrochloric acid.
Plasma samples
Written informed consent was obtained from healthy volunteers who had not received any medication that could interfere with haemostasis during the week prior to blood sampling. All samples were collected within the Institute for Laboratory and Transfusion Medicine, Heart and Diabetes Center North Rhine-Westphalia, Ruhr University Bochum, Bad Oeynhausen, Germany. Furthermore, all samples were anonymized prior to inclusion in the study. Blood samples were taken using a 21-gauge butterfly needle with tubing and the corresponding tubes
from Kabe1(Primavette S1) (Nümbrecht-Elsenroth, Germany). The first 3–5 ml of blood was
discarded. In order to obtain citrated blood for the different assays, blood was collected in 8.4
ml tubes containing 840μl sodium citrate (100 mmol/L).
Ethics statement
collected prior to the start of this research. The used plasma was residual material from volun-tary healthy blood donors. The material was part of the sample collection for routine diagnos-tic; no collections specifically for the purpose of this study were performed. The voluntary blood donors received an expense allowance for the blood donation (see also §10 of the Ger-man Transfusion Act). None of the authors were directly involved in the plasma sample collec-tion. No medical or personal data from the volunteers were collected for this study. All samples were anonymized before analysis.
Sample preparation for UPLC-MRM MS analysis
Sample preparation was performed in a 1.5-ml polypropylene microcentrifuge tube. 100μL
each of citrate plasma sample, calibrator or quality-control sample were added to 900μL
inter-nal standard solution (see above). The mixture was vortex-mixed for 5 s and after
centrifuga-tion at 14,000 xgat RT for 5 min, 500μL of the clear, colorless supernatant was transferred to
the autosampler vessel.
UPLC-MRM MS analysis
For measurement of dabigatran and rivaroxaban, a 2.1 X 50-mm reverse phase column (Waters,
Acquity UPLC BEH Phenyl, 1.7μm) maintained at 50°C was used for separation by a UPLC
system directly coupled to a Waters TQ tandem mass spectrometer (TQD) as described
previ-ously in details [16,17]. A 1.0-μl sample was injected at a flow rate of 0.35 ml/min. The gradient
program was as follows: Isocratic flow of 95%/5% water/methanol containing 0.1% formic acid and 2 mmol/L ammonium acetate was performed for 0.2 min, followed by a linear gradient over 1.5 min of 5%/95% water/methanol containing also 0.1% formic acid and 2 mmol/L ammonium acetate. After the isocratic elution of 95% methanol for 0.5 min, the mobile phase was reverted to the initial state. The run was terminated at 2.5 min. The TQD was operated in electrospray positive ionization mode. The system controls of the devices and data acquisition were per-formed using MassLynx NT 4.1 software. Data processing was perper-formed by the MassLynx QuanLynx program which was provided with the instrument. Nitrogen was used as the nebuliz-ing gas and Argon was used as the collision gas. Instrument settnebuliz-ings were as follows: capillary voltage, 0.35 kV; source temperature, 105°C; desolvation temperature, 480°C. The collision gas
pressure was 3.4 X 10⁻³mbar. A sample analysis was performed in the multiple reaction
moni-toring mode (MRM) of the instrument. Sample cone voltage, collision energy, dwell time, and
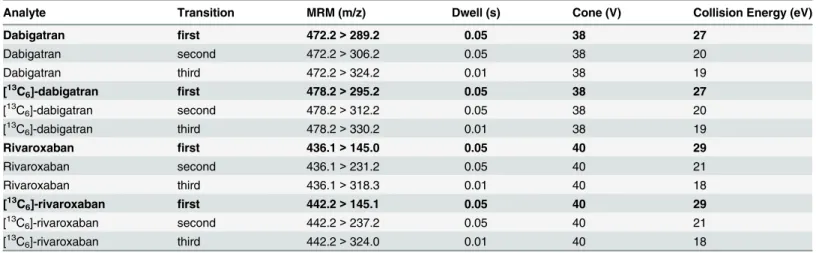
mass transitions for all compounds are listed inTable 1. The mass transition which was used for
quantification of the DOACs (first transition) is written in bold type inTable 1.
Ion enhancement and ion suppression effects
Ion enhancement and ion suppression effects were investigated by a post-column infusion
experiment as described previously in details for mycophenolic acid [18].
Validation
In accordance with our previously assay validation for nicotine and cotinine [16],
mycopheno-lic acid and mycophenomycopheno-lic acid glucuronide [18], as well as the assay validation for six
antiepi-leptic drugs [17], we used the STARD (Standard for Reporting of Diagnostic Accuracy)
checklist [19,20] and the report“Bioanalytical Method Validation–A Revisit with a Decade of
Progress”[21] as the basis for validating the UPLC–MRM MS method for dabigatran and
Linearity studies
A matrix-based calibration curve for both dabigatran and rivaroxaban was constructed using
drug-free citrate plasma. 160μL of a 10 mg/L dabigatran stock solution, as well as 160μL of a
rivaroxaban stock solution, were diluted with 1680μL drug-free citrate plasma. The solution
was mixed and used as calibrator 16. 1.0 ml of calibrator 16 was further diluted with 1 ml drug-free citrate plasma, mixed and used as calibrator 15. 1.0 ml of calibrator 15 was used to prepare calibrator 14 as described above, continuing this procedure until calibrator 1 was prepared. Plasma-based commercially available controls for both dabigatran and rivaroxaban were used.
Limits of Detection (LOD) and Lower Limit of Quantification (LLOQ)
The minimum of detectable concentration was assessed as 3 SD0added to the mean of the
blank, where SD0is the value of the standard deviation of the blank. The LOD was determined
by performing 20 replicate measurements in a single UPLC-MRM MS assay with drug-free cit-rate plasma. For sensitivity determination, the lowest standard concentration in the calibration curve was considered as the LLOQ, provided that for this value precision was at least 20%.
Precision
Intra-assay precision was determined by 20 replicate analysis of samples containing 26.8,
133.7, 264.6, 386.5, and 732.4μg/L dabigatran, as well as 20 replicate analysis of samples
con-taining 23.0, 113.7, 221.9, 423.9, and 850.1μg/L rivaroxaban on the same day (seeTable 2,
con-centrations A). Inter-assay precision was obtained by measurement of 20 replicate analysis of
samples containing 26.7, 133.3, 260.0, 379.0, and 744.4μg/L dabigatran, as well as 20 replicate
analysis of samples containing 23.1, 111.4, 212.9, 408.8, and 827.9μg/L rivaroxaban, but on 20
different days over the course of 1 month (seeTable 2, concentrations B).
Stability
The stability of dabigatran and rivaroxaban in citrate plasma was investigated by measuring these compounds in a low, medium, and highly concentrated samples stored at -20°C, 4°C, and RT after 1 day, 1 week and 1 month, respectively.
Table 1. Multiple Reaction Monitoring (MRM) transitions monitored (m/z) with cone and collision energy.
Analyte Transition MRM (m/z) Dwell (s) Cone (V) Collision Energy (eV)
Dabigatran first 472.2>289.2 0.05 38 27
Dabigatran second 472.2>306.2 0.05 38 20
Dabigatran third 472.2>324.2 0.01 38 19
[13C
6]-dabigatran first 478.2>295.2 0.05 38 27
[13C6]-dabigatran second 478.2>312.2 0.05 38 20
[13C
6]-dabigatran third 478.2>330.2 0.01 38 19
Rivaroxaban first 436.1>145.0 0.05 40 29
Rivaroxaban second 436.1>231.2 0.05 40 21
Rivaroxaban third 436.1>318.3 0.01 40 18
[13C6]-rivaroxaban first 442.2>145.1 0.05 40 29
[13C
6]-rivaroxaban second 442.2>237.2 0.05 40 21
[13C
6]-rivaroxaban third 442.2>324.0 0.01 40 18
Recovery
The recovery efficiency of the assay was established by measuring the concentration of both dabigatran and rivaroxaban in citrate plasma before and after enrichment with different amounts of dabigatran and rivaroxaban, respectively. Analytical recoveries were calculated as the measured concentrations divided by the expected concentrations and expressed as a percentage.
Method comparison
Plasma samples from at least 6 different healthy individuals were used to prepare 55 plasma samples which then were spiked with different concentrations of dabigatran and rivaroxaban, respectively. The UPLC-MRM MS method proposed here was compared with the commer-cially available automated dabigatran assay from CoaChrom Diagnostica (Maria Enzersdorf, Austria), as well as rivaroxaban anti-Xa assay from Chromogenix (Orangeburg, NY, USA), by measuring the same citrate plasma samples spiked with different amount of dabigatran and riv-aroxaban, respectively. Statistical analyses of the results were done using MedCalc Version 11.6.1.0.
Coagulation analysis
The coagulation measurements were performed automatically on an ACL TOP 700 system from Instrumentation Laboratory (Kirchheim, Germany). For the prothrombin time, we used RecombiPlasTin 2G and for partial thromboplastin time SynthASil reagent, both from Instru-mentation Laboratory (Kirchheim, Germany). All laboratory tests were performed automati-cally at the control temperature of 37°C and the clotting formation was measured by a turbidimetric method for dabigatran determination and the color development was measured at 405 nm for rivaroxaban determination, respectively. For calibration and control commer-cially available calibrators for dabigatran and rivaroxaban, as well as quality-control samples for both drugs from Technoclone GmbH (Vienna, Austria) were used.
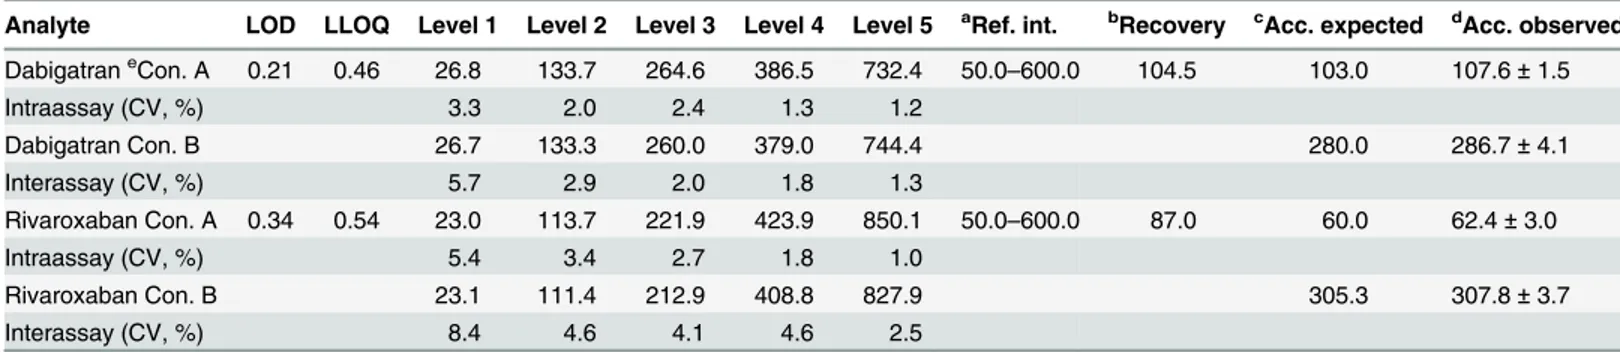
Table 2. Validation results of LOD, LLOQ, precision, recovery and accuracy.
Analyte LOD LLOQ Level 1 Level 2 Level 3 Level 4 Level 5 aRef. int. bRecovery cAcc. expected dAcc. observed
DabigatraneCon. A 0.21 0.46 26.8 133.7 264.6 386.5 732.4 50.0–600.0 104.5 103.0 107.6±1.5
Intraassay (CV, %) 3.3 2.0 2.4 1.3 1.2
Dabigatran Con. B 26.7 133.3 260.0 379.0 744.4 280.0 286.7±4.1
Interassay (CV, %) 5.7 2.9 2.0 1.8 1.3
Rivaroxaban Con. A 0.34 0.54 23.0 113.7 221.9 423.9 850.1 50.0–600.0 87.0 60.0 62.4±3.0
Intraassay (CV, %) 5.4 3.4 2.7 1.8 1.0
Rivaroxaban Con. B 23.1 111.4 212.9 408.8 827.9 305.3 307.8±3.7
Interassay (CV, %) 8.4 4.6 4.1 4.6 2.5
aRef. Int., Reference interval ( μg/L);
bRecovery (%) was performed in the Ref. int.; Recovery range for dabigatran and rivaroxaban were 83.8%–113.0% and 73.6%–105.4%, respectively. c
Acc. expected = Accuracy expected;
dAcc. observed = Accuracy observed (mean±SD); Measurements were performed using quality control samples. eCon. = Concentration (
μg/L)
Results and Discussion
General approaches of the UPLC-MRM MS method
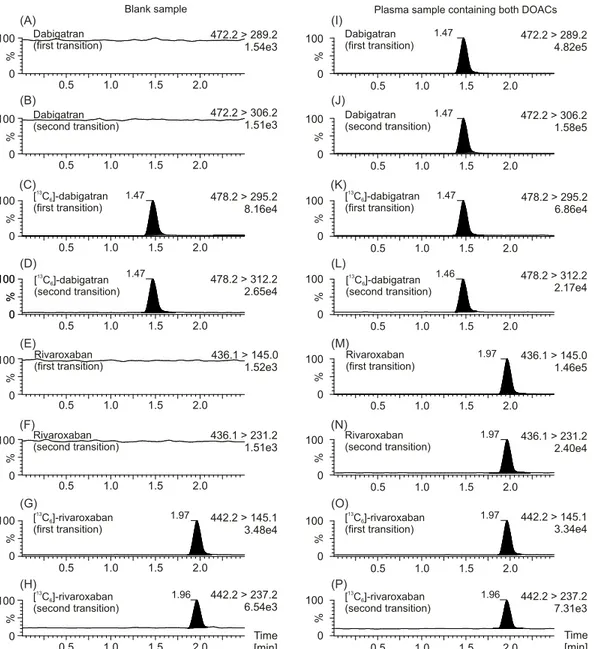
Sample preparation by means of a simple protein precipitation procedure using IS precipita-tion soluprecipita-tion produced, after a short centrifugaprecipita-tion step, a clear supernatant that gave an
inter-ference-free chromatogram for all compounds (Figs1and2). Just as described in the previous
LC-MS/MS methods for dabigatran and rivaroxaban measurements we used [13C6]-dabigatran
and [13C6]-rivaroxaban as the most appropriate IS due to their similar structure and their lack
of clinical use [13–15]. Systematic optimization of LC-MRM MS measurements shows that
positive mode yielded a better mass spectrometer response than the negative mode. The most sensitive mass transitions of the two DOACs, as well as its ISs were used for determination of
the drugs (Table 1). Chromatographic conditions were optimized though several trials in order
to achieve suitable sensitivity, as well as short run time. All compounds were clearly separated
from the void volume (retention time<0.3 min) and elute in<2.0 min, permitting an
injec-tion-to-injection cycle time of 2.5 min which allows a faster measurement of dabigatran and
rivaroxaban than with the previous LC-MS/MS methods [13–15]. The most sensitive
measure-ment for dabigatran and rivaroxaban, as well as its corresponding [13C6]-isotopes, were
achieved by monitoring the fragmentation of single-charged molecule ions (dabigatran + H+),
([13C6]-dabigatran + H+), (rivaroxaban + H+), and ([13C6]-rivaroxaban + H+) with m/z
transi-tions of m/z 472.2!289.2, m/z 478.2!295.2, m/z 436.1!145.0, and m/z 442.2!145.1,
respectively, whereas the conformation ratio was determined from the ratio m/z 472.2!306.2
(dabigatran + H+), m/z 478.2!312.2 ([13C6]-dabigatran + H+), 436.1!231.2 (rivaroxaban
+ H+), and 442.2!237.2 ([13C6]-rivaroxaban + H+). In addition, a third transition for more
comprehensive identification was added (seeTable 1). As a compromise between sensitivity
and good characterization of peak shapes about 8 mess points per peak were recorded. Con-trary to the previous LC-MS/MS method for measurement of DOACs our UPLC-MRM MS method use a first transition for quantification of the drugs, as well as for its ISs and in addi-tion, a second transition for qualification to detect interferences which may be present in com-plex biological matrix such as human plasma and which could interfered with measurement
accuracy and, furthermore, a third transition for more comprehensive identification [13–15].
Overall, the use of two transitions per substance leads to increase in specificity of the method. The dabigatran fragment ion of m/z 289.2 was formed from the single-charged dabigatran ion (m/z 472.2) via m/z 324.2 by means of an intramolecular six-ring cyclic rearrangement reaction
with loss of ketene (CH2CO) and 2-(methylenimino)pyridine (C6H6N2) and subsequently via
m/z 307.2 and 306.2 through loss of water and ammonia, respectively [22]. Concerning the two
major fragments of m/z 231.2 and 145.1 from the single-charged rivaroxaban ion (m/z 436.1), it was suggested that these fragments were obtained by cleavage of the oxazolidinone and the
chlorothiophene amide moiety, respectively [23]. We generated product ion spectra of both
dabigatran and rivaroxaban which are shown inFig 3.
Ion suppression and ion enhancement effects
Ion suppression and ion enhancement effects attributable to the sample matrix were
investi-gated as described elsewhere for mycophenolic acid [18]. A typical ion chromatogram in which
the response of the MRM transition of dabigatran, as well as rivaroxaban, was continuously
monitored as shown inFig 4. Most ion suppressions or enhancements were observed at 0.3 to
1.0 min before and at 2.2 to 2.5 min after the [13C6]-dabigatran signal (retention time, 1.47
min) and [13C6]-rivaroxaban signal (retention time, 1.97 min). Therefore, no significant ion
measurement. Furthermore, quantitative errors resulting from potential ion suppression are
compensated via the internal standards ([13C6]-isotope), which are structurally identical to the
corresponding analyte and eluted at the same retention time.
Validation
Carryover from the 280/156μg/L dabigatran/rivaroxaban control to the drug-free citrate
sam-ple was less than 0.1% for both drugs. The calibration curve of both dabigatran and rivaroxaban
were linear over the working range between 0.8 and 800μg/L (r>0.99). This field covers
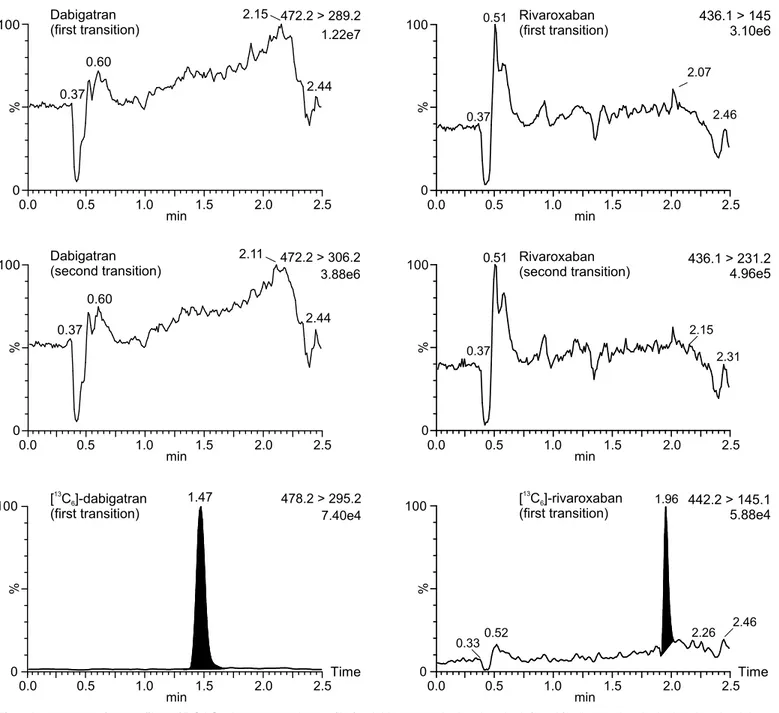
Fig 1. MRM chromatograms of plasma samples with and without DOACs.MRM chromatograms of a plasma sample without any DOACs are depicted on the left (A, B, E, F), as well as MRM chromatograms of a plasma sample containing both dabigatran and rivaroxaban are depicted on the right (I, J, M, N). MRM chromatograms of the internal standard [13C
6]-dabigatran (C, D, K, L) concerning dabigatran, as well as the internal standard [13C6]-rivaroxaban (G, H,
O, P) concerning rivaroxaban are also shown. The first mass transition which was used for quantification of the drug, as well as the second mass transition which was used for verification is plotted. Data were normalized to largest peak in the plots. An estimated peak height is shown in the plots below the transition remark.
typical expected plasma concentrations of dabigatran (e.g. for stroke prevention) which was
under steady-state conditions about 175μg/L (117–275μg/L, 25th-75th percentile range),
mea-sured around 2 hours after 150 mg dabigatran etexilate administration twice daily (specialized information, Pradaxa, Boehringer Ingelheim, Germany), as well as expected plasma concentra-tions of rivaroxaban (e.g. for treatment of acute deep vein thrombosis) with a concentration of
about 215μg/L (22–535μg/L, 90% prediction interval), measured around 2–4 hours after 20
mg rivaroxaban once daily (specialized information, Xarelto, Bayer Pharma AG, Germany).
The limit of detection (LOD) was<0.4μg/L, whereas the limit of quantification (LLOQ)
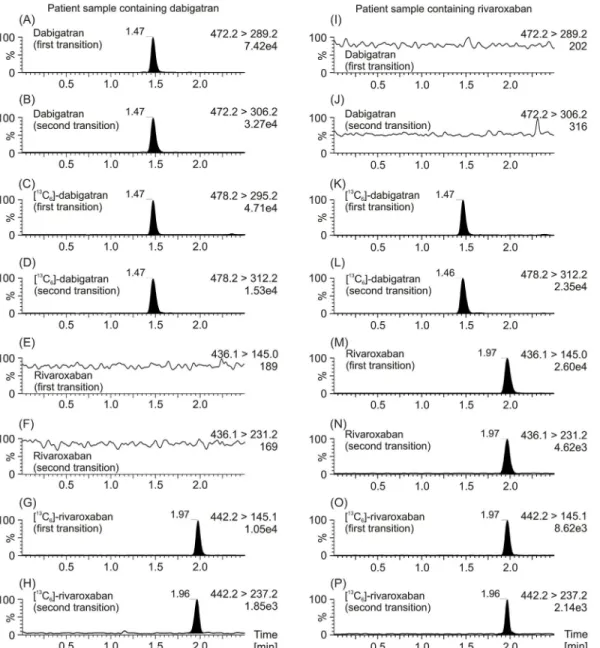
Fig 2. MRM chromatograms of patients’plasma samples.MRM chromatograms of a plasma sample from a patient which have been treated with dabigatran are depicted on the left (A, B, E, F), as well as MRM chromatograms a plasma sample from a patient which have been treated with rivaroxaban are depicted on the right (I, J, M, N). MRM chromatograms of the internal standard [13C
6]-dabigatran (C, D, K, L) concerning dabigatran, as well as the
internal standard [13C
6]-rivaroxaban (G, H, O, P) concerning rivaroxaban are also shown. The first mass transition which was used for quantification of the
drug, as well as the second mass transition which was used for verification is plotted. Data were normalized to largest peak in the plots. An estimated peak height is shown in the plots below the transition remark.
Fig 3. Product ion spectra of DOACs.Product ion spectra of dabigatran (A) and rivaroxaban (C), as well as its internal standards [13C
6]-dabigatran (B) and [13C6]-rivaroxaban (D) are depicted. The MH+precursor ions
and the fragment ions are shown. The chemical structures of the molecules are depicted. In addition, the positions of the13C
6atoms of the internal standards [13C6]-dabigatran (B) and [13C6]-rivaroxaban (D) are
shown.
was<0.6μg/L for both anticoagulants in the LC-MRM MS assay, which is clearly lower than the typical plasma concentration of dabigatran- or rivaroxaban-treated patients. LOD and LLOQ of our LC-MRM MS method were slightly lower in comparison to the existing LC-MS/
MS methods for DOAC measurement which were about 1μg/L or higher (seeTable 3) [13–15,
24], implying that our method was a little bit more sensitive (see subsection“Comparison with
other LC-MS assays”). Accuracy, recovery, intra-assay and inter-assay precision for dabigatran
Fig 4. Ion suppression profiles of DOACs.Ion suppression profile for dabigatran is depicted on the left and for rivaroxaban is depicted on the right, respectively, performed with a post-column flow injection of 0.1 mg/L drug into the UPLC elute of drug-free samples. In addition, the mass transition of the corresponding internal standard is shown. Data were normalized to largest peak in the plots. An estimated peak height is shown in the plots below the transition remark.
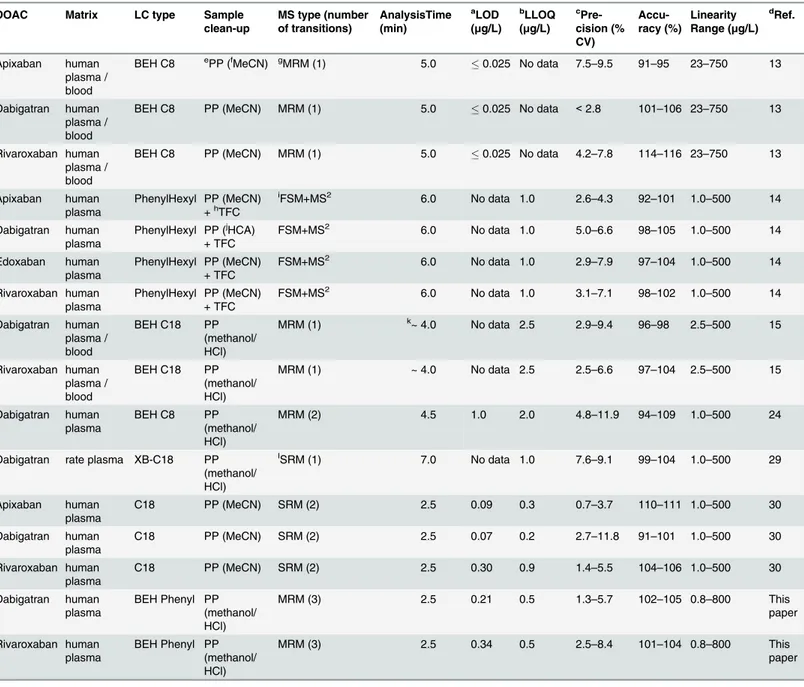
Table 3. LC-MS/MS method comparison for the determination of DOACs.
DOAC Matrix LC type Sample
clean-up
MS type (number of transitions) AnalysisTime (min) aLOD (μg/L) bLLOQ (μg/L) c Pre-cision (% CV) Accu-racy (%) Linearity Range (μg/L) dRef. Apixaban human plasma / blood
BEH C8 ePP (fMeCN) gMRM (1) 5.0 0.025 No data 7.5
–9.5 91–95 23–750 13
Dabigatran human plasma / blood
BEH C8 PP (MeCN) MRM (1) 5.0 0.025 No data <2.8 101–106 23–750 13
Rivaroxaban human plasma / blood
BEH C8 PP (MeCN) MRM (1) 5.0 0.025 No data 4.2–7.8 114–116 23–750 13
Apixaban human plasma
PhenylHexyl PP (MeCN) +hTFC
iFSM+MS2 6.0 No data 1.0 2.6
–4.3 92–101 1.0–500 14
Dabigatran human plasma
PhenylHexyl PP (jHCA)
+ TFC
FSM+MS2 6.0 No data 1.0 5.0
–6.6 98–105 1.0–500 14
Edoxaban human plasma
PhenylHexyl PP (MeCN) + TFC
FSM+MS2 6.0 No data 1.0 2.9
–7.9 97–104 1.0–500 14
Rivaroxaban human plasma
PhenylHexyl PP (MeCN) + TFC
FSM+MS2 6.0 No data 1.0 3.1
–7.1 98–102 1.0–500 14
Dabigatran human plasma / blood
BEH C18 PP (methanol/ HCl)
MRM (1) k~ 4.0 No data 2.5 2.9
–9.4 96–98 2.5–500 15
Rivaroxaban human plasma / blood
BEH C18 PP (methanol/ HCl)
MRM (1) ~ 4.0 No data 2.5 2.5–6.6 97–104 2.5–500 15
Dabigatran human plasma
BEH C8 PP
(methanol/ HCl)
MRM (2) 4.5 1.0 2.0 4.8–11.9 94–109 1.0–500 24
Dabigatran rate plasma XB-C18 PP (methanol/ HCl)
lSRM (1) 7.0 No data 1.0 7.6
–9.1 99–104 1.0–500 29
Apixaban human plasma
C18 PP (MeCN) SRM (2) 2.5 0.09 0.3 0.7–3.7 110–111 1.0–500 30
Dabigatran human plasma
C18 PP (MeCN) SRM (2) 2.5 0.07 0.2 2.7–11.8 91–101 1.0–500 30
Rivaroxaban human plasma
C18 PP (MeCN) SRM (2) 2.5 0.30 0.9 1.4–5.5 104–106 1.0–500 30
Dabigatran human plasma
BEH Phenyl PP (methanol/ HCl)
MRM (3) 2.5 0.21 0.5 1.3–5.7 102–105 0.8–800 This paper
Rivaroxaban human plasma
BEH Phenyl PP (methanol/ HCl)
MRM (3) 2.5 0.34 0.5 2.5–8.4 101–104 0.8–800 This paper
a
LOD: Limit Of Detection;
bLLOD: Lower Limit Of Quanti fication;
cPrecision: Inter-day precision; d
Ref.: References;
ePP: protein precipitation; fMeCN: acetonitrile; g
MRM: multiple reaction monitoring;
hTFC: TurboFlow column (Cyclone C18-P-XL) [clean-up];
iFSM+MS2: full scan mode with single data-dependent fragmentation (MS2) scans; j
HCA: 0.1 mol/L aqueous hydrochloric acid;
k~: nearly;
lSRM: selected reaction monitoring. The sample volume was approximately 100
μl for all methods.
and rivaroxaban were high, as presented inTable 2. These assay parameters of our method are
broadly comparable with the existing LC-MS/MS methods for DOACs [13–15].
Dabigatran and rivaroxaban were stable in citrate plasma for at least 1 week at -20°C (after thawing), 4°C, RT, and 37°C, which was ascertained with systematic testing over a period of 1 month. Both compounds seem to be very stable in plasma. Our results corresponds with
previ-ous studies which present that both DOACs showed adequate stability during three freeze–
thaw cycles, 24 h of plasma storage at room temperature and 4°C, and 72 days of plasma
stor-age at a temperature lower than -80°C [13].
Method comparison with commercially available coagulation-based
assays
Method comparison analysis between our UPLC-MRM MS method and the commercially available automated DTI assay used for dabigatran measurement from CoaChrom Diagnostica and the commercially available automated anti-Xa assay used for rivaroxaban measurement from Chromogenix, respectively, was performed using 55 samples of drug-free citrate plasma spiked with dabigatran, as well as a further 55 samples of drug-free citrate plasma spiked with rivaroxaban. Both commercially available assays were performed on the ACL-TOP analyzer.
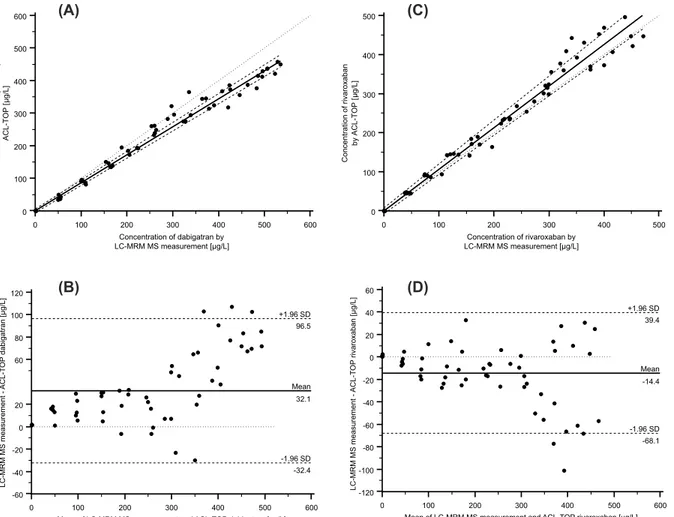
As shown inFig 5A and 5C, both method comparisons showed a high degree of correlation.
The Passing-Bablok regression analysis revealed an intercept of -1.03μg/L (95% confidential
interval (95% CI), -6.10 to 4.35μg/L) and a slope of 0.86μg/L (95% CI, 0.84 to 0.89μg/L) for
dabigatran (Fig 5A), and an intercept of 0.00μg/L (95% CI, -7.10 to 7.80μg/L) and a slope of
1.07μg/L (95% CI, 1.00 to 1.12μg/L) for rivaroxaban (Fig 5C). The correlations coefficient was
0.988 for dabigatran and 0.984 for rivaroxaban. In order to further assess the agreement between the two measurement techniques, the difference between the results of the two
meth-ods was plotted against the average of the two methmeth-ods as described by Bland and Altman [25,
26]. The Bland and Altman plot of dabigatran measurements showed a proportional error in
cases where high concentrations were measured (Fig 5B), and the Bland and Altman plot of
rivaroxaban results showed that the variation of at least one method depends on the magnitude
of measurements (Fig 5D).
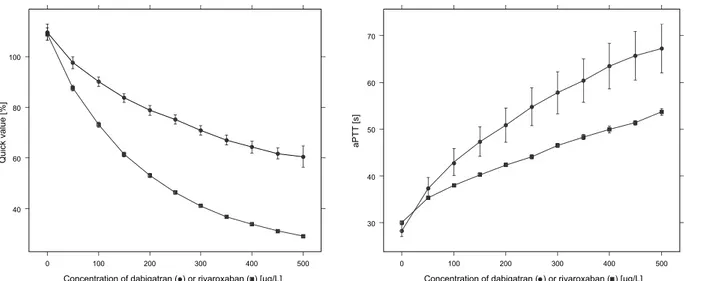
Furthermore, we investigated the effects of dabigatran and rivaroxaban using global coagu-lation assays by measurement of aPTT and PT, whereby the Quick value was calculated using the PT. Therefore, we used on the one hand dabigatran and on the other hand rivaroxaban spiked plasma samples. Increasing concentrations of dabigatran or rivaroxaban showed an expected elevation of aPTT, as well as PT which corresponds to a lower Quick value, as shown
inFig 6. Our results are consistent with the reported data described in the literature [8,11,12,
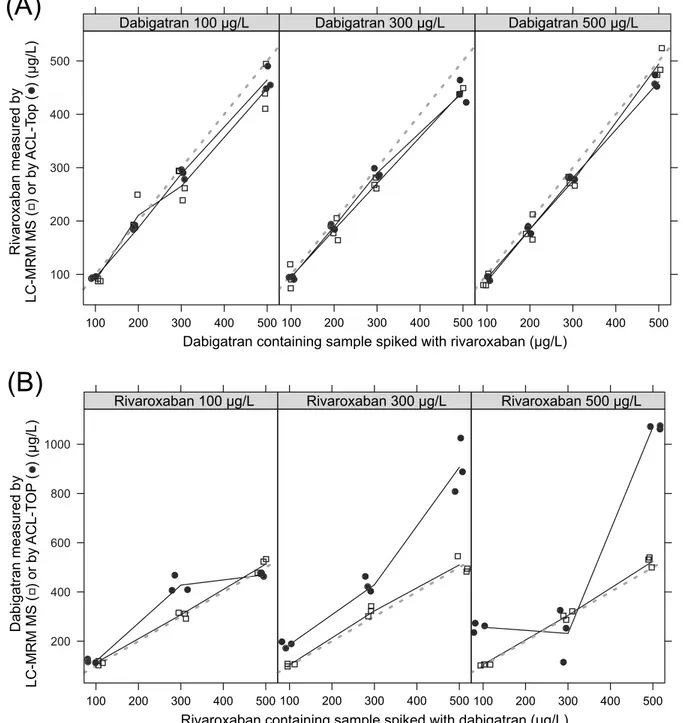
27]. In a further experiment, we measured one of the drugs in samples which were spiked with
both of them. As shown inFig 7Adifferent dabigatran concentrations in the samples have
nearly no influence on the rivaroxaban measurements regardless of whether the measurement was performed by mass spectrometry or by the automated anti-Xa assay used for rivaroxaban measurement from Chromogenix on the ACL-TOP analyzer. The measured values of both methods displayed good correlation with the spiked concentration of rivaroxaban in the sam-ples with low, medium, and high dabigatran concentration, respectively. In contrast, determi-nation of dabigatran in samples spiked with rivaroxaban showed good correlation by mass spectrometry measurement regarding increasing concentrations of dabigatran in samples with low, medium, and high rivaroxaban concentrations, respectively. Poor correlation was found for automated DTI assay used for dabigatran measurement from CoaChrom Diagnostica
per-formed on the ACL-TOP analyzer (Fig 7B). Especially in samples with high rivaroxaban
high rivaroxaban concentrations interfere with the DTI assay. No suitable data were obtained using the diluted thrombin time. Most of the samples measured by this application showed
val-ues higher than expected (Fig 7B). One possible explanation could be that the added
rivaroxa-ban reduces the amount of endogenous thrombin. Overall, one can say that the measurement of dabigatran in the presence of rivaroxaban, as well as the measurement of rivaroxaban in the presence of dabigatran is unproblematic using our mass spectrometric method in contrast to certain other measurement techniques for these drugs such as classical clotting or chromogenic assays.
In routine laboratory diagnostics, a further advantage/benefit of mass spectrometry analysis of the drug rivaroxaban in the clinical setting could be overlapping therapy of preoperative dis-continuation of DOAC and bridging with low molecular weight heparin (LMWH), although
Fig 5. Method comparison using Passing-Bablok regression and Bland-Altman plot.(A) Comparison of dabigatran results obtained by the LC-MRM MS assay and the DTI assay used for dabigatran measurement from CoaChrom Diagnostica performed on the ACL-TOP analyzer by Passing-Bablok regression: DTI assay = 0.86 (LC-MRM MS)–1.03 [μg/L] (r = 0.99; n = 55; 95% CI for slope, 0.84–0.89; 95% CI for intercept, -6.10μg/L—4.35μg/L). (B)
Bland-Altman plot for the comparison of LC-MRM MS assay vs. DTI assay from CoaChrom Diagnostica. The mean value (n = 55) of the two methods is plotted against the difference between the two values (LC-MRM MS assay–DTI assay from CoaChrom Diagnostica). The mean difference between the two methods was 32.1μg/L. The mean (–) and±2 SD lines (—) are plotted for references. (C) Comparison of rivaroxaban results obtained by LC-MRM MS assay
and the anti-Xa assay used for rivaroxaban from Chromogenix performed on the ACL-TOP analyzer by Passing-Bablok regression: anti-Xa assay = 1.07 (LC-MRM MS) + 0.00 [μg/L] (r = 0.98; n = 55; 95% CI for slope, 1.00–1.12; 95% CI for intercept, -7.10μg/L–7.80μg/L). (D) Bland-Altman plot for the
comparison of LC-MRM MS assay vs. anti-Xa assay used for rivaroxaban from Chromogenix. The mean value (n = 55) of the two methods is plotted against the difference between the two values (LC-MRM MS assay–anti-Xa assay from Chromogenix). The mean difference between the two methods was -14.4μg/
L. The mean (–) and±2 SD lines (—) are plotted for references.
such a therapy is controversially discussed [28]. In this case it is not possible to measure the residual amounts of rivaroxaban using a standard coagulation assay because both anticoagu-lants (LMWH and rivaroxaban) influence the coagulation.
Comparison with other LC-MS assays
First LC-MS methods for quantification of DOACs were recently published [13–15,24,29,30].
However, these methods differ in some cases significantly from our method. The most impor-tant differences between our method and previously published DOAC assays are shown in
Table 3. As can be seen in this table, our UPLC-MRM MS method has an analysis time of 2.5
min which turns out to be one of the fastest together with the assay reported by Blaich et al.
[30]. The precision for dabigatran measurement of our method was higher than the precision
of the other methods with the exception of the method reported by Schmitz et al. [13] which
shows the highest precision for this DOAC. In addition, our method shows a wide linear mea-suring range, larger than the previously published DOAC methods for dabigatran and rivarox-aban, respectively. Most previously published LC-MS/MS methods for DOACs measurement
used only one mass transition for quantification [13,15,29], two methods used a further
sec-ond mass transition for qualification [24,30], one method measured the DOACs by full scan
mode with single data-dependent fragmentation (MS2) scans, whereas our UPLC-MRM MS
method used a mass transition for quantification, a further mass transition for qualification, and an additional third mass transition for more comprehensive identification. LOD, LLOQ, and accuracy of our method were comparably well for both compounds according to
previ-ously published DOAC LC-MS assays (Table 3). Furthermore,Table 3shows also that no
sig-nificant differences in response could be seen between samples prepared from plasma and those prepared from whole blood, indicating that the studied DOACs are not adsorbed to
erythrocytes [13].
LC-MS measurement of DOACs as routine clinical diagnostic application
LC-MS has been increasingly used in routine clinical laboratories and more and more clinical parameters including amino acids, proteins, peptides, lipids, and lipoproteins were measured
by this technique [31–33]. In addition, MS-based clinical assays which provide rapid and
Fig 6. Effects of dabigatran and rivaroxaban on blood clotting.Quick values and aPTT of dabigatran or rivaroxaban spiked blood samples. The mean and standard deviation of two measurements of each case are depicted.
multicomponent analysis with high sensitivity and selectivity are used more often for drug
monitoring and toxicological examinations [16–18,34,35]. Last but not least there are also
LC-MS methods developed which were used to measure enzyme activities [36–39]. The high
specificity, sensitivity, and the possibility to measure several analytes simultaneously make it
Fig 7. Mutual influences of DOAC measurement.(A) Measurement of rivaroxaban in rivaroxaban and dabigatran spiked plasma. Concentrations were quantified using our UPLC-MRM MS assay (free squares), as well as the automated anti-Xa assay used for rivaroxaban measurement from Chromogenix on the ACL-TOP analyzer (filled circles). For clarification, the measuring points were connected (solid line). The line of identity X = Y is also shown (dotted line). (B) Measurement of dabigatran in rivaroxaban and dabigatran spiked plasma. Concentrations were quantified using our UPLC-MRM MS assay (free squares), as well as the automated DTI assay for dabigatran measurement from CoaChrom Diagnostica performed on the ACL-TOP analyzer. For clarification, the measuring points were connected (solid line). The line of identity X = Y is also shown (dotted line).
an ideal alternative to immunoassays. Furthermore, LC-MS offers higher flexibility than
immunoassays and abundant information can be received from a single LC-MS run [31].
How-ever, several limitations of LC-MS obviously exist such as high instrument cost, the need of expertise, and the need of time-consuming validation of the LC-MS assay. Maybe these limita-tions can be overcome in the future with easier to handle as well as low-cost equipment. Our
fast, precise, and direct measurement of DOACs by LC-MS in patients’plasma is a further
MS-based application suitable for routine measurement of dabigatran and rivaroxaban which gives
information about the drug level in patients’blood and is therefore helpful in different clinical
circumstances such as in the case of suspicion of overdose, when patients switch from existing oral anticoagulant, in patients with hepatic or renal impairment, by concomitant use of
interac-tion drugs, or to assess anticoagulant concentrainterac-tion in patients’blood before major surgery.
Conclusions
A specific, sensitive and very fast ultra-performance liquid chromatography electrospray-tan-dem mass spectrometry assay using stable isotope standards was developed and validated for the simultaneous determination of rivaroxaban and dabigatran in human plasma. The method was successfully applied to determine the concentrations of the two drugs independent of inter-ference factors such as hemolysis or lipaemic plasma. This study additionally compares the per-formance of the two different analytical methods for determining concentrations of
rivaroxaban and dabigatran in plasma samples showing a high correlation between standard diagnostic assays and the newly developed mass spectrometry method. The newly developed method may be useful in risk assessment in patients undergoing DOACs treatment.
Acknowledgments
We thank Annika Wolff for her excellent technical assistance.
Author Contributions
Conceived and designed the experiments: JK TG TF MD JB CK IB. Performed the experiments: JK TG TF JB IB. Analyzed the data: JK TG MD DH IB. Contributed reagents/materials/analysis tools: JK TG CK IB. Wrote the paper: JK DH IB.
References
1. Guyatt GH, Akl EA, Crowther M, Gutterman DD, Schuünemann HJ. Executive summary: Antithrombo-tic Therapy and Prevention of Thrombosis, 9th ed: American College of Chest Physicians Evidence-Based Clinical Practice Guidelines. Chest. 2012; 141: 7S–47S. doi:10.1378/chest.1412S3PMID: 22315257
2. Büller HR, Décousus H, Grosso MA, Mercuri M, Middeldorp S, Prins MH, et al. Edoxaban versus warfa-rin for the treatment of symptomatic venous thromboembolism. N Engl J Med. 2013; 369: 1406–1415. doi:10.1056/NEJMoa1306638PMID:23991658
3. Ridgefield C. Pradaxa (dabigatran) package insert. Boehringer Ingelheim Pharmaceuticals; 2012.
4. Mueck W, Eriksson BI, Bauer KA, Borris L, Dahl OE, Fisher WD, et al. Population pharmacokinetics and pharmacodynamics of rivaroxaban—an oral, direct factor Xa inhibitor—in patients undergoing major orthopaedic surgery. Clin Pharmacokinet. 2008; 47: 203–216. PMID:18307374
5. Raghavan N, Frost CE, Yu Z, He K, Zhang H, Humphrey WG, et al. Apixaban metabolism and pharma-cokinetics after oral administration to humans. Drug Metab Dispos. 2009; 37: 74–81. doi:10.1124/dmd. 108.023143PMID:18832478
6. Lassen MR, Davidson BL, Gallus A, Pineo G, Ansell J, Deitchman D. The efficacy and safety of apixa-ban, an oral, direct factor Xa inhibitor, as thromboprophylaxis in patients following total knee replace-ment. J Thromb Haemost. 2007; 5: 2368–2375. PMID:17868430
8. Hawes EM, Deal AM, Funk-Adcock D, Gosselin R, Jeanneret C, Cook AM, et al. Performance of coagu-lation tests in patients on therapeutic doses of dabigatran: a cross-sectional pharmacodynamic study based on peak and trough plasma levels. J Thromb Haemost. 2013; 11: 1493–1502. doi:10.1111/jth. 12308PMID:23718677
9. Hillarp A, Baghaei F, Fagerberg Blixter I, Gustafsson KM, Stigendal L, Sten-Linder M, et al. Effects of the oral, direct factor Xa inhibitor rivaroxaban on commonly used coagulation assays. J Thromb Hae-most. 2011; 9: 133–139. doi:10.1111/j.1538-7836.2010.04098.xPMID:20946166
10. Hillarp A, Gustafsson KM, Faxälv L, Strandberg K, Baghaei F, Fagerberg Blixter I, et al. Effects of the oral, direct factor Xa inhibitor apixaban on routine coagulation assays and anti-Xa assays. J Thromb Haemost. 2014; 12: 1545–1553. doi:10.1111/jth.12649PMID:24965851
11. Baglin T, Hillarp A, Tripodi A, Elalamy I, Buller H, Ageno W. Measuring Oral Direct Inhibitors (ODIs) of thrombin and factor Xa: A recommendation from the Subcommittee on Control of Anticoagulation of the Scientific and Standardisation Committee of the International Society on Thrombosis and Haemostasis. J Thromb Haemost. 2013 Jan 24. doi:10.1111/jth.12149
12. Helin TA, Pakkanen A, Lassila R, Joutsi-Korhonen L. Laboratory assessment of novel oral anticoagu-lants: method suitability and variability between coagulation laboratories. Clin Chem. 2013; 59: 807–
814. doi:10.1373/clinchem.2012.198788PMID:23378569
13. Schmitz EM, Boonen K, van den Heuvel DJ, van Dongen JL, Schellings MW, Emmen JM, et al. Deter-mination of dabigatran, rivaroxaban and apixaban by UPLC-MS/MS and coagulation assays for therapy monitoring of novel direct oral anticoagulants. J Thromb Haemost. 2014; 12:1636–1646. doi:10.1111/ jth.12702PMID:25142183
14. Gous T, Couchman L, Patel JP, Paradzai C, Arya R, Flanagan RJ. Measurement of the Direct Oral Anti-coagulants Apixaban, Dabigatran, Edoxaban, and Rivaroxaban in Human Plasma Using Turbulent Flow Liquid Chromatography With High-Resolution Mass Spectrometry. Ther Drug Monit. 2014; 36: 597–605. doi:10.1097/FTD.0000000000000059PMID:24695356
15. Korostelev M, Bihan K, Ferreol L, Tissot N, Hulot JS, Funck-Brentano C, et al. Simultaneous determina-tion of rivaroxaban and dabigatran levels in human plasma by high-performance liquid chromato-graohy-tandem mass spectrometry. J Pharm Biomed Anal. 2014; 100: 230–235. doi:10.1016/j.jpba. 2014.08.011PMID:25173108
16. Kuhn J, Vollmer T, Martin C, Hendig D, Knabbe C. Fast and sample cleanup-free measurement of nico-tine and cotinine by stable isotope dilution ultra-performance liquid chromatography–tandem mass spectrometry. J Pharm Biomed Anal. 2012 Aug-Sep; 67–68: 137–143. doi:10.1016/j.jpba.2012.04.036 PMID:22608097
17. Kuhn J, Knabbe C. Fully validated method for rapid and simultaneous measurement of six antiepileptic drugs in serum and plasma using ultra-performance liquid chromatography–electrospray ionization tan-dem mass spectrometry. Talanta. 2013 Jun 15; 110: 71–80, doi:10.1016/j.talanta.2013.02.010PMID: 23618178
18. Kuhn J, Prante C, Kleesiek K, Gotting C. Measurement of mycophenolic acid and its glucuronide using a novel rapid liquid chromatography-electrospray ionization tandem mass spectrometry assay. Clin Biochem. 2009; 42: 83–90. doi:10.1016/j.clinbiochem.2008.10.004PMID:18996104
19. Bossuyt PM, Reitsma JB, Bruns DE, Gatsonis CA, Glasziou PP, Irwig LM, et al. Towards complete and accurate reporting of studies of diagnostic accuracy: the STARD initiative. Clin Chem Lab Med. 2003; 41: 68–73. PMID:12636052
20. Bossuyt PM, Reitsma JB, Bruns DE, Gatsonis CA, Glasziou PP, Irwig LM, et al. The STARD statement for reporting studies of diagnostic accuracy: explanation and elaboration. Clin Chem. 2003; 49: 7–18. PMID:12507954
21. Shah VP, Midha KK, Findlay JW, Hill HM, Hulse JD, McGilveray IJ, et al. Bioanalytical method valida-tion—a revisit with a decade of progress. Pharm Res. 2000; 17: 1551–1557. PMID:11303967
22. Blech S, Ebner T, Ludwig-Schwellinger E, Stangier J, Roth W. The metabolism and disposition of the oral direct thrombin inhibitor, dabigatran, in humans. Drug Metab Dispos. 2008; 36: 386–399. PMID: 18006647
23. Lang D, Freudenberger C, Weinz C. In vitro metabolism of rivaroxaban, an oral, direct factor Xa inhibi-tor, in liver microsomes and hepatocytes of rats, dogs, and humans. Drug Metab Dispos. 2009; 37: 1046–1055. doi:10.1124/dmd.108.025551PMID:19196846
24. Delavenne X, Moracchini J, Laporte S, Mismetti P, Basset T. UPLC MS/MS assay routine quantification of dabigatran—A direct thrombin inhibitor—in human plasma. J Pharm Biomed Anal. 2012; 58: 152–
156. doi:10.1016/j.jpba.2011.09.018PMID:21996066
26. Bland JM, Altman DG. Agreed statistics: measurement method comparison. Anesthesiology. 2012; 116: 182–185. doi:10.1097/ALN.0b013e31823d7784PMID:22129533
27. Eller T, Busse J, Dittrich M, Flieder T, Alban S, Knabbe C, et al. Dabigatran, rivaroxaban, apixaban, argatroban and fondaparinux and their effects on coagulation POC and platelet function tests. Clin Chem Lab Med. 2014; 52: 835–844. doi:10.1515/cclm-2013-0936PMID:24406289
28. Ferrandis R, Castillo J, de Andrés J, Gómar C, Gomez-Luque A, Hidalgo F, et al. The perioperative management of new direct oral anticoagulants: a question without answers. Thromb Haemost. 2013; 110: 515–522. doi:10.1160/TH12-11-0868PMID:23846475
29. Li J, Fang J, Zhong F, Li W, Tang Y, Xu Y, et al. Development and validation of a liquid chromatogra-phy/tandemmass spectrometry assay for the simultaneous determination ofdabigatran etexilate, inter-mediate metabolite and dabigatran in 50μL rat plasma and its application to pharmacokinetic study. J
Chromatogr B. 2014; 973: 110–119.
30. Blaich C, Müller C, Michels G, Wiesen MHJ. Multi-analyte analysis of non-vitamin K antagonist oral anti-coagulants in human plasma using tandem mass spectrometry. Clin Chem Lab Med. 2015 Nov 1; 53: 1981–90. doi:10.1515/cclm-2014-1108PMID:25901716
31. Leung KS, Fong BM. LC-MS/MS in the routine clinical laboratory: has its time come? Anal Bioanal Chem. 2014 Apr; 406: 2289–2301. doi:10.1007/s00216-013-7542-5PMID:24337187
32. van den Ouweland JM, Kema IP. The role of liquid chromatography-tandem mass spectrometry in the clinical laboratory. J Chromatogr B Analyt Technol Biomed Life Sci. 2011; 883–884: 18–32.
33. Ceglarek U, Dittrich J, Becker S, Baumann F, Kortz L, Thiery J. Quantification of seven apolipoproteins in human plasma by proteotypic peptides using fast LC-MS/MS. Proteomics Clin Appl. 2013; 7: 794–
801. doi:10.1002/prca.201300034PMID:23970378
34. Aucella F, Lauriola V, Vecchione G, Tiscia GL, Grandone E. Liquid chromatography-tandem mass spectrometry method as the golden standard for therapeutic drug monitoring in renal transplant. J Pharm Biomed Anal. 2013; 86: 123–126. doi:10.1016/j.jpba.2013.08.001PMID:23995754
35. Zander J, Maier B, Suhr A, Zoller M, Frey L. Quantification of piperacillin, tazobactam, cefepime, mero-penem, ciprofloxacin and linezolid in serum using an isotope dilution UHPLC-MS/MS method with semi-automated sample preparation. Clin Chem Lab Med. 2015; 53: 781–791. doi: 10.1515/cclm-2014-0746PMID:25301676
36. Kuhn J, Götting C, Beahm BJ, Bertozzi CR, Faust I, Kuzaj P, et al. Xylosyltransferase II is the predomi-nant isoenzyme which is responsible for the steady-state level of xylosyltransferase activity in human serum. Biochem Biophys Res Commun. 2015; 459: 469–474. doi:10.1016/j.bbrc.2015.02.129PMID: 25748573
37. Kuhn J, Kleesiek K, Götting C. Determination of beta4-galactosyltransferase-7 activity using high-per-formance liquid chromatography-electrospray ionization tandem mass spectrometry. Clin Biochem. 2009; 42: 521–527. doi:10.1016/j.clinbiochem.2008.12.009PMID:19133250
38. Li Y, Huang X, Harmonay L, Liu Y, Kellogg MD, Fridovich-Keil JL, et al. Liquid chromatography-tandem mass spectrometry enzyme assay for UDP-galactose 4'-epimerase: use of fragment intensity ratio in differentiation of structural isomers. Clin Chem. 2014 May; 60: 783–790. doi:10.1373/clinchem.2013. 219931PMID:24578239
![Fig 3. Product ion spectra of DOACs. Product ion spectra of dabigatran (A) and rivaroxaban (C), as well as its internal standards [ 13 C 6 ]-dabigatran (B) and [ 13 C 6 ]-rivaroxaban (D) are depicted](https://thumb-eu.123doks.com/thumbv2/123dok_br/17124589.238658/10.918.297.656.112.975/product-product-dabigatran-rivaroxaban-standards-dabigatran-rivaroxaban-depicted.webp)