LC-MS/MS Method for Serum Creatinine:
Comparison with Enzymatic Method and
Jaffe Method
Meixian Ou1,2☯, Yunxiao Song1,3☯, Shuijun Li1,2*, Gangyi Liu1,2, Jingying Jia1,2, Menqi Zhang1,2, Haichen Zhang1,3, Chen Yu1,2
1Shanghai Clinical Research Center, Chinese Academy of Sciences, Shanghai, China,2Central Laboratory, Shanghai Xuhui Central Hospital, Shanghai, China,3Department of Clinical Laboratory, Shanghai Xuhui Central Hospital, Shanghai, China
☯These authors contributed equally to this work. *[email protected]
Abstract
Accurate quantification of creatinine (Cre) is important to estimate glomerular filtration rate (GFR). Differences among various methods of Cre quantification were previously noted. This study aims to develop a liquid chromatography tandem mass spectrometry (LC-MS/ MS) method for serum Cre and compare this method with clinical routine methods. LC-MS/ MS analysis was performed on API 4000 triple quadrupole mass spectrometer coupled with an Agilent 1200 liquid chromatography system. After adding isotope-labeled Cre-d3 as internal standard, serum samples were prepared via a one-step protein precipitation with methanol. The LC-MS/MS method was compared with frequently used enzymatic method and Jaffe method. This developed method, with a total run time of 3 min, had a lower limit of quantification of 4.4μmol/L, a total imprecision of 1.15%–3.84%, and an average bias of 1.06%. No significant matrix effect, carryover, and interference were observed for the LC-MS/MS method. The reference intervals of serum Cre measured by LC-LC-MS/MS assay were 41–79μmol/L for adult women, and 46–101μmol/L for adult men. Using LC-MS/MS as a reference, the enzymatic method showed an average bias of -2.1% and the Jaffe method showed a substantial average bias of 11.7%. Compared with the LC-MS/MS method, signif-icant negative bias was observed for the enzymatic and Jaffe methods in hemolytic and lipi-mic samples. We developed a simple, specific, and accurate LC-MS/MS method to analyze serum Cre. Discordance existed among different methods.
Introduction
Endogenous creatinine (Cre) clearance, which is widely used to estimate the glomerular filtra-tion rate (GFR), is a frequently employed biomarker of kidney funcfiltra-tion [1,2]. GFR can be esti-mated using Cre clearance or calculated using formulae, which depend on Cre quantification in the serum. Thus, accurate quantification of Cre is essential to estimate GFR [3–6]. To date,
a11111
OPEN ACCESS
Citation:Ou M, Song Y, Li S, Liu G, Jia J, Zhang M, et al. (2015) LC-MS/MS Method for Serum Creatinine: Comparison with Enzymatic Method and Jaffe Method. PLoS ONE 10(7): e0133912. doi:10.1371/journal.pone.0133912
Editor:Valquiria Bueno, UNIFESP Federal University of São Paulo, BRAZIL
Received:February 26, 2015
Accepted:July 3, 2015
Published:July 24, 2015
Copyright:© 2015 Ou et al. This is an open access article distributed under the terms of theCreative Commons Attribution License, which permits unrestricted use, distribution, and reproduction in any medium, provided the original author and source are credited.
Data Availability Statement:All relevant data are within the paper and its Supporting Information files.
Funding:This work was supported by funds from Shanghai Xuhui Central Hospital (Grant#: 2012XHXH02) and from Shanghai Xuhui District Commission of Health and Family Planning (Grant#: SHXH201301).
enzymatic and Jaffe methods are frequently used in clinical practice [7]. However, marked dif-ferences exist among these methods for lack of adequate specificity. Moreover, these methods are more prone to interference from hemolysis, lipemia, bilirubin, protein, and ketones [8–11]. Interference evaluation and comparison of the proposed method with that of other methods are necessary before the new method is applied in patient care.
A number of mass spectrometry based methods that quantify Cre in serum or plasma with outstanding specificity and sensitivity have been reported [11–15]. An ideal LC-MS/MS method applied in routine use requires a simple sample preparation, fast turnaround time, interference-free analysis, and more importantly, traceability to reference methods or standard reference materials (SRM). However, lack of appropriate investigation on interference [13], or lack of comparison to SRM [11,14] may limit the application of methods to routine analysis of serum Cre.
In this study, we aimed to develop a simple, specific, and reliable LC-MS/MS method to measure serum Cre in routine clinical laboratory. To verify the method's accuracy, we mea-sured the SRM from National Institute of Standards and Technology (NIST) and trueness-based external quality assessment (EQA) samples using this new method. We also compared the results of the enzymatic and Jaffe methods with that of our method to record the differences.
Materials and Methods
Ethics statement
The study was reviewed and approved by Shanghai Xuhui Central Hospital Ethics Committee (protocol #201230) and complied with the guidelines on research involving human subjects. All samples were collected from the serum leftovers in the clinical laboratory of Shanghai Xuhui Central Hospital. All data were analyzed anonymously. The health, security, and privacy of the patients were protected. All experimental procedures were performed in accordance with the Declaration of Helsinki.
Chemicals and solutions
Cre (99.8% purity) and Cre-d3 (98% purity) was purchased from Sigma (St. Louis, MO, USA) and Toronto Research Chemicals (Toronto, Canada), respectively. HPLC-grade acetonitrile was obtained from Dikma Technologies Inc. (Lake Forest, CA, USA). Ammonium acetate was acquired from Shanghai Anpel Scientific Instrument Co., Ltd. (Shanghai, China). Water was prepared in house with Millipore (Merck Millipore, Germany) water purifying system. All other chemicals were of analytical grade.
Cre stock solution was prepared at a concentration of 14.57 mmol/L in water. The working solutions at various concentrations (4.4, 8.8, 17.7, 44.3, 88.5, 177.0, 442.5 and 885.0μmol/L)
were prepared by appropriately diluting the stock solution with 20% methanol. Isotope-labeled Cre-d3 was used as internal standard (IS) and prepared with 20% methanol at 132μmol/L in
working solution. All of these solutions were stored at -20°C until use.
Sample preparation and LC-MS/MS analysis
Aliquots of 50μL of serum samples were mixed with 20μL of IS working solution and 200μL
of methanol in Eppendorf tube and the mixture was vortexed for 30 s. After centrifugation at 15 000 rpm for 3 min, 50μL of supernatant was mixed with 50μL of water. Then the mixture
was transferred into a sample vial. Subsequently, 3μL of the mixture was injected into the
Chromatography separation was performed on an Agilent 1200 series liquid chromatogra-phy system consisting of G1312A binary pump, G1367B Hip ALS autosampler, G1379B degas-ser and G1316A TCC column oven modules (Santa Clara, CA, USA). A Hypersil Silica (5μm,
2.1×100 mm, Thermo, USA) was used as the analytical column eluted with 45% 5 mmol ammonium acetate in water and 55% methanol at 0.3 mL/min. The total run time of the method was 3.0 min.
An API 4000 triple quadrupole mass spectrometer (Applied Biosystems/MDS Sciex, Toronto, Canada) equipped with electrospray ionization source was employed for the analysis. Cre was detected in positive multiple reaction monitoring mode using Q1/Q3 ion transitions at m/z 114.0/86.0 amu as quantifier and m/z 114.0/44.1 amu as qualifier. IS was detected at m/z 117.0/89.0 amu. Maximum permitted tolerance was set within ±20% for quantifier/qualifier ratio in ion intensity. The source parameters were set as follows: curtain gas, 25 arbitrary unit; CAD, 12 arbitrary unit; GS1, 65 arbitrary unit; and GS2, 40 arbitrary unit. The decluster poten-tial, entrance potenpoten-tial, collision energy, collision cell exit potential were optimized as 50 V, 4 V, 17 V, and 8 V, respectively, by infusing standard Cre and Cre-d3 solutions (both at 1μg/mL
in methanol) into the mass spectrometer. Capillary voltage was set at 4.5 kV, and the source temperature was set at 550°C. Analyst 1.5 software (Applied Biosystems/MDS Sciex, Toronto, Canada) was used for equipment control, data acquisition and report processing. Cre was quantified by calibrating for each run by using a 1/x weighted least square regression.
Method validation
Method validation included the evaluation of the matrix effect, candidate matrix selection, interference, linearity, precision, accuracy, carryover, and stability by referring to the CLSI guidelines EP10-A3 [16], EP7-A2 [17], C50-A [18] and FDA Guidance for Industry Bioanalyti-cal Method Validation [19].
Matrix effect was evaluated using a post column infusion approach. Pure IS solution (132.7μmol/L in 20% methanol) was infused using a syringe pump at 20μL/min via the
T-con-nection to the analytical column. Simultaneously, serum samples collected from three males and three females were injected by an autosampler. A decrease or increase of the baseline of Cre-d3 at the retention time indicated ion suppression or ion enhancement.
Given the endogenous nature of Cre, a“blank”serum is unavailable. Therefore, selecting a candidate matrix for the preparation of calibrators and dilution of highly concentrated samples is necessary. To verify the suitability of 20% methanol for this purpose, a pure solution of ana-lyte was solved in 20% methanol and spiked at the upper reference limit. Samples from three males and three females were subsequently prepared. The solutions mentioned above were mixed at 1:1 (v/v) ratio. A percentage difference of Cre to IS signal ratio between the mixed samples and theoretical value (average of real serum samples and spiked analyte) within ±20% is considered suitable as candidate matrix.
The potential interference from endogenous compounds was evaluated by comparing the Cre to IS signal ratio of mixed samples with lipimic, hemolytic, icteric, and uremic samples. Cre was spiked to 20% methanol at the upper and lower ends of the reference range. Subsequently, they were mixed with endogenous interference samples at 1:1 (v/v) ratio. Three groups of sam-ples including spiked, mixed, and endogenous interference were prepared at once. A less than 20% percentage difference in signal ratio between mixed samples and the average of spiked and endogenous interference samples was considered no significant interference. The interference process was based on the CLSI guideline EP7-A2 (Interference Testing in Clinical Chemistry).
analytical accuracy falls within 85%-115%, and when the coefficient of variation (CV) falls within ±15%. However, the linearity of the lower limit of quantification (LLOQ) is acceptable if accuracy is within 80%-120% and CV is within ±20%. Evaluating linearity was mainly based on the principle of FDA guidance (Bioanalytical Method Validation).
LLOQ is the lowest concentration that could be measured with acceptable accuracy (80%-120%), CV (±20%), and with signal to noise ratio (S/N) greater than 10. LLOQ requirements were based from the CLSI guideline C50-A (Mass Spectrometry in the Clinical Laboratory: General Principles and Guidance).
Precision was evaluated by analyzing QCs at three levels in pooled patient samples. Intra-assay precision as determined by analyzing QCs of 20 replicates within a run, whereas inter-assay precision was determined by analyzing QCs of three replicates per run, two runs per day, for 5 days. Precision was evaluated according to the CLSI Guideline EP10-A3 (Preliminary Evaluation of Quantitative Clinical Laboratory Measurement Procedures).
Accuracy was assessed by determining the SRM 1950 purchased from NIST for three repli-cates per run in three runs. A percentage deviation from certified concentration<15% is accepted.
A high sample at a minimum of twice the upper limit and a low sample at 20% above the lower limit of the analytical measurement range were prepared in 20% methanol. Low sample was sequentially injected before and after the high sample. The calculated difference within ±20% between the two low samples indicated no significant carryover. This process was according to the approved CLSI Guideline EP10-A3 (Preliminary Evaluation of Quantitative Clinical Laboratory Measurement Procedures).
Stability was investigated under various conditions. Bench-top stability was evaluated by plac-ing serum samples on bench top at room temperature for 24 h. Freeze-thaw stability was evalu-ated using three cycles of varying temperature from -20°C to room temperature. Autosampler stability was assessed by placing processed serum samples in an autosampler at room tempera-ture for 36 h. Long-term stability was evaluated by freezing serum samples at -20°C for 4 months.
Method comparison
Leftovers of serum samples were collected from the clinical laboratory of Shanghai Xuhui Cen-tral Hospital for method comparison. These samples were obtained from 100 males
(57.0 ± 21.1 years, range: 18–92 years) and 262 females (61.6 ± 13.9 years, range: 18–94 years). Meanwhile, leftovers of 50 hemolytic serum samples and 50 lipimic samples (triglycerides: 1.88–17.6 mmol/L) were collected. All samples were split into three aliquots and stored at -20°C until analysis.
The samples were simultaneously analyzed with LC-MS/MS, enzymatic and Jaffe methods for serum Cre. Prior to analysis, the enzymatic and Jaffe methods were calibrated with calibrators and then internal quality controls (lyophilized quality control serum at normal level and disease level, Mindray, Shenzhen, China) were measured (acceptable biases 4.3%) according to respective manual instructions and procedures. The enzymatic and Jaffe methods were performed on a BS 800 automatic biochemical analyzer (Mindray, Shenzhen, China). The detection range of the enzymatic method was 10–9000μmol/L with endpoint reaction mode at 546 nm wavelength and
reaction temperature at 37°C. The detection range of the Jaffe method was 9–2420μmol/L with
fixed time reaction mode at 510 nm wavelength and similar reaction temperature.
Statistics
ANOVA by SPSS software (version 22.0, IBM).P<0.05 is considered as statistically significance.
Results
Method validation
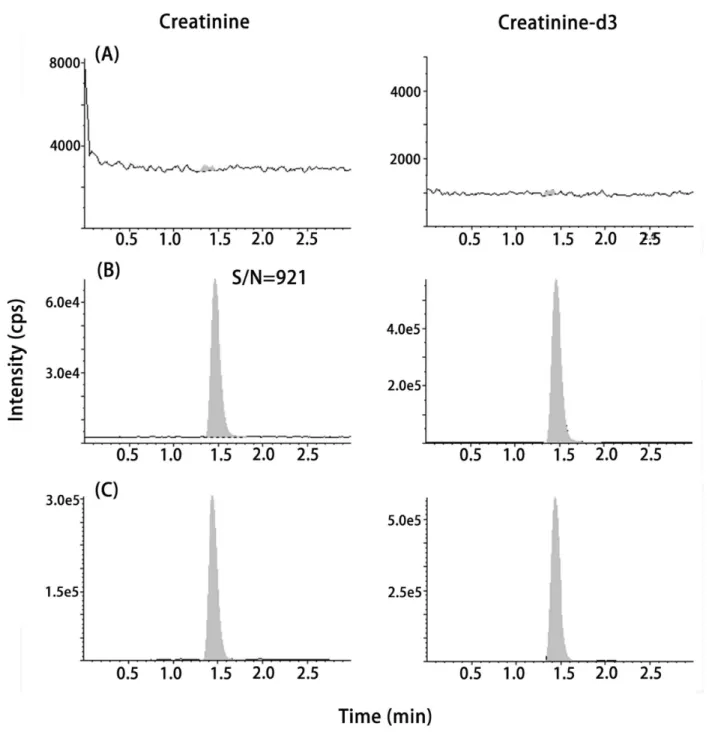
Silica column eluting with applied chromatographic conditions showed that the retention time of Cre and IS was about 1.5 min within the 3.0 min liquid chromatography run time, allowing for a fast turnaround time for serum Cre analysis in routine clinical laboratory.Fig 1shows the representative chromatograms of blank (20% methanol), LLOQ (4.4μmol/L spiked to 20%
methanol), and a patient sample (43.9μmol/L).Fig 2shows the chromatograms of
post-col-umn infusion Cre-d3 (132.7μmol/L in 20% methanol) with syringe pump at 20μL/min via
T-connection to the analytical column with a patient sample. Flat baseline of Cre-d3 indicated no endogenous interference peak at the retention time of Cre and IS in patient sample, suggesting a good selectivity of this method. Moreover, no significant matrix effect and carryover were detected.
Assay result was linear, which ranged from 4.4μmol/L to 885.0μmol/L with an accuracy of
86.3%-104.9% and CV of 0.7%-4.6%. The LLOQ was 4.4μmol/L with an S/N of 921 (panel B in
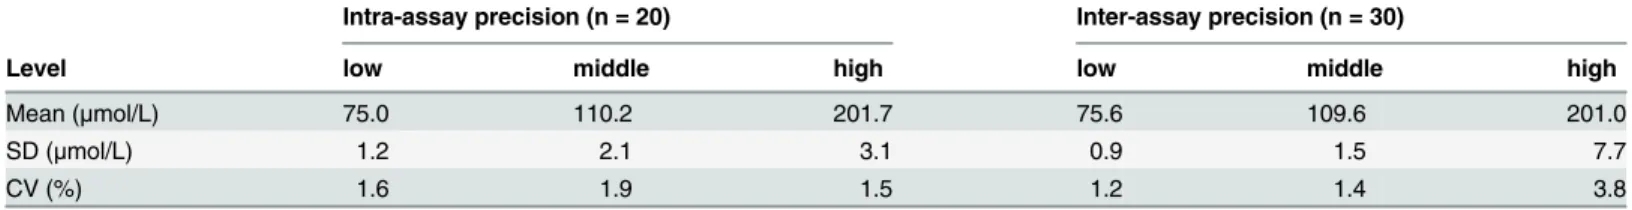
Fig 1). The bias from the NIST SRM 1950 was 1.06% (95% CI: -1.26% to 2.45%). Moreover, we measured the trueness-based EQA proficiency test of the samples (n = 10) provided by the National Center for Clinical Laboratory of China. The bias was 1.89% (95% CI: -1.34% to 3.22%). The intra- and inter-assay precision were<3.8% (Table 1). In the mixing study by using 20% methanol as the blank matrix, the percentage bias from the theoretical value was -2.0% to 3.5%, demonstrating good interchangeability between the candidate matrix and the real serum. No significant interference was observed in lipimic, hemolytic, icteric and uremic serum samples (S1 Fig). The percentage bias was -4.95% to 9.92% between the calculated 50/50 mixture peak area ratio and actual 50/50 mixture peak area ratio.
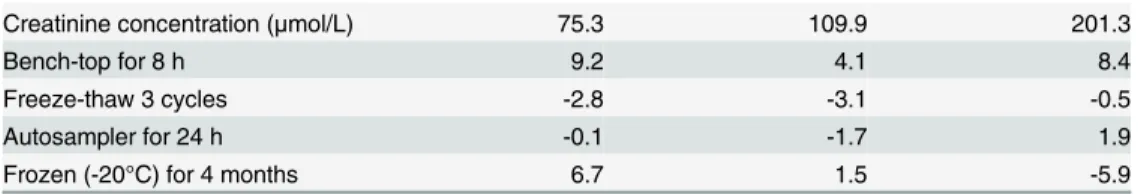
Table 2shows that Cre remained stable on the bench-top for 8 h, with three freeze-thaw cycles, in an autosampler for 24 h, and when frozen for 4 months.
Reference intervals and method comparison
Serum Cre was determined using the validated LC-MS/MS method, and the reference intervals were constructed based on 95% (2.5%-97.5%) CI by using a non-parametric analysis. The refer-ence intervals of serum Cre were 46μmol/L to 101μmol/L for adult men (n = 100), and
41μmol/L to 79μmol/L for adult women (n = 262).
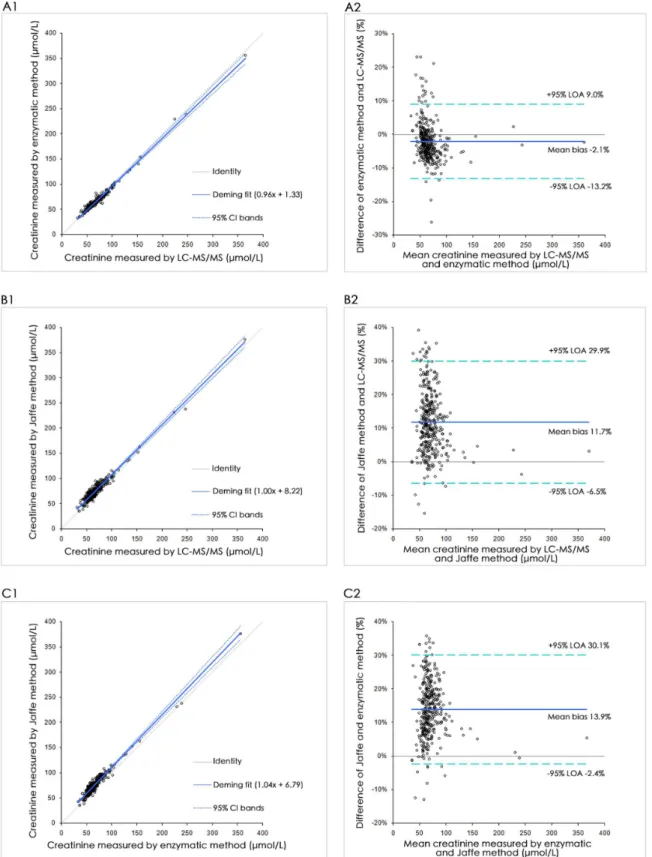
Patient serum samples collected from 100 men and 262 women were split into three ali-quots, and were stored at -20°C until analysis. Serum Cre was measured in a single run using the LC-MS/MS, enzymatic and Jaffe methods. Results were compared by Deming regression and Bland-Altman plot (Fig 3). Enzymatic and Jaffe methods showed a mean proportional dif-ference of -2.1% and 11.7%, respectively, compared with LC-MS/MS. In the Bland-Altman analysis, the 95% limit of agreement ranged from -13.2% to 9.0% for the enzymatic method and from -6.5% to 29.9% for the Jaffe method between the proposed LC-MS/MS assay. Between-method parameters of Bland-Altman mean differences, Deming regression analysis and Pearson's correlation coefficients are presented inS1 Table.
Discussion
We developed a LC-MS/MS method for the quantification of serum Cre in routine clinical application, and an isotope-labeled Cre-d3 was used as IS. This method is simple, fast, accurate, and specific for Cre. Sample preparation requires a one-step protein precipitation using a 50μL sample. We performed chromatographic separation on a Hypersil Silica column, which
is slightly different to other published methods performed on reverse phase [12,15] or ion
Fig 1. Chromatograms of (A) blank (20% methanol), (B) LLOQ (4.4μmol/L, S/N = 921) and (C) a patient sample (43.9μmol/L).
exchange chromatography [13,20]. The retention time of Cre and IS was about 1.5 min within the 3.0 min liquid chromatography run time, thus allowing a high throughput method alterna-tive to routine clinical assay for Cre. As creatinine-free matrix is generally unavailable, we investigated the feasibility to use alternative matrices for the preparation of calibrators. We found 20% methanol is an ideal candidate matrix as it is simple, inexpensive, and more impor-tantly, interchangeable to serum. It was reported by Koster et al. that three different strategies, including calculation the intercept of the calibration, using extremely high concentration cali-bration curve, and using calicali-bration curve prepared with isotope-labeled standard, may also be effective solution to the problem of natural presence of Cre in real samples [21].
Results of the NIST SRM 1950 and trueness-based EQA verified the accuracy of our LC-MS/MS method with average bias of 1.06% and 1.89% respectively. This results indicates
Fig 2. Chromatograms of post-column infusion of Cre-d3 (132.7μmol/L in 20% methanol) with a patient sample.
doi:10.1371/journal.pone.0133912.g002
Table 1. Precision of serum Cre by LC-MS/MS analysis (low level was the pool of patient samples, middle level was 35.4μmol/L Cre spiked in low level, and high level was 132.7μmol/L Cre spiked in low level).
Intra-assay precision (n = 20) Inter-assay precision (n = 30)
Level low middle high low middle high
Mean (μmol/L) 75.0 110.2 201.7 75.6 109.6 201.0
SD (μmol/L) 1.2 2.1 3.1 0.9 1.5 7.7
CV (%) 1.6 1.9 1.5 1.2 1.4 3.8
an excellent comparability to traceable materials. Cre in NIST SRM 1950 was verified using an isotope-dilution liquid chromatography mass spectrometry method approved by the Joint Committee for Traceability in Laboratory Medicine (JCTLM) as a higher-order reference mea-surement procedure [12]. Therefore the NIST SRM 1950 reference value has the highest confi-dence in its accuracy in that all known or suspected sources of bias have been investigated. But we should also note that it is not a weighed-in concentration, and is only provided with associ-ated uncertainties that may be insufficient statistical agreement among various analytical meth-ods. Even the NIST SRM 1950 is plasma-based material, the plasma and serum can be
interchangeable by our method (bias 0.83%, n = 9). Furthermore, we investigated the matrix effect using the post-column infusion approach and the interference from lipimic, hemolytic, icteric, and uremic samples. By using Cre-d3 as the indicator, we can see fromFig 2. The base-line was flat, indicating no significant ion suppression or enhancement at the retention time of Cre in patient sample.
A number of assays are currently employed in routine laboratory analyses that measure Cre. Chemical reaction based Jaffe method and enzyme creatininase based enzymatic method are the most frequently used measurement procedures in clinical laboratories. Jaffe method mea-suring Cre is primarily based on the reaction with alkaline picrate. The Jaffe reaction is not very specific for Cre and many compounds, including protein, bilirubin, glucose, ascorbic acid, ketone, and pyruvate, produce Jaffelike chromogen and hence may interfere the Cre measure-ment results [22–24]. The enzymatic method measures Cre based on the enzyme creatininase catalyzes the conversion of Cre to creatine. Similarly, care should be taken to watch the poten-tial interference caused by ascorbic acid, bilirubin, hemoglobin, and creatine [10,25]. Different methods for Cre measurement demonstrate varying degrees of accuracy and imprecision. Therefore whether results obtained from these methods are comparable or whether laborato-ries employ similar method remain unknown; results of Cre assays were reported to demon-strate considerable variation depending on the reaction mechanism (whether Jaffe or
enzymatic reaction) and manufacturer [10,11,26]. Recently, Fernandez-Fernandez et al. inves-tigated the potential interconversions by using a LC-MS/MS and a GC-MS method. They observed a small but systematic conversion of creatine to creatinine during the sample prepara-tion process and found in most cases, this interconversion reacprepara-tion had no influence in the final Cre results, since the creatine concentration was very small. Only when creatine has simi-lar or even higher level than Cre, then significant bias may occur [27].
Clearly, to produce accurate and interchangeable test results, method standardization or harmonization is crucial to accurately estimate GFR or to evaluate kidney function [28]. In general, access to a reference method or SRM of routine laboratories is limited [13]. Thus, method comparison to a highly specific and accurate method is important. Enzymatic and Jaffe methods are common automated methods used to measure serum Cre. The serum Cre results of these methods were reported to considerably vary [10,29,30]. Jaffe and enzymatic methods are indirect and highly dependent on the reaction mode as well as susceptible to inter-ference by endogenous or exogenous substances [11,31].
Table 2. Stability of Cre under various conditions.Values are expressed as the bias from the initial concentration.
Creatinine concentration (μmol/L) 75.3 109.9 201.3
Bench-top for 8 h 9.2 4.1 8.4
Freeze-thaw 3 cycles -2.8 -3.1 -0.5
Autosampler for 24 h -0.1 -1.7 1.9
Frozen (-20°C) for 4 months 6.7 1.5 -5.9
Fig 3. Method comparison of the serum Cre with (1) Deming regression and (2) Bland-Altman analysis of (A) LC-MS/MS versus enzymatic method, (B) LC-MS/MS versus Jaffe method, and (C) enzymatic method versus Jaffe method.
Method comparison results demonstrated that the enzymatic and Jaffe methods had good correlation (r = 0.990 and 0.971) to our LC-MS/MS method. However, these methods showed bias, with an average of -2.1% for enzymatic method and 11.7% for Jaffe method, from our method (Fig 3). Of the 362 samples analyzed for Cre results, 64/362 (17.7%) for Jaffe method and 4/362 (1.1%) for enzymatic method exhibited a bias beyond 20%. We further investigated the impact of lipemia and hemolysis on the mean difference among LC-MS/MS, enzymatic, and Jaffe methods.Fig 4shows that, both lipemia and hemolysis strongly negatively affected the Cre results. The Jaffe method was more susceptible to interferences than the enzymatic method. Therefore, hyperlipidemia or hemolytic samples should avoid being measured by Jaffe or enzymatic methods. LC-MS/MS method may be a better alternative to such samples. If pos-sible, suspicious data should be verified by the LC-MS/MS method.
Conclusion
We developed a simple, accurate, and specific LC-MS/MS method for serum Cre. The enzy-matic method more comparable to the LC-MS/MS method than the Jaffe method. Lipemia and hemolysis exhibited a strong negative effect on Cre results measured by the enzymatic and Jaffe methods. Hyperlipidemia or hemolysis samples recommend being measured by LC-MS/MS method and avoid being measured by Jaffe or enzymatic methods due to discordance between different methods.
Supporting Information
S1 Fig. Chromatograms of (A) lipimic sample, (B) hemolytic sample, (C) icteric sample and (D) uremic sample.
(TIF)
Fig 4. Effects of lipemia and hemolysis on the mean difference between (A) LC-MS/MS and enzymatic methods, and (B) LC-MS/MS and Jaffe methods.
S1 Table. Parameters between LC-MS/MS, enzymatic and Jaffe methods (Patient serum samples, n = 362).
(DOCX)
Acknowledgments
The authors received funding from Shanghai Xuhui Central Hospital (Grant#: 2012XHXH02) and from Shanghai Xuhui District Commission of Health and Family Planning (Grant#: SHXH201301) for this work.
Author Contributions
Conceived and designed the experiments: SL YS. Performed the experiments: MO YS GL MZ. Analyzed the data: SL MO. Contributed reagents/materials/analysis tools: JJ HZ CY. Wrote the paper: SL MO.
References
1. Stevens LA, Manzi J, Levey AS, Chen J, Deysher AE, Greene T, et al. Impact of creatinine calibration on performance of GFR estimating equations in a pooled individual patient database. American journal of kidney diseases: the official journal of the National Kidney Foundation. 2007; 50(1):21–35. doi:10.
1053/j.ajkd.2007.04.004PMID:17591522.
2. Zuo L, Ma YC, Zhou YH, Wang M, Xu GB, Wang HY. Application of GFR-estimating equations in Chi-nese patients with chronic kidney disease. American journal of kidney diseases: the official journal of the National Kidney Foundation. 2005; 45(3):463–72. doi:10.1053/j.ajkd.2004.11.012PMID:
15754268.
3. Agarwal R. Estimating GFR from serum creatinine concentration: pitfalls of GFR-estimating equations. American journal of kidney diseases: the official journal of the National Kidney Foundation. 2005; 45(3): 610–3. doi:10.1053/j.ajkd.2005.01.010PMID:15754286.
4. Arlet JB, Ribeil JA, Chatellier G, Eladari D, De Seigneux S, Souberbielle JC, et al. Determination of the best method to estimate glomerular filtration rate from serum creatinine in adult patients with sickle cell disease: a prospective observational cohort study. BMC nephrology. 2012; 13:83. doi: 10.1186/1471-2369-13-83PMID:22866669; PubMed Central PMCID: PMC3465224.
5. Bargnoux AS, Simon N, Garrigue V, Dupuy AM, Badiou S, Mourad G, et al. Accuracy of GFR predictive equations using ID-MS traceable creatinine: compensated Jaffe and enzymatic. Clinical laboratory. 2011; 57(5–6):357–61. PMID:21755826.
6. Delanaye P, Cavalier E, Morel J, Mehdi M, Maillard N, Claisse G, et al. Detection of decreased glomeru-lar filtration rate in intensive care units: serum cystatin C versus serum creatinine. BMC nephrology. 2014; 15:9. doi:10.1186/1471-2369-15-9PMID:24410757; PubMed Central PMCID: PMC3893362. 7. Apple F, Bandt C, Prosch A, Erlandson G, Holmstrom V, Scholen J, et al. Creatinine clearance: enzy-matic vs Jaffe determinations of creatinine in plasma and urine. Clinical chemistry. 1986; 32(2):388–90.
PMID:3943207.
8. Boutten A, Bargnoux AS, Carlier MC, Delanaye P, Rozet E, Delatour V, et al. Enzymatic but not com-pensated Jaffe methods reach the desirable specifications of NKDEP at normal levels of creatinine. Results of the French multicentric evaluation. Clinica chimica acta; international journal of clinical chemistry. 2013; 419:132–5. doi:10.1016/j.cca.2013.01.021PMID:23415696.
9. Fillee C, Vranken G, Othmane M, Philippe M, Allaeys JM, Courbe A, et al. Results of the recalibration of creatinine measurement with the modular Beckman Coulter Jaffe creatinine method. Clinical chemistry and laboratory medicine: CCLM / FESCC. 2011; 49(12):1987–99. doi:10.1515/CCLM.2011.674PMID:
21801031.
10. Greenberg N, Roberts WL, Bachmann LM, Wright EC, Dalton RN, Zakowski JJ, et al. Specificity char-acteristics of 7 commercial creatinine measurement procedures by enzymatic and Jaffe method princi-ples. Clinical chemistry. 2012; 58(2):391–401. doi:10.1373/clinchem.2011.172288PMID:22166253.
11. Liu WS, Chung YT, Yang CY, Lin CC, Tsai KH, Yang WC, et al. Serum creatinine determined by Jaffe, enzymatic method, and isotope dilution-liquid chromatography-mass spectrometry in patients under hemodialysis. Journal of clinical laboratory analysis. 2012; 26(3):206–14. doi:10.1002/jcla.21495
12. Dodder NG, Tai SS, Sniegoski LT, Zhang NF, Welch MJ. Certification of creatinine in a human serum reference material by GC-MS and LC-MS. Clinical chemistry. 2007; 53(9):1694–9. doi:10.1373/
clinchem.2007.090027PMID:17660272.
13. Harlan R, Clarke W, Di Bussolo JM, Kozak M, Straseski J, Meany DL. An automated turbulent flow liq-uid chromatography-isotope dilution mass spectrometry (LC-IDMS) method for quantitation of serum creatinine. Clinica chimica acta; international journal of clinical chemistry. 2010; 411(21–22):1728–34.
doi:10.1016/j.cca.2010.07.013PMID:20659439.
14. Owen LJ, Wear JE, Keevil BG. Validation of a liquid chromatography tandem mass spectrometry assay for serum creatinine and comparison with enzymatic and Jaffe methods. Annals of clinical biochemistry. 2006; 43(Pt 2):118–23. doi:10.1258/000456306776021544PMID:16536913.
15. Stokes P, O'Connor G. Development of a liquid chromatography-mass spectrometry method for the high-accuracy determination of creatinine in serum. Journal of chromatography B, Analytical technolo-gies in the biomedical and life sciences. 2003; 794(1):125–36. PMID:12888205.
16. Clinical and Laboratory Standards Institute. CLSI document EP10-A3: Preliminary Evaluation of Quan-titative Clinical Laboratory Measurement Procedures; Approved Guideline-Third Edition. In: Clinical and Laboratory Standards Institute, Wayne, PA; 2006.
17. Clinical and Laboratory Standards Institute. CLSI document EP7-A2: Interference Testing in Clinical Chemistry; Approved Guideline-Second Edition. In: Clinical and Laboratory Standards Institute, Wayne, PA; 2005.
18. Clinical and Laboratory Standards Institute. CLSI document C50-A: Mass spectrometry in the clinical laboratory, general principles and guidance, approved guideline. In: Clinical and Laboratory Standards Institute, Wayne, PA; 2007.
19. The Food and Drug Administration. FDA Guidance for industry: Bioanalytical Method Validation. In: Center for Drug Evaluation and Research, Silver Spring, MD; 2001.
20. Hetu PO, Gingras ME, Vinet B. Development and validation of a rapid liquid chromatography isotope dilution tandem mass spectrometry (LC-IDMS/MS) method for serum creatinine. Clin Biochem. 2010; 43(13–14):1158–62. doi:10.1016/j.clinbiochem.2010.05.018PMID:20553888.
21. Koster RA, Greijdanus B, Alffenaar JW, Touw DJ. Dried blood spot analysis of creatinine with LC-MS/ MS in addition to immunosuppressants analysis. Analytical and bioanalytical chemistry. 2015; 407(6): 1585–94. doi:10.1007/s00216-014-8415-2PMID:25542583.
22. Kaiser T, Kinny-Koster B, Bartels M, Parthaune T, Schmidt M, Thiery J. Impact of different creatinine measurement methods on liver transplant allocation. PloS one. 2014; 9(2):e90015. doi:10.1371/ journal.pone.0090015PMID:24587188; PubMed Central PMCID: PMC3937403.
23. Owen LJ, Keevil BG. Does bilirubin cause interference in Roche creatinine methods? Clinical chemis-try. 2007; 53(2):370–1. doi:10.1373/clinchem.2006.075846PMID:17259257.
24. Shepherd J, Warner MH, Kilpatrick ES. Stability of creatinine with delayed separation of whole blood and implications for eGFR. Annals of clinical biochemistry. 2007; 44(Pt 4):384–7. doi:10.1258/
000456307780945660PMID:17594786.
25. Weber JA, van Zanten AP. Interferences in current methods for measurements of creatinine. Clinical chemistry. 1991; 37(5):695–700. PMID:2032322.
26. Allegaert K, Pauwels S, Smits A, Crevecoeur K, van den Anker J, Mekahli D, et al. Enzymatic isotope dilution mass spectrometry (IDMS) traceable serum creatinine is preferable over Jaffe in neonates and young infants. Clinical chemistry and laboratory medicine: CCLM / FESCC. 2014; 52(6):e107–9. doi:
10.1515/cclm-2013-1035PMID:24399679.
27. Fernandez-Fernandez M, Rodriguez-Gonzalez P, Anon Alvarez ME, Rodriguez F, Menendez FV, Alonso JI. Simultaneous Determination of Creatinine and Creatine in Human Serum by Double-Spike Isotope Dilution Liquid Chromatography-Tandem Mass Spectrometry (LC-MS/MS) and Gas Chromatography-Mass Spectrometry (GC-MS). Analytical chemistry. 2015; 87(7):3755–63. doi:10.
1021/acs.analchem.5b00769PMID:25751287.
28. Carobene A, Ceriotti F, Infusino I, Frusciante E, Panteghini M. Evaluation of the impact of standardiza-tion process on the quality of serum creatinine determinastandardiza-tion in Italian laboratories. Clinica chimica acta; international journal of clinical chemistry. 2014; 427:100–6. doi:10.1016/j.cca.2013.10.001PMID:
24144863.
29. Junge W, Wilke B, Halabi A, Klein G. Determination of reference intervals for serum creatinine, creati-nine excretion and creaticreati-nine clearance with an enzymatic and a modified Jaffe method. Clinica chimica acta; international journal of clinical chemistry. 2004; 344(1–2):137–48. doi:10.1016/j.cccn.2004.02.
007PMID:15149882.