ESSDD
2, 1–25, 2009Overview of the Nordic Seas CARINA
data
A. Olsen et al.
Title Page
Abstract Instruments
Data Provenance & Structure
Tables Figures
◭ ◮
◭ ◮
Back Close
Full Screen / Esc
Printer-friendly Version
Interactive Discussion
Earth Syst. Sci. Data Discuss., 2, 1–25, 2009 www.earth-syst-sci-data-discuss.net/2/1/2009/ © Author(s) 2009. This work is distributed under the Creative Commons Attribution 3.0 License.
Earth System Science Data Discussions
Earth System Science Data Discussionsis the access reviewed discussion forum ofEarth System Science Data
Overview of the Nordic Seas CARINA data
and salinity measurements
A. Olsen1,2, R. M. Key3, E. Jeansson1, E. Falck4, J. Olafsson5, S. van Heuven6,
I. Skjelvan1,4, A. M. Omar1,4, K. A. Olsson2,1, L. G. Anderson2, S. Jutterstr ¨om2,
F. Rey7, T. Johannessen4,1, R. G. J. Bellerby1,4, J. Blindheim7, J. L. Bullister8,
B. Pfeil1, X. Lin3, A. Kozyr9, C. Schirnick10, T. Tanhua10, and D. W. R. Wallace10
1
Bjerknes Centre for Climate Research, UNIFOB AS, Allegaten 55, 5007 Bergen, Norway
2
Department of Chemistry, University of Gothenburg, 41296 G ¨oteborg, Sweden
3
Atmospheric and Oceanic Sciences Program, Princeton Univ., Princeton, NJ 08544, USA
4
Geophysical Institute, University of Bergen, Bergen, Norway
5
Faculty of Earth Sciences, University of Iceland and Marine Research Institute, Reykjavik, Iceland
6
Departement of Ocean Ecosystems, University of Groningen, Groningen, The Nethelands
7
ESSDD
2, 1–25, 2009Overview of the Nordic Seas CARINA
data
A. Olsen et al.
Title Page
Abstract Instruments
Data Provenance & Structure
Tables Figures
◭ ◮
◭ ◮
Back Close
Full Screen / Esc
Printer-friendly Version
Interactive Discussion
8
Pacific Marine Environmental Laboratory/NOAA, 7600 Sand Point Way NE, Seattle, WA 98115-6349, USA
9
Carbon Dioxide Information Analysis Center, Oak Ridge National Laboratory, Oak Ridge, TN 37831, USA
10
Leibniz-Institut for Meereswissenshaften, Marine Biogeochemie, Kiel, Germany
Received: 23 June 2009 – Accepted: 29 June 2009 – Published: 3 July 2009
Correspondence to: A. Olsen ([email protected])
ESSDD
2, 1–25, 2009Overview of the Nordic Seas CARINA
data
A. Olsen et al.
Title Page
Abstract Instruments
Data Provenance & Structure
Tables Figures
◭ ◮
◭ ◮
Back Close
Full Screen / Esc
Printer-friendly Version
Interactive Discussion
Abstract
Water column data of carbon and carbon relevant hydrographic and hydrochemical parameters from 188 previously non-publicly available cruises in the Arctic, Atlantic, and Southern Ocean have been retrieved and merged into a new database: CARINA (CARbon IN the Atlantic). The data have been subject to rigorous quality control (QC)
5
in order to ensure highest possible quality and consistency. The data for most of the parameters included were examined in order to quantify systematic biases in the re-ported values, i.e. secondary quality control. Significant biases have been corrected for in the data products, i.e. the three merged files with measured, calculated and inter-polated values for each of the three CARINA regions; the Arctic Mediterranean Seas
10
(AMS), the Atlantic (ATL) and the Southern Ocean (SO). With the adjustments the CA-RINA database is consistent both internally as well as with GLODAP (Key et al., 2004) and is suitable for accurate assessments of, for example, oceanic carbon inventories and uptake rates and for model validation. The Arctic Mediterranean Seas includes the Arctic Ocean and the Nordic Seas, and the quality control was carried out separately in
15
these two areas. This contribution provides an overview of the CARINA data from the Nordic Seas and summarises the findings of the QC of the salinity data. One cruise had salinity data that were of questionable quality, and these have been removed from the data product. An evaluation of the consistency of the quality controlled salinity data suggests that they are consistent to at least 0.05.
ESSDD
2, 1–25, 2009Overview of the Nordic Seas CARINA
data
A. Olsen et al.
Title Page
Abstract Instruments
Data Provenance & Structure
Tables Figures
◭ ◮
◭ ◮
Back Close
Full Screen / Esc
Printer-friendly Version
Interactive Discussion
Data coverage and parameter measured
Repository-Reference: doi: will be provided by CDIAC upon submission of data Available at: http://cdiac.ornl.gov/oceans/CARINA/Carina inv.html
Coverage: 59.60◦N–82.35◦N, 35.23◦W–28◦E Location Name: Nordic Seas
5
Date/Time Start: 1982-02-28 Date/Time End: 2003-10-13
Data Product Data Product Exchange File Exchange File Units Parameter Name Flag name Parameter Name Flag Name
station STANBR
day DATE
month DATE
year DATE
latitude LATITUDE decimal degrees
longitude LONGITUDE decimal degrees
cruiseno
depth meters
temperature CTDTMP ◦C
salinity sf SALNTY SALNTY FLAG W
ctdsal ctdsf CTDSAL CTDSAL FLAG W
pressure CTDPRS decibars
For a complete list of all parameters available in CARINA see Key et al. (2009). Note the different names for the parameters in the Exchange files (the individual cruise files)
10
ESSDD
2, 1–25, 2009Overview of the Nordic Seas CARINA
data
A. Olsen et al.
Title Page
Abstract Instruments
Data Provenance & Structure
Tables Figures
◭ ◮
◭ ◮
Back Close
Full Screen / Esc
Printer-friendly Version
Interactive Discussion
1 Introduction
CARINA (CARbon In the Atlantic) is a database of carbon and carbon-relevant data from hydrographic cruises in the Arctic, Atlantic and Southern Oceans. The project started as an essentially informal, unfunded project in Delmenhorst, Germany, in 1999 during the workshop on “CO2 in the North Atlantic”, with the main goal to create a
5
uniformly formatted database of carbon relevant variables in the ocean to be used for accurate assessments of oceanic carbon inventories and uptake rates. The collection of data and the quality control (QC) of the data have been a main focus of the CARINA project. Both primary and secondary QC of the data has been performed.
The CARINA database consists of two parts: the first part is the set of the
indi-10
vidual cruise files where all the data reported by the measurement teams are stored. Quality flags are accompanying the data, in many cases those are the flags originally reported, in others they were assigned by R. M. Key. These files are in WHP (WOCE Hydrographic Program) exchange format where the first lines consist of the condensed metadata. There are essentially no calculated or interpolated values in the individual
15
cruise files, with the exceptions of pressure calculated from depth and some bottle salinities that were taken from ctdsal. No adjustments have been applied to any of these values with the exception that all pH measurements were converted to the sea-water pH scale at 25◦C.
The second part of CARINA consists of three merged, quality controlled and adjusted
20
data files; one each for the Atlantic Ocean, Arctic Mediterranean Seas and Southern Ocean regions. These files contain all the CARINA data and also include: 1) interpo-lated values for nutrients, oxygen and salinity if those data were missing and the inter-polation could be made according to certain criteria, as described in Key et al. (2009); 2) calculated carbon parameters; e.g. if total dissolved inorganic carbon (TCO2) and
25
ad-ESSDD
2, 1–25, 2009Overview of the Nordic Seas CARINA
data
A. Olsen et al.
Title Page
Abstract Instruments
Data Provenance & Structure
Tables Figures
◭ ◮
◭ ◮
Back Close
Full Screen / Esc
Printer-friendly Version
Interactive Discussion
ditional parameters in the individual cruise files, which have not been included in the secondary QC, such as∆14C,δ13C and SF6. Most of these are included in the merged data files as well.
This report provides an overview of the Nordic Seas data in CARINA and sum-marises the results of the analysis of the salinity data from this region. These data
5
are part of the Arctic Mediterranean Seas subset of CARINA (CARINA-AMS). This subset includes data from the Nordic Seas and the Arctic Ocean. Because of the very different data coverage in these two areas, and because they are more or less sep-arate, they were analysed separately. The data from the Arctic Ocean are described by J ¨utterstr ¨om et al. (2009), whereas the Nordic Seas data are described here and
10
in Olsen (2009a), Olsen (2009b), Falck and Olsen (2009), Jeansson et al. (2009), and Olafsson and Olsen, (2009). A more comprehensive description of the complete CARINA database can be found in Key et al. (2009), as well as in the other, more specialised, papers in this special issue.
2 Data Provenance and Structure
15
The Transient Tracers in the Ocean-North Atlantic Study (TTO-NAS, Brewer et al., 1986) carried out during summer of 1981 was the first cruise in the Nordic Seas in modern times where carbon chemistry data were collected. TTO-NAS is not officially a part of CARINA, but the data have been used to aid the TCO2 consistency analy-ses (Olsen, 2009a). TTO-NAS was followed by the CSS Hudson cruise of winter 1982
20
(18HU19820228), which is the oldest cruise with data from the Nordic Seas in CA-RINA. This cruise included sampling for TCO2, Total Alkalinity (TA), and chlorofluoro compounds (CFCs), in addition to standard variables like temperature, salinity, nutri-ents, and oxygen. After the CSS Hudson cruise no carbon data were collected in the Nordic Seas until the 1990s. Early that decade two important programs were initiated:
25
ESSDD
2, 1–25, 2009Overview of the Nordic Seas CARINA
data
A. Olsen et al.
Title Page
Abstract Instruments
Data Provenance & Structure
Tables Figures
◭ ◮
◭ ◮
Back Close
Full Screen / Esc
Printer-friendly Version
Interactive Discussion
2005) and (2) The ESOP and CARDEEP projects, funded in 1993 by the European Union and Norwegian Research Council, respectively. The two latter projects included a series of cruises with sampling for carbon chemistry and carbon-relevant data in the Nordic Seas for 3 years. Later, this activity was continued through the EU projects ESOP II and TRACTOR. These data are the backbone of the CARINA Nordic Seas
5
data collection.
The Nordic Seas was loosely defined as the region closed by the Fram Strait to the north, Greenland to the west, the Greenland-Scotland Ridge to the south, and Norway, the Barents Sea Opening, and Spitsbergen to the east. Out of the 188 CA-RINA cruises, 62 are included in the CACA-RINA-AMS, and 35 of these considered as
10
Nordic Seas cruises. Five of these are in common with the Atlantic Ocean subset of CARINA (Tanhua et al., 2009b), in order to ensure consistency between the regions. The positions of the stations of the cruises that were included are shown in Fig. 1 and the cruises are listed in Table 1. Two of the entries in Table 1 are not single cruises, OMEX1NS and Iceland Sea, but rather collections of data from more or less the same
15
place from one (OMEX1NS) or several years (Iceland Sea). The sample distributions with time and latitude are shown in Fig. 2a and b. These figures show only data that have been retained after the secondary quality control was completed and do not in-clude interpolated or calculated values. There are more than twice as many oxygen and nutrient data as TCO2and TA, and there also tends to be more CFC samples. This
20
is because the collection includes the IMR cruises with sampling for oxygen, nutrients and CFCs, but no carbon data. As the 1982 Hudson TCO2and TA data were found to be of too poor quality to be included in the final CARINA product (Olsen 2009a and b), the earliest carbon data are from 1991. Most data were collected in 2002 with the joint Oden/Knorr effort (Olsen et al., 2006; Jeansson et al., 2008; Jutterstr ¨om et al., 2008).
25
The most recent data are from 2003. The latitudinal distribution of the data reflects the emphasis on the Greenland Sea where, in particular, the section across 75◦N has
been occupied repeatedly.
ESSDD
2, 1–25, 2009Overview of the Nordic Seas CARINA
data
A. Olsen et al.
Title Page
Abstract Instruments
Data Provenance & Structure
Tables Figures
◭ ◮
◭ ◮
Back Close
Full Screen / Esc
Printer-friendly Version
Interactive Discussion
typically consist of two characters identifying the country code of the research vessel, followed by the two-character vessel NODC (National Oceanographic Data Center) code. The last eight characters denote the starting date of the cruise (as YYYYMMDD), For instance 58GS20030922 means that this cruise was conducted on the Norwegian (58) ship G. O. Sars (GS) and that the cruise commenced on 22 September 2009. In
5
a few cases the sailing date was unknown and the EXPOCODE was derived from the date of the first station occupied during the cruise. Table 2 lists the codes and names of the ships involved in Nordic Seas CARINA.
The results of the secondary quality control are summarized in Table 1: either 1) the data can be used as they are, 2) the data can be used but we recommend that they are
10
adjusted by the constant or factor given, 3) we do not recommend that these data are used as they appear too be of too poor quality (Flag 3), or 4) no specific recommenda-tion could be given, these have been labelled NC (not considered). The reasoning be-hind each recommendation other than the first, is provided this paper for salinity, Falck and Olsen (2009) for oxygen, Jeansson et al. (2009) for CFCs, Olafsson and Olsen
15
(2009) for nutrients, Olsen (2009a) for TCO2, and Olsen (2008b) for TA. These papers also provide additional information such as names of responsible scientists, complete variable listings, references etc. for the different parameters. The recommendations have been applied to the merged data product, and datums that were found to be questionable or bad have been removed in this, but they are retained with appropriate
20
flags (3 or 4) in the individual cruise files. Occasionally all values of certain parame-ter obtained during a complete cruise was found to be questionable (option 3 above), these data have not necessarily been flagged in the individual cruise files, but have been removed from the data product. As mentioned previously, no adjustments have been applied to the data in the individual cruise files. The recommendations for the
pa-25
ESSDD
2, 1–25, 2009Overview of the Nordic Seas CARINA
data
A. Olsen et al.
Title Page
Abstract Instruments
Data Provenance & Structure
Tables Figures
◭ ◮
◭ ◮
Back Close
Full Screen / Esc
Printer-friendly Version
Interactive Discussion
the CARINA-ATL was consistent with this.
The individual cruise tracks are shown in Fig. 3, along with the salinity profiles after application of our recommendations. Again we note the emphasis on the Greenland Sea, only 7 of the 35 cruises did not have any stations in this area.
3 Analysis approach
5
The quality control was comprised of two distinct steps. First the reported measure-ments were studied in order to identify outliers and obvious errors, i.e. 1st level QC, these analyses are further described in Key et al. (2009). Secondly the consistency of the data were analysed in a processes called secondary QC. These QC procedures were applied on the post-cruise data sets reported by the measurement teams, and
10
are different from the quality assurance (QA) procedures originally carried out by each cruise measurement team in order to ensure sufficient quality as part of the data col-lection and analysis procedures.
Several different consistency analyses were carried out, depending on the variable in question. Each is described in the different papers dealing with the various Nordic Seas
15
data (Falck and Olsen, 2009; Jeansson et al., 2009; Olafsson and Olsen, 2009; Olsen, 2009a, b). However, with a lot of data collected in the central Greenland Sea, the Nordic Seas data were in particular suitable for extensive use of the crossover and inversion approach for evaluating data consistency (Johnson et al., 2001; Tanhua et al., 2009a). Some general issues apply to these analyses and are mentioned here. Firstly, whereas
20
the analysis in most regions evaluates cruise-to-cruise differences in density space (Johnson et al., 2001), depth was used as the ordinate in the Nordic Seas due to the small density gradients in this region. Secondly, only samples deeper than 1900 m were compared to avoid effects of ventilation, which reached depths of 1500 m during the 1990s (Ronski and Bud ´eus, 2005). Thirdly, over the last decade there have been clear
25
ESSDD
2, 1–25, 2009Overview of the Nordic Seas CARINA
data
A. Olsen et al.
Title Page
Abstract Instruments
Data Provenance & Structure
Tables Figures
◭ ◮
◭ ◮
Back Close
Full Screen / Esc
Printer-friendly Version
Interactive Discussion
from the Arctic in this area, and showed up in the crossover results as well (Sect. 4; Falck and Olsen, 2009; Olafsson and Olsen; 2009). The corrections determined by the inversion of the crossover offsets were therefore not blindly applied on the data, but care was exercised so that any natural trends would be retained in the final data product. Finally, both manual and automated crossover analyses (Tanhua et al., 2009a)
5
were carried out on all variables, and the agreement between the approaches were excellent
4 Nordic Seas salinity analyses
In the CARINA database there are two different salinity entries: “salinity” and “ctdsal”, where “salinity” refers to salinity measured in discrete samples of water drawn from the
10
water sampling bottle (e.g. Niskin bottle), whereas “ctdsal” refers to salinity measure-ments derived from the CTD conductivity sensor. It was not possible to unambiguously distinguish between the two for all cruises due to incomplete metadata, and it is almost certain that some ctdsal values have been reported as salinity. During the secondary QC we always used salinity if available, but used cdtsal values if salinity was missing,
15
as indicated by a footnote in Table 1. Note that the typical differences between salin-ity and ctdsal (usually a few parts in ∼35 000) or the differences between corrected and uncorrected salinity (typically less than 10 parts in 35 000) are relatively small, but within the cut-offlimit of 0.005 salinity units for adjustments to salinity. For most geo-chemical measurements that require a correction for salinity (through density), these
20
differences do no have any significant impact on the precision of the reported geo-chemical measurement. Following the salinity QC procedures, the adjustments were either applied to: 1) salinity if the secondary QC was solely based on salinity data; 2) ctdsal if the secondary QC was solely based on ctdsal values; or 3) to both salinity and ctdsal if those values are consistent and the secondary QC was based on both
25
ESSDD
2, 1–25, 2009Overview of the Nordic Seas CARINA
data
A. Olsen et al.
Title Page
Abstract Instruments
Data Provenance & Structure
Tables Figures
◭ ◮
◭ ◮
Back Close
Full Screen / Esc
Printer-friendly Version
Interactive Discussion
4.1 Crossover and inversion analyses
All results and analyses carried out during the secondary QC of the Nordic Seas salin-ity data are available at the CARINA website (http://cdiac.ornl.gov/oceans/CARINA/ Carina inv.html). This section summarises the important findings.
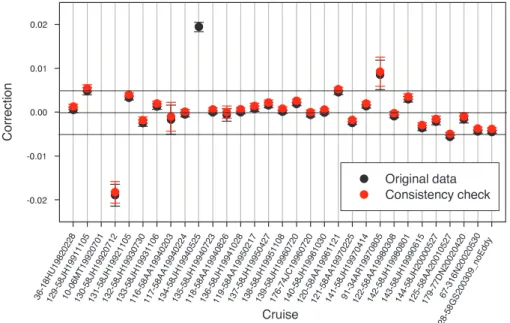
The consistency of the Nordic Seas salinity data was evaluated using the
cnaX-5
scripts (Tanhua et al., 2009a). The salinity data from Iceland Sea (cruiseno. 184), OMEX1NS (cruiseno. 186), 32L919920715 (cruiseno. 78), and 32L919930718 (cruiseno. 79) were not included as there were no samples from deeper than 1900 dbar. These data have been labelled NC in Table 1. Figure 4 shows corrections from a Weighted Least Squares (WLSQ, Johnson et al., 2001; Tanhua et al., 2009a)
inver-10
sion of the cnaX crossover offsets. Additative corrections have been used and positive values indicate that to obtain consistency an upward correction is required, these data are thus low and vice versa for negative values. Three features are noteworthy: (1) There is an overall trend towards higher salinity values, i.e. increasingly negative cor-rections. This is consistent with the aforementioned increasing fraction of deep waters
15
from the Arctic Ocean in this region (Blindheim and Rey, 2004) and should not be cor-rected for. (2) The data from 58JH19920712 appear almost 0.02 too high, those from 58JH19940525 appear almost 0.02 too low, and those from 34AR19970805 appears almost 0.01 too low. These data are thus all more offset than the CARINA wide thresh-old for applying salinity corrections of±0.005 (Tanhua et al., 2009a). Finally, (3) at the
20
start and end there is some noise, but within±0.005 when the temporal trend is taken
into account.
4.2 Recommendations
Given the outcome of the crossover and inversion analysis we believe that the cruises 58JH19920712, 58JH19940525 and 34AR19970805 should be considered for
adjust-25
ESSDD
2, 1–25, 2009Overview of the Nordic Seas CARINA
data
A. Olsen et al.
Title Page
Abstract Instruments
Data Provenance & Structure
Tables Figures
◭ ◮
◭ ◮
Back Close
Full Screen / Esc
Printer-friendly Version
Interactive Discussion
4.2.1 58JH19920712
This cruise took place outside the Greenland Sea, mainly through the Denmark Strait and Iceland – Faeroe Gap (see Fig. 3a). The number of crossovers with other cruises is therefore limited. Given this and given the variability of this region we feel that we do not have enough evidence to recommend that an adjustment should be applied
5
to these data. To signify this, the salinity data of cruise have been labelled NC (Not Considered) in Table 1.
4.2.2 58JH19940525
The inversion of the crossover results indicated that the data were almost 0.02 too low. This cruise covered the northern Norwegian Sea and Greenland Sea, and it had many
10
crossovers with other cruises. Figure 5 compares the salinity data from this cruise with data from the other cruises in the central Greenland Sea and Lofoten Basin. In the Greenland Sea the bottom salinity of 58JH19940525 appears reasonable, but an offset starts appearing at about 3000 dbar and at 2000 dbar salinity appears ∼0.025
lower than what is normally observed. With some variations this difference is retained
15
to the surface. In the Lofoten basin the deepest data are ∼0.015 lower than what is
normally observed. The difference increases moving towards shallower depths, and at 2000 dbar the data are around 0.03 lower than normal. None of the other data obtained at this cruise suggested that an exceptional hydrographic phenomenon was taking place in either of these two basins. We therefore attribute these features to deficiencies
20
ESSDD
2, 1–25, 2009Overview of the Nordic Seas CARINA
data
A. Olsen et al.
Title Page
Abstract Instruments
Data Provenance & Structure
Tables Figures
◭ ◮
◭ ◮
Back Close
Full Screen / Esc
Printer-friendly Version
Interactive Discussion
4.2.3 34AR19970805
The crossover and inversion analysis indicated that the salinity data from this cruise were almost 0.01 too low. The cruise took place across the Nordic Seas – North Atlantic overflow regions (Fig. 3a) and given the variability here there is a chance that the offset has a natural rather than instrumental cause, and we have chosen to label
5
the salinity data from this cruise NC in Table 1. This is consistent with the decision for the 58JH19920712 salinity data.
4.2.4 58JH19940723
The correction determined by the inversion was smaller that the threshold of
±0.005. However, the cruise took place in the same region as 58JH19920712 and
10
34AR19970805, and for consistency we have chosen to label the salinity data NC in Table 1.
4.3 Consistency of final Nordic Seas salinity data
In order to evaluate the consistency of the final Nordic Seas salinity data, a cnaX crossover analysis was carried out after the recommendations were implemented. The
15
corrections determined through the WLSQ inversion of the crossover offsets are shown in Fig. 4. With a few exceptions the data are consistent to within±0.005. The most
notable are 58JH19920712 and 34AR19970414 which both took place in the overflow regions and therefore have been labelled NC. Otherwise there appears to be a slight trend in the data, with newer cruises having higher salinities than the older (i.e. newer
20
cruises needing negative adjustments), consistent with the observations of Blindheim and Rey (2004). Both 58JH19911105 and 58AA20010527 falls just outside the±0.005
ESSDD
2, 1–25, 2009Overview of the Nordic Seas CARINA
data
A. Olsen et al.
Title Page
Abstract Instruments
Data Provenance & Structure
Tables Figures
◭ ◮
◭ ◮
Back Close
Full Screen / Esc
Printer-friendly Version
Interactive Discussion
5 Data access
The whole CARINA database is published at http://cdiac.ornl.gov/oceans/CARINA/ Carina inv.html. It contains 188 individual cruise files in comma-separated, WHP ex-change format. Condensed metadata is contained in the header of each data file. In addition, the CARINA database contains the three merged comma-separated data files
5
with the data products. These files are divided into the three geographical regions of CARINA. The Nordic Seas data presented here are part of the Arctic Mediterranean Seas collection. No special software is needed to access the data, but software for Matlab users is offered to facilitate reading of the data.
Acknowledgements. This work was carried out with support from the Norwegian Research 10
Council through A-CARB (188167) and CARBON-HEAT (185093), and from EU IP CAR-BOOCEAN (511176). Additional support from the International Ocean Carbon Coordination Project (IOCCP) and the Hanse Institute for Advanced Study (HWK, Delmenhorst, Germany have been greatly appreciated. Additional support as follows, for R. M. Key, NOAA grant
NA08OAR4320752 and NA0OAR4310820; J. L. Bullister, NOAA Climate Program Office.
With-15
ESSDD
2, 1–25, 2009Overview of the Nordic Seas CARINA
data
A. Olsen et al.
Title Page
Abstract Instruments
Data Provenance & Structure
Tables Figures
◭ ◮
◭ ◮
Back Close
Full Screen / Esc
Printer-friendly Version
Interactive Discussion
References
Blindheim, J. and Rey, F.: Water-mass formation and distribution in the Nordic Seas during the 1990s, ICES J. Mar. Sci., 61, 846–863, 2004.
Brewer, P. G., Takahashi, T., and Williams, R. T.: Transient tracers in the ocean – Hydrography data and carbon dioxide systems with revised carbon chemistry data, NDP-004/R41, Car-5
bon Dioxide Information Analysis Center, Oak Ridge National Laboratory, Oak Ridge, Tenn., USA, 1986.
B ¨onisch, G., Blindheim, J., Bullister, J. L., Schlosser, P., and Wallace, D. W. R.: Long-term trends of temperature, salinity, density and transient tracers in the Greenland Sea, J. Geo-phys. Res, 102, 18553–18571, 1997.
10
Falck, E. and Olsen, A.: Nordic Seas oxygen data in CARINA, Earth Syst. Sci. Data Discuss., in preparation, 2009.
Jeansson, E., Olsson, K. A., Tanhua, T., and Bullister, J. L.: Nordic Seas and Arctic Ocean CFC Data in CARINA, Earth Syst. Sci. Data Discuss., in preparation, 2009.
Jeansson, E., Jutterstr ¨om, S., Rudels, B., Anderson, L. G., Olsson, K. A., Jones, E. P., Smethie 15
Jr., W. M., and Swift, J. H.: Sources to the East Greenland Current and its contribution to the Denmark Strait overflow, Prog. Oceanogr., 78, 12–28, 2008
Johnson, G. C., Robbins, P. E., and Hufford, G. E.: Systematic adjustments of hydrographic sections for internal consistency, J. Atmos. Ocean. Tech., 18, 1234–1244, 2001.
Jutterstr ¨om, S., Anderson, L. G., Bates, N. R., Bellerby, R., Johannessen, T., Jones, E. P., Key, 20
R. M., Lin, X., Olsen, A., and Omar, A. M.: Arctic Ocean data in CARINA, Earth Syst. Sci. Data Discuss., in press, 2009.
Jutterstr ¨om, S., Jeansson, E., Anderson, L. G., Bellerby, R., Jones, E. P., Smethie Jr., W. M., and Swift, J.: Evaluation of anthropogenic carbon in the Nordic Seas using observed relationships of N, P and C versus CFCs, Prog. Oceanogr., 78, 78–84, 2008.
25
Kasajima, Y., Olsson, K. A., Johannessen, T., Messias, M.-J., Jeansson, E., Bellerby, R. G. J., and Skjelvan, I.: A submesoscale coherent eddy in the Greenland Sea in 2003, J. Geophys. Res., 111, C07013, doi:10.1029/2005JC003130, 2006.
Karstensen, J., Schlosser, P., Wallace, D. W. R., Bullister, J., and Blindheim, J.: Water mass transformation in the Greenland Sea during the 1990s, J. Geophys. Res., 110, C07022, 30
doi:10.1029/2004JC002510, 2005.
ESSDD
2, 1–25, 2009Overview of the Nordic Seas CARINA
data
A. Olsen et al.
Title Page
Abstract Instruments
Data Provenance & Structure
Tables Figures
◭ ◮
◭ ◮
Back Close
Full Screen / Esc
Printer-friendly Version
Interactive Discussion F., Mordy, C., and Peng, T.-H., Results from the Global Data Analysis Project (GLODAP),
Global. Biogeochem. Cy., 18, GB4031, doi:10.1029/2004GB002247, 2004.
Key, R. M. Tanhua, T., Olsen, A., Hoppema, M., Jutterstr ¨om, S., Schirnick, C., van Heuven, S., Lin. X., Wallace, D. W. R., and Mintrop, L.: The CARINA data synthesis project: Introduction and overview, Earth Syst. Sci. Data Discuss., in preparation, 2009.
5
Olafsson, J. and Olsen, A.: Nordic Seas nutrients data in CARINA, Earth Syst. Sci. Data Dis-cuss., in preparation, 2009.
Olsen, A.: Nordic Seas total inorganic carbon data in CARINA, Earth Syst. Sci. Data Discuss., submitted, 2009a.
Olsen, A.: Nordic Seas total alkalinity data in CARINA, Earth Syst. Sci. Data Discuss., in 10
preparation, 2009b.
Olsen, A., Omar, A. M., Bellerby, R. G. J., Johannessen, T., Ninnemann, U., Brown, K. R., Olsson, K. A., Olafsson, J., Nondal, G., Kivim ¨ae, C., Kringstad, S., Neill, C., and Olafsdottir,
S.: Magnitude and origin of the anthropogenic CO2 increase and
13
C Suess effect in the Nordic seas since 1981, Global Biogeochem. Cy., 20, GB3027, doi:10.1029/2005GB002669, 15
2006.
Ronski, S. and Bud ´eus, G.: Time series of winter convection in the Greenland Sea, J. Geophys. Res., 110, C04015, doi:10.1029/2004JC002318, 2005.
Tanhua, T., van Heuven, S., Key, R.M, A. Velo, Olsen, A., and Schirnick, C.: Quality controll procedures and methods used for the CARINA data set, Earth Syst. Sci. Data Discuss., 20
submitted, 2009a.
Tanhua, T., Steinfeldt, R., Key, R. M., Brown, P., Gruber, N., Wanninkhof, R., Perez, F., K ¨ortzinger, A., Velo, A., Schuster, U., van Heuven, S., Bullister, J. L., Stendardo, I., Hoppema, M., Olsen, A., Kozyr, A., Pierrot, D., Schirnick, C., and Wallace, D. W. R.: Overview of the Atlantic Ocean CARINA data and salinity measurements, Earth Syst. Sci. Data Discuss., 25
submitted, 2009b.
ESSDD
2, 1–25, 2009Overview of the Nordic Seas CARINA
data
A. Olsen et al.
Title Page
Abstract Instruments
Data Provenance & Structure
Tables Figures
◭ ◮
◭ ◮
Back Close
Full Screen / Esc
Printer-friendly Version
Interactive Discussion
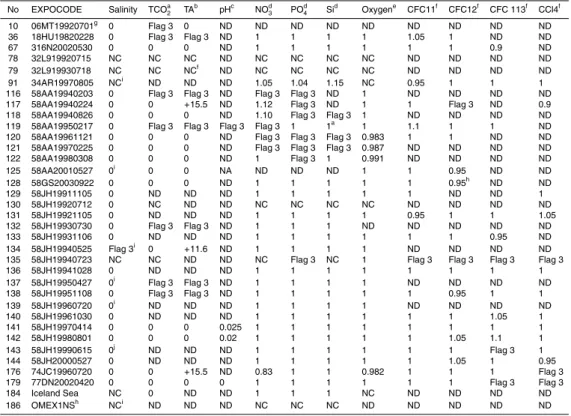
Table 1. CARINA cruises with data from the Nordic Seas. The table lists CARINA cruiseno.,
EXPOCODE, and recommendations from the secondary quality control. Adjustments for
salin-ity, TCO2and TA are additive, whereas those for oxygen, nutrients, and CFCs are multiplicative.
ND denotes “no data”, i.e. the parameter was not measured, and NC, denotes “not considered”, and were applied to data with limited possibilities for secondary QC due to special regions (e.g. polynyas, shelf regions) for instance, or no values from deeper than 1900 dbar, or as de-scribed in the texts. Flag 3 means that the data are of questionable quality, and these are not included in the merged data product.
No EXPOCODE Salinity TCOa2 TA b
pHc NOd3 PO d 4 Si
d
Oxygene CFC11f CFC12f CFC 113f CCl4f 10 06MT19920701g 0 Flag 3 0 ND ND ND ND ND ND ND ND ND
36 18HU19820228 0 Flag 3 Flag 3 ND 1 1 1 1 1.05 1 ND ND 67 316N20020530 0 0 0 ND 1 1 1 1 1 1 0.9 ND 78 32L919920715 NC NC NC ND NC NC NC NC ND ND ND ND 79 32L919930718 NC NC NCf ND NC NC NC NC ND ND ND ND 91 34AR19970805 NCi ND ND ND 1.05 1.04 1.15 NC 0.95 1 1 1
116 58AA19940203 0 Flag 3 Flag 3 ND Flag 3 Flag 3 ND 1 ND ND ND ND 117 58AA19940224 0 0 +15.5 ND 1.12 Flag 3 ND 1 1 Flag 3 ND 0.9 118 58AA19940826 0 0 0 ND 1.10 Flag 3 Flag 3 1 ND ND ND ND 119 58AA19950217 0 Flag 3 Flag 3 Flag 3 Flag 3 1 1a 1 1.1 1 1 ND 120 58AA19961121 0 0 0 ND Flag 3 Flag 3 Flag 3 0.983 1 1 ND ND 121 58AA19970225 0 0 0 ND Flag 3 Flag 3 Flag 3 0.987 ND ND ND ND 122 58AA19980308 0 0 0 ND 1 Flag 3 1 0.991 ND ND ND ND 125 58AA20010527 0i 0 0 NA ND ND ND 1 1 0.95 ND ND
128 58GS20030922 0 0 0 ND 1 1 1 1 1 0.95h ND ND
129 58JH19911105 0 ND ND ND 1 1 1 1 1 ND ND 1 130 58JH19920712 0 NC ND ND NC NC NC NC ND ND ND ND 131 58JH19921105 0 ND ND ND 1 1 1 1 0.95 1 1 1.05 132 58JH19930730 0 Flag 3 Flag 3 ND 1 1 1 ND ND ND ND ND 133 58JH19931106 0 ND ND ND 1 1 1 1 1 1 0.95 ND 134 58JH19940525 Flag 3i 0
+11.6 ND 1 1 1 1 ND ND ND ND
135 58JH19940723 NC NC ND ND NC Flag 3 NC 1 Flag 3 Flag 3 Flag 3 Flag 3 136 58JH19941028 0 ND ND ND 1 1 1 1 1 1 1 1 137 58JH19950427 0i Flag 3 Flag 3 ND 1 1 1 1 ND ND ND ND
138 58JH19951108 0 Flag 3 Flag 3 ND 1 1 1 1 1 0.95 1 1 139 58JH19960720 0i ND ND ND 1 1 1 1 ND ND ND ND
ESSDD
2, 1–25, 2009Overview of the Nordic Seas CARINA
data
A. Olsen et al.
Title Page
Abstract Instruments
Data Provenance & Structure
Tables Figures
◭ ◮
◭ ◮
Back Close
Full Screen / Esc
Printer-friendly Version
Interactive Discussion
Table 1.Continued.
a
Secondary quality control described by Olsen (2009a), adjustments are additative (µmol kg−1
).
b
Secondary quality controll described by Olsen (2009b), adjustments are additative (µmol kg−1
).
c
Secondary quality control described by Velo et al. (2009), adjustments are additative.
dSecondary quality control described by Olafsson and Olsen (2009), adjustments are multiplicative.
e
Secondary quality control described by Falck and Olsen (2009), adjustments are multiplicative.
f
Secondary quality control described by Jeansson et al. (2009), adjustments are multiplicative.
gThis cruise was the 5th and 6th leg of the MT21 cruise, only leg 5 data were included in our analyses.
h
These data were included after secondary QC was completed, regardless they were collected on the Norwegian Shelf and there were limited possibilities for secondary QC.
i
Only ctdsal values in file, QC carried out on these.
j
Systematic offset(s) in bottle salinity due to long storage time prior to analysis, All bottle values flagged 3 and
ESSDD
2, 1–25, 2009Overview of the Nordic Seas CARINA
data
A. Olsen et al.
Title Page
Abstract Instruments
Data Provenance & Structure
Tables Figures
◭ ◮
◭ ◮
Back Close
Full Screen / Esc
Printer-friendly Version
Interactive Discussion
Table 2.List of ships included in the CARINA data from the Nordic Seas. Vessels with * were
included in the entry “Iceland Sea”, and the vessel with ** was included in the “OMEX1NS” entry.
NODC Ship Code Ship name Country
06MT Meteor Germany
18HU Hudson Canada
316N Knorr USA
46FR Arni Fridrikson* Iceland
58AA H ˚akon Mosby Norway
58JH Johan Hjort Norway
58JM Jan Mayen** Norway
58GS G. O. Sars Norway
ESSDD
2, 1–25, 2009Overview of the Nordic Seas CARINA
data
A. Olsen et al.
Title Page
Abstract Instruments
Data Provenance & Structure
Tables Figures
◭ ◮
◭ ◮
Back Close
Full Screen / Esc
Printer-friendly Version
Interactive Discussion
45
o
W
30o
W
15o
W 0o
15
oE
30 oE
60
o
N 65
o
N 70
o
N 75
o
N 80
o
N 85
o
N
ESSDD
2, 1–25, 2009Overview of the Nordic Seas CARINA
data
A. Olsen et al.
Title Page
Abstract Instruments
Data Provenance & Structure
Tables Figures
◭ ◮
◭ ◮
Back Close
Full Screen / Esc
Printer-friendly Version
Interactive Discussion
1982 1991 1992 1993 1994 1995 1996 1997 1998 1999 2000 2001 2002 2003 0
1000 2000 3000 4000 5000 6000
Year
Number of Samples
oxygen nutrients TCO2 TA CFCs
a
60 65 70 75 80
0 2000 4000 6000 8000 10000 12000 14000
Latitude, oN
Number of Samples
oxygen nutrients TCO2 TA CFCs
b
Fig. 2.Data distribution of Nordic Seas CARINA data, number of samples by(a)year and(b)
ESSDD
2, 1–25, 2009Overview of the Nordic Seas CARINA
data
A. Olsen et al.
Title Page
Abstract Instruments
Data Provenance & Structure
Tables Figures
◭ ◮
◭ ◮
Back Close
Full Screen / Esc
Printer-friendly Version Interactive Discussion 0 1000 2000 3000 P (dbar) 06MT19920701
Cruise no. 10
18HU19820228 Cruise no. 36
0 1000 2000 3000 P (dbar) 316N20020530
Cruise no. 67
32L919920715 Cruise no. 78
0 1000 2000 3000 P (dbar) 32L919930718
Cruise no. 79
34AR19970805 Cruise no. 91
0 1000 2000 3000 P (dbar) 58AA19940203
Cruise no. 116
58AA19940224 Cruise no. 117
0 1000 2000 3000 P (dbar) 58AA19940826
Cruise no. 118
58AA19950217 Cruise no. 119
0 1000 2000 3000 P (dbar) 58AA19961121
Cruise no. 120
58AA19970225 Cruise no. 121
0 1000 2000 3000 P (dbar) 58AA19980308
Cruise no. 122
58AA20010527 Cruise no. 125
0 1000 2000 3000 P (dbar) 58GS20030922
Cruise no. 128
58JH19911105 Cruise no. 129
34.8 34.9 35 35.1 35.2 0 1000 2000 3000 Salinity P (dbar) 58JH19920712
Cruise no. 130
34.8 34.9 35 35.1 35.2 Salinity
58JH19921105 Cruise no. 131
Fig. 3.Salinity profiles and station locations for the Nordic Seas CARINA data. All data in
ESSDD
2, 1–25, 2009Overview of the Nordic Seas CARINA
data
A. Olsen et al.
Title Page
Abstract Instruments
Data Provenance & Structure
Tables Figures
◭ ◮
◭ ◮
Back Close
Full Screen / Esc
Printer-friendly Version
Interactive Discussion 0
1000
2000
3000
P
(dbar) 58JH19930730
Cruise no. 132
58JH19931106 Cruise no. 133
0
1000
2000
3000
P
(dbar) 58JH19940525
Cruise no. 134
58JH19940723 Cruise no. 135
0
1000
2000
3000
P
(dbar) 58JH19941028
Cruise no. 136
58JH19950427 Cruise no. 137
0
1000
2000
3000
P
(dbar) 58JH19951108
Cruise no. 138
58JH19960720 Cruise no. 139
0
1000
2000
3000
P
(dbar) 58JH19961030
Cruise no. 140
58JH19970414 Cruise no. 141
0
1000
2000
3000
P
(dbar) 58JH19980801
Cruise no. 142
58JH19990615 Cruise no. 143
0
1000
2000
3000
P
(dbar) 58JH20000527
Cruise no. 144
74JC19960720 Cruise no. 176
0
1000
2000
3000
P
(dbar) 77DN20020420
Cruise no. 179
34.8 34.9 35 35.1 35.2 Salinity
IcelandSea Cruise no. 184
34.8 34.9 35 35.1 35.2 0
1000
2000
3000
Salinity
P
(dbar) OMEX1NS
Cruise no. 186
ESSDD
2, 1–25, 2009Overview of the Nordic Seas CARINA
data
A. Olsen et al.
Title Page
Abstract Instruments
Data Provenance & Structure
Tables Figures
◭ ◮
◭ ◮
Back Close
Full Screen / Esc
Printer-friendly Version Interactive Discussion ✁ ✂✄☎ ✆ ✝ ✞✟ ✠ ✡ ☛ ☞ ✠ ✌ ✡ ✍ ✎ ✍ ✍ ✡ ✠ ✍ ✌✟ ✏ ✡ ✑ ☛ ✠ ✌ ✌ ✠ ✠ ✠ ✎ ✏ ✠ ✎✟ ✎ ✞ ✒ ✓ ✠ ✌ ✌ ✍ ✎ ✔ ✎ ✠ ✠ ✝ ✎✟ ✏ ✡ ✑ ☛ ✠ ✌ ✌ ✍ ✎ ✔ ✠ ✍ ✠ ✝ ✠✟ ✏ ✡ ✑ ☛ ✠ ✌ ✌ ✍ ✠ ✠ ✎ ✏ ✠ ✝ ✍✟ ✏ ✡ ✑ ☛ ✠ ✌ ✌ ✝ ✎ ✔ ✝ ✎ ✠ ✝ ✝✟ ✏ ✡✑ ☛ ✠ ✌ ✌ ✝ ✠ ✠ ✎ ✞ ✠ ✠ ✞✟ ✏ ✡ ✕ ✕ ✠ ✌ ✌ ✖ ✎ ✍ ✎ ✝ ✠ ✠ ✔ ✟ ✏ ✡✕ ✕ ✠ ✌ ✌ ✖ ✎ ✍ ✍ ✖ ✠ ✝ ✖✟ ✏ ✡✑ ☛ ✠ ✌ ✌ ✖ ✎ ✏ ✍ ✏ ✠ ✝ ✏✟ ✏ ✡✑ ☛ ✠ ✌ ✌ ✖ ✎ ✔ ✍ ✝ ✠ ✠ ✡✟ ✏ ✡✕ ✕ ✠ ✌ ✌ ✖ ✎ ✡ ✍ ✞ ✠ ✝ ✞✟ ✏ ✡ ✑ ☛ ✠ ✌ ✌ ✖ ✠ ✎ ✍ ✡ ✠ ✠ ✌✟ ✏ ✡✕ ✕ ✠ ✌ ✌ ✏ ✎ ✍ ✠ ✔ ✠ ✝ ✔ ✟ ✏ ✡✑ ☛ ✠ ✌ ✌ ✏ ✎ ✖ ✍ ✔ ✠ ✝ ✡✟ ✏ ✡✑ ☛ ✠ ✌ ✌ ✏ ✠ ✠ ✎ ✡ ✠ ✝ ✌✟ ✏ ✡✑ ☛ ✠ ✌ ✌ ✞ ✎ ✔ ✍ ✎ ✠ ✔ ✞✟ ✔ ✖ ✑ ✗ ✠ ✌ ✌ ✞ ✎ ✔ ✍ ✎ ✠ ✖ ✎✟ ✏ ✡✑ ☛ ✠ ✌ ✌ ✞ ✠ ✎ ✝ ✎ ✠ ✍ ✎✟ ✏ ✡✕ ✕ ✠ ✌ ✌ ✞ ✠ ✠ ✍ ✠ ✠ ✍ ✠✟ ✏ ✡ ✕ ✕ ✠ ✌ ✌ ✔ ✎ ✍ ✍ ✏ ✠ ✖ ✠✟ ✏ ✡ ✑ ☛ ✠ ✌ ✌ ✔ ✎ ✖ ✠ ✖ ✌ ✠✟ ✝ ✖✕ ✘ ✠ ✌ ✌ ✔ ✎ ✡ ✎ ✏ ✠ ✍ ✍✟ ✏ ✡✕ ✕ ✠ ✌ ✌ ✡ ✎ ✝ ✎ ✡ ✠ ✖ ✍✟ ✏ ✡✑ ☛ ✠ ✌ ✌ ✡ ✎ ✡ ✎ ✠ ✠ ✖ ✝✟ ✏ ✡✑ ☛ ✠ ✌ ✌ ✌ ✎ ✞ ✠ ✏ ✠ ✖ ✖✟ ✏ ✡✑ ☛ ✍ ✎ ✎ ✎ ✎ ✏ ✍ ✔ ✠ ✍ ✏ ✟ ✏ ✡✕ ✕ ✍ ✎ ✎ ✠ ✎ ✏ ✍ ✔ ✠ ✔ ✌✟ ✔ ✔ ✙ ✚ ✍ ✎ ✎ ✍ ✎ ✖ ✍ ✎ ✞ ✔ ✟ ✝ ✠ ✞ ✚ ✍ ✎ ✎ ✍ ✎ ✏ ✝ ✎ ✠ ✍ ✡✟ ✏ ✡ ✛ ✜ ✍ ✎ ✎ ✝ ✎ ✌✢ ✣✤ ✥✦ ✦ ✧ ★✩✪ ✪ ✫✬ ✭✮ ✩ ✯ ✰ ✱ ✲✱ ✳ ✰ ✱ ✲✱ ✴ ✱✲ ✱✱ ✱✲ ✱✴ ✱✲ ✱✳ ✵✁ ✄✶✄ ✷✸✹✺ ✸ ✻ ✸ ✼✷☎✄☎ ✻ ✆✷✽ ✾✽✿✆✽ ❀
Fig. 4. Salinity corrections and their uncertainties from WLSQ inversion of cnaX crossover
ESSDD
2, 1–25, 2009Overview of the Nordic Seas CARINA
data
A. Olsen et al.
Title Page
Abstract Instruments
Data Provenance & Structure
Tables Figures
◭ ◮
◭ ◮
Back Close
Full Screen / Esc
Printer-friendly Version
Interactive Discussion
34.8 34.85 34.9 34.95
0
500
1000
1500
2000
2500
3000
3500
4000
pressure(dbar)
all
134−58JH19940525
8o W
0o
8oE 16oE 24oE
72o N 73o N 74oN
75o N 76o N 77oN
78o N
34.8 34.85 34.9 34.95
0
500
1000
1500
2000
2500
3000
3500
pressure (dbar)
salinity
all
134−58JH19940525
8o W 0o
8oE 16oE 24oE
60o N 64oN
68oN 72oN
76oN
Fig. 5. Salinity profiles from (upper) Central Greenland Sea (74.5–75.5◦N, 2◦W–2◦E) and
(lower) Lofoten Basin (69.5◦N–71◦N, 2–6◦E) obtained at the 58JH19940525 cruise, compared
to the other data in the same area. Note that scale has been customised to resolve deep ocean