www.earth-syst-sci-data.net/1/25/2009/
©Author(s) 2009. This work is distributed under the Creative Commons Attribution 3.0 License.
Earth System
Science Data
Overview of the Nordic Seas CARINA data
and salinity measurements
A. Olsen1,2, R. M. Key3, E. Jeansson1, E. Falck4, J. Olafsson5, S. van Heuven6, I. Skjelvan1,4, A. M. Omar1,4, K. A. Olsson2,1, L. G. Anderson2, S. Jutterstr¨om2, F. Rey7, T. Johannessen4,1, R. G. J. Bellerby1,4, J. Blindheim7, J. L. Bullister8, B. Pfeil1, X. Lin3, A. Kozyr9, C. Schirnick10,
T. Tanhua10, and D. W. R. Wallace10
1Bjerknes Centre for Climate Research, UNIFOB AS, Allegaten 55, 5007 Bergen, Norway 2Department of Chemistry, University of Gothenburg, 41296 G¨oteborg, Sweden 3Atmospheric and Oceanic Sciences Program, Princeton University, Princeton, NJ 08544, USA
4Geophysical Institute, University of Bergen, Bergen, Norway
5Faculty of Earth Sciences, University of Iceland and Marine Research Institute, Reykjavik, Iceland 6Departement of Ocean Ecosystems, University of Groningen, Groningen, The Netherlands
7Institute of Marine Research, Bergen, Norway
8Pacific Marine Environmental Laboratory/NOAA, 7600 Sand Point Way NE, Seattle, WA 98115-6349, USA 9Carbon Dioxide Information Analysis Center, Oak Ridge National Laboratory, Oak Ridge, TN 37831, USA
10Leibniz-Institut f¨ur Meereswissenshaften, Marine Biogeochemie, Kiel, Germany
Received: 23 June 2009 – Published in Earth Syst. Sci. Data Discuss.: 3 July 2009 Revised: 4 November 2009 – Accepted: 6 November 2009 – Published: 19 November 2009
Abstract. Water column data of carbon and carbon relevant hydrographic and hydrochemical parameters from 188 previously non-publicly available cruises in the Arctic, Atlantic, and Southern Ocean have been retrieved and merged into a new database: CARINA (CARbon IN the Atlantic). The data have been subject to rigorous quality control (QC) in order to ensure highest possible quality and consistency. The data for most of the parameters included were examined in order to quantify systematic biases in the reported values, i.e. secondary quality control. Significant biases have been corrected for in the data products, i.e. the three merged files with measured, calculated and interpolated values for each of the three CARINA regions; the Arctic Mediterranean Seas (AMS), the Atlantic (ATL) and the Southern Ocean (SO). With the adjustments the CARINA database is consistent both internally as well as with GLODAP (Key et al., 2004) and is suitable for accurate assessments of, for example, oceanic carbon inventories and uptake rates and for model validation. The Arctic Mediterranean Seas include the Arctic Ocean and the Nordic Seas, and the quality control was carried out separately in these two areas. This contribution provides an overview of the CARINA data from the Nordic Seas and summarises the findings of the QC of the salinity data. One cruise had salinity data that were of questionable quality, and these have been removed from the data product. An evaluation of the consistency of the quality controlled salinity data suggests that they are consistent to at least±0.005.
Data coverage and parameter measured
Repository-Reference:
doi:10.3334/CDIAC/otg.CARINA.AMS.V1.2 Available at:
http://cdiac.ornl.gov/oceans/CARINA/Carina inv.html
Correspondence to:A. Olsen
Coverage: 59.60◦N–82.35◦N, 35.23◦W–28◦E Location Name: Nordic Seas
Data Product Parameter Name
Data Product Flag Name
Exchange File Parameter Name
Exchange File Flag Name
station STANBR
day DATE
month DATE
year DATE
latitude LATITUDE decimal degrees
longitude LONGITUDE decimal degrees
cruiseno
depth meters
temperature CTDTMP ◦C
salinity sf SALNTY SALNTY FLAG W
ctdsal ctdsf CTDSAL CTDSAL FLAG W
pressure CTDPRS decibars
For a complete list of all parameters available in CARINA see Key et al. (2009). Note the different names for the parameters in the Exchange files (the individual cruise files) and the merged data product.
1 Introduction
CARINA (CARbon IN the Atlantic) is a database of carbon and carbon-relevant data from hydrographic cruises in the Arctic, Atlantic and Southern oceans. The project started as an essentially informal, unfunded project in Delmenhorst, Germany, in 1999 during the workshop on “CO2in the North Atlantic”, with the main goal to create a uniformly formatted database of carbon relevant variables in the ocean to be used for accurate assessments of oceanic carbon inventories and uptake rates. The collection of data and the quality control (QC) of the data have been a main focus of the CARINA project. Both primary and secondary QC of the data has been performed.
The CARINA database consists of two parts: the first part is the set of the individual cruise files where all the data reported by the measurement teams are stored. Qual-ity flags are accompanying the data, in many cases these are the flags originally reported, in others they were assigned by R. M. Key. These files are in WHP (WOCE Hydrographic Program) exchange format where the first lines consist of the condensed metadata. There are essentially no calculated or interpolated values in the individual cruise files, with the ex-ceptions of pressure calculated from depth and some bottle salinities that were taken from ctdsal. No adjustments have been applied to any of these values with the exception that all pH measurements were converted to the seawater pH scale at 25◦C (Velo et al., 2009).
The second part of CARINA consists of three merged, quality controlled and adjusted data files; one each for the At-lantic Ocean, Arctic Mediterranean Seas and Southern Ocean regions. These files contain all the CARINA data and also in-clude: 1) interpolated values for nutrients, oxygen and salin-ity if those data were missing and the interpolation could be made according to certain criteria, as described in Key et al. (2009); 2) calculated carbon parameters; e.g. if total dissolved inorganic carbon (TCO2) and total alkalinity (TA)
data were available, pH was calculated; and 3) instances where bottle salinity was missing or bad and was replaced with CTD salinity. Calculated or interpolated values have been given the quality flag “0”. In many cases there are ad-ditional parameters in the individual cruise files, which have not been included in the secondary QC, such as∆14C,δ13C and SF6. Most of these are included in the merged data files as well.
This report provides an overview of the Nordic Seas data in CARINA and summarises the results of the analysis of the salinity data from this region. These data are part of the Arc-tic Mediterranean Seas subset of CARINA (CARINA-AMS). This subset includes data from the Nordic Seas and the Arctic Ocean. Not one of the cruises of CARINA covered both the Arctic Ocean and the Nordic Seas to the extent that it could be included in the secondary quality control in both regions. In addition, the differences in data density in the two regions enforced the use of different QC methods for the data col-lected in them. The data from these regions were therefore analysed separately, and the data from the Arctic Ocean are described by Jutterstr¨om et al. (2009), whereas the Nordic Seas data are described here and in Olsen (2009a), Olsen (2009b), Falck and Olsen (2009), Jeansson et al. (2009), and Olafsson and Olsen (2009). A more comprehensive descrip-tion of the complete CARINA database can be found in Key et al. (2009), as well as in the other, more specialised, papers in this special issue.
2 Data provenance
45 o W
30oW
15o
W 0o
15
oE
30
oE 60
o N
65 o N
70 o N
75 o N
80 o N
85 o N
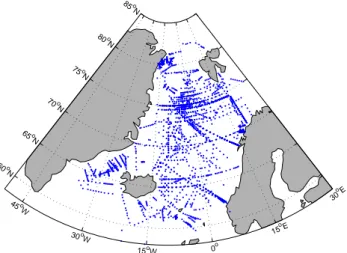
Figure 1. The Nordic Seas with the positions of CARINA data
included in this region.
of winter 1982 (18HU19820228 (36), number in parenthesis is the CARINA cruise number), which is the oldest cruise with data from the Nordic Seas in CARINA. This cruise in-cluded sampling for TCO2, Total Alkalinity (TA), and chlo-rofluoro compounds (CFCs), in addition to standard vari-ables like temperature, salinity, nutrients, and oxygen. After the CSS Hudson cruise no carbon data were collected in the Nordic Seas until the 1990s. Early that decade two important programs were initiated: (1) Sampling for CFCs at the re-peated surveys of the Nordic Seas by the Institute of Marine Research (IMR) was started in 1991 (B¨onisch et al., 1997; Karstensen et al., 2005) and (2) The ESOP and CARDEEP projects, funded in 1993 by the European Union and Norwe-gian Research Council, respectively. The two latter projects included a series of cruises with sampling for carbon chem-istry and carbon-relevant data in the Nordic Seas for 3 years. Later, this activity was continued through the EU projects ESOP II and TRACTOR. These data are the backbone of the CARINA Nordic Seas data collection.
The Nordic Seas was loosely defined as the region closed by the Fram Strait to the north, Greenland to the west, the Greenland-Scotland Ridge to the south, and Norway, the Bar-ents Sea Opening, and Spitsbergen to the east. Out of the 188 CARINA cruises, 62 are included in the CARINA-AMS, and 35 of these considered as Nordic Seas cruises. Five of these are in common with the Atlantic Ocean subset of CARINA (Tanhua et al., 2009b), in order to ensure consistency be-tween the regions. The positions of the stations of the cruises that were included are shown in Fig. 1 and the cruises are listed in Table 1. Two of the entries in Table 1 are not single cruises, OMEX1NS (186) and Iceland Sea (184), but rather collections of data from more or less the same place from one (OMEX1NS (186)) or several years (Iceland Sea (184)). The sample distributions with time and latitude are shown in Fig. 2a and b. These figures show only data that have been
19820 1991 1992 1993 1994 1995 1996 1997 1998 1999 2000 2001 2002 2003 2004 2005 2006 1000
2000 3000 4000 5000 6000
Year
Number of Samples
oxygen nutrients TCO2 TA CFCs
a
60 65 70 75 80
0 2000 4000 6000 8000 10000 12000 14000
Latitude, o N
Number of Samples
oxygen nutrients TCO2 TA CFCs
b
Figure 2. Data distribution of Nordic Seas CARINA data,
num-ber of samples by(a)year and(b)latitude, binned into 5◦latitude
bands. Data that were found to be of too poor quality to be included in the CARINA product are not included. The count for nutrients reflects measurements of any or several of the triplet nitrate, phos-phate, and silicate. Similarly, the count for CFC reflects measure-ments of any or several of CFC-11, CFC-12, CFC-113, and CCl4. Note that X-axis jumps from 1982 to 1991 in (a). Interpolated or calculated values have not been included.
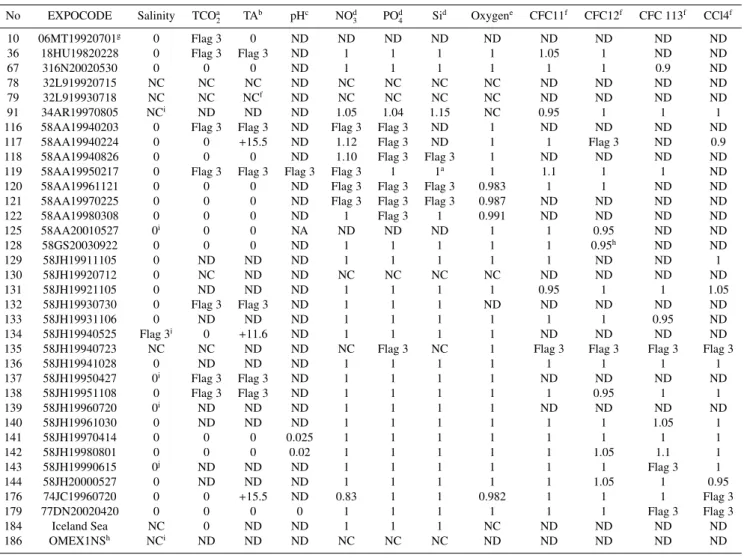
Table 1.CARINA cruises with data from the Nordic Seas. The table lists CARINA cruiseno., EXPOCODE, and recommendations from the secondary quality control. Apart from the NC (Not Considered), ND (No Data) and Flag 3 (questionable quality) entries, the numbers are the recommended adjustments. For salinity, TCO2and TA these are additive, whereas those for oxygen, nutrients, and CFCs are multiplicative. Data of questionable quality (Flag 3) are not included in the merged data product.
No EXPOCODE Salinity TCOa
2 TAb pHc NOd3 POd4 Sid Oxygene CFC11f CFC12f CFC 113f CCl4f
10 06MT19920701g 0 Flag 3 0 ND ND ND ND ND ND ND ND ND
36 18HU19820228 0 Flag 3 Flag 3 ND 1 1 1 1 1.05 1 ND ND
67 316N20020530 0 0 0 ND 1 1 1 1 1 1 0.9 ND
78 32L919920715 NC NC NC ND NC NC NC NC ND ND ND ND
79 32L919930718 NC NC NCf ND NC NC NC NC ND ND ND ND
91 34AR19970805 NCi ND ND ND 1.05 1.04 1.15 NC 0.95 1 1 1
116 58AA19940203 0 Flag 3 Flag 3 ND Flag 3 Flag 3 ND 1 ND ND ND ND
117 58AA19940224 0 0 +15.5 ND 1.12 Flag 3 ND 1 1 Flag 3 ND 0.9
118 58AA19940826 0 0 0 ND 1.10 Flag 3 Flag 3 1 ND ND ND ND
119 58AA19950217 0 Flag 3 Flag 3 Flag 3 Flag 3 1 1a 1 1.1 1 1 ND
120 58AA19961121 0 0 0 ND Flag 3 Flag 3 Flag 3 0.983 1 1 ND ND
121 58AA19970225 0 0 0 ND Flag 3 Flag 3 Flag 3 0.987 ND ND ND ND
122 58AA19980308 0 0 0 ND 1 Flag 3 1 0.991 ND ND ND ND
125 58AA20010527 0i 0 0 NA ND ND ND 1 1 0.95 ND ND
128 58GS20030922 0 0 0 ND 1 1 1 1 1 0.95h ND ND
129 58JH19911105 0 ND ND ND 1 1 1 1 1 ND ND 1
130 58JH19920712 0 NC ND ND NC NC NC NC ND ND ND ND
131 58JH19921105 0 ND ND ND 1 1 1 1 0.95 1 1 1.05
132 58JH19930730 0 Flag 3 Flag 3 ND 1 1 1 ND ND ND ND ND
133 58JH19931106 0 ND ND ND 1 1 1 1 1 1 0.95 ND
134 58JH19940525 Flag 3i 0 +11.6 ND 1 1 1 1 ND ND ND ND
135 58JH19940723 NC NC ND ND NC Flag 3 NC 1 Flag 3 Flag 3 Flag 3 Flag 3
136 58JH19941028 0 ND ND ND 1 1 1 1 1 1 1 1
137 58JH19950427 0i Flag 3 Flag 3 ND 1 1 1 1 ND ND ND ND
138 58JH19951108 0 Flag 3 Flag 3 ND 1 1 1 1 1 0.95 1 1
139 58JH19960720 0i ND ND ND 1 1 1 1 ND ND ND ND
140 58JH19961030 0 ND ND ND 1 1 1 1 1 1 1.05 1
141 58JH19970414 0 0 0 0.025 1 1 1 1 1 1 1 1
142 58JH19980801 0 0 0 0.02 1 1 1 1 1 1.05 1.1 1
143 58JH19990615 0j ND ND ND 1 1 1 1 1 1 Flag 3 1
144 58JH20000527 0 ND ND ND 1 1 1 1 1 1.05 1 0.95
176 74JC19960720 0 0 +15.5 ND 0.83 1 1 0.982 1 1 1 Flag 3
179 77DN20020420 0 0 0 0 1 1 1 1 1 1 Flag 3 Flag 3
184 Iceland Sea NC 0 ND ND 1 1 1 NC ND ND ND ND
186 OMEX1NSh NCi ND ND ND NC NC NC ND ND ND ND ND
aSecondary quality control described by Olsen (2009a), adjustments are additive (
µmol kg−1). bSecondary quality control described by Olsen (2009b), adjustments are additive (µmol kg−1). cSecondary quality control described by Velo et al. (2009), adjustments are additive.
dSecondary quality control described by Olafsson and Olsen (2009), adjustments are multiplicative. eSecondary quality control described by Falck and Olsen (2009), adjustments are multiplicative. fSecondary quality control described by Jeansson et al. (2009), adjustments are multiplicative. gThis cruise was the 5th and 6th leg of the MT21 cruise, only leg 5 data were included in our analyses.
hThese data were included after secondary QC was completed, regardless they were collected on the Norwegian Shelf and there were limited
possibilities for secondary QC.
iOnly ctdsal values in file, QC carried out on these.
jSystematic offset(s) in bottle salinity due to long storage time prior to analysis, All bottle values flagged 3 and calculations made with CTD salinity values.
The individual cruises are uniquely identified by an EX-POCODE. These identifiers typically consist of two charac-ters identifying the country code of the research vessel, fol-lowed by the two-character vessel NODC (National Oceano-graphic Data Center) code. The last eight characters denote
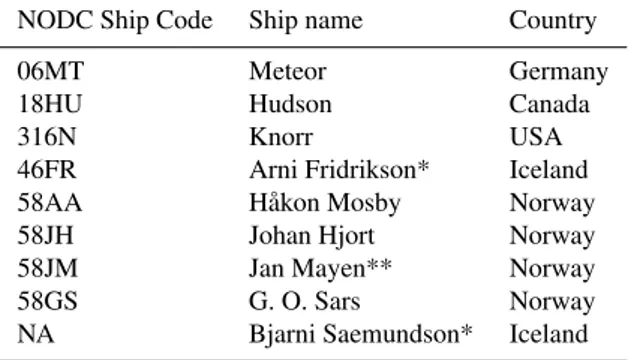
Table 2. List of ships included in the CARINA data from the Nordic Seas. Vessels with * were included in the entry “Iceland Sea”, and the vessel with ** was included in the “OMEX1NS” en-try.
NODC Ship Code Ship name Country
06MT Meteor Germany
18HU Hudson Canada
316N Knorr USA
46FR Arni Fridrikson* Iceland
58AA Håkon Mosby Norway
58JH Johan Hjort Norway
58JM Jan Mayen** Norway
58GS G. O. Sars Norway
NA Bjarni Saemundson* Iceland
from the date of the first station occupied during the cruise. Table 2 lists the codes and names of the ships involved in Nordic Seas CARINA.
The results of the secondary quality control are summa-rized in Table 1. There are four possible results: (i) the data can be used as they are, and in this case the adjust-ment constant (or factor) is 0 (or 1), (ii) the data can be used but we recommend that they are adjusted by the con-stant or factor given, (iii) we do not recommend that these data are used as they appear too be of too poor quality, this is indicated by “Flag 3”, and (iv) no specific recommenda-tion could be given, these have been labelled NC (not con-sidered). The reasoning behind each recommendation other than the first, is provided in this paper for salinity, Falck and Olsen (2009) for oxygen, Jeansson et al. (2009) for CFCs, Olafsson and Olsen (2009) for nutrients, Olsen (2009a) for TCO2, and Olsen (2009b) for TA. These papers also provide additional information such as names of responsible scien-tists, complete variable listings, references etc. for the dif-ferent parameters. The recommendations have been applied to the merged data product, and datums that were found to be questionable or bad have been removed in this, but they are retained with appropriate flags (3 or 4) in the individ-ual cruise files. Occasionally all values of certain parameter obtained during a complete cruise were found to be question-able (option (iii) above), these data have not necessarily been flagged in the individual cruise files, but have been removed from the data product. As mentioned previously, no adjust-ments have been applied to the data in the individual cruise files. The recommendations for the parameters measured at the 5 cruises in common with the CARINA-ATL were the same as those reached at by the CARINA-ATL group (Tan-hua et al., 2009b), the CARINA-AMS and CARINA-ATL data products are therefore consistent. This also brings the CARINA-AMS data product into consistency with GLODAP (Key et al., 2004), since the CARINA – ATL was consistent
with this. GLODAP (Global Ocean Data Analysis Program) was a global synthesis focusing on the carbon data collected at the WOCE/JGOFS cruises carried out during the 1990s and prepared a widely used global ocean carbon data product (Sabine et al., 2005). CARINA is complementary to GLO-DAP, only 3 out of the 188 cruises included in CARINA is also included in GLODAP, and apart from the stations oc-cupied as part of the TTO-NAS of 1981, no Nordic Seas or Arctic Ocean data were included in GLODAP.
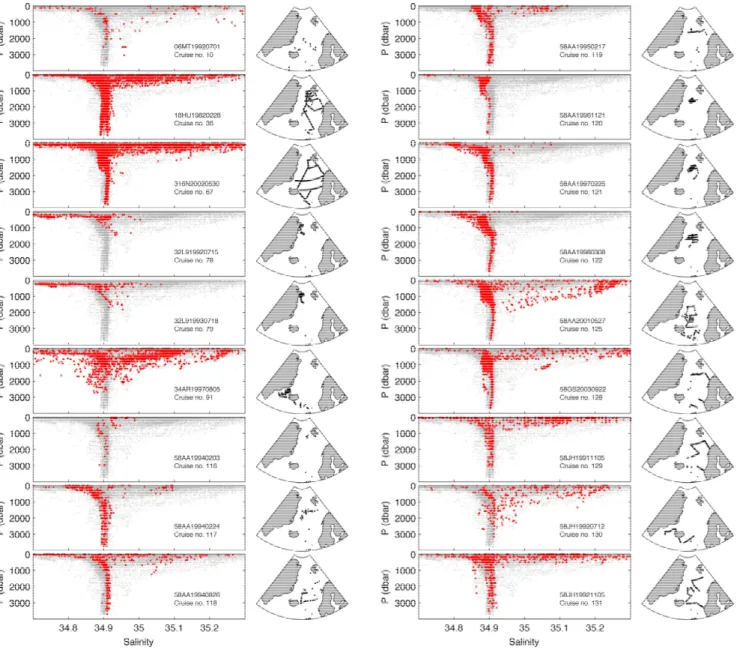
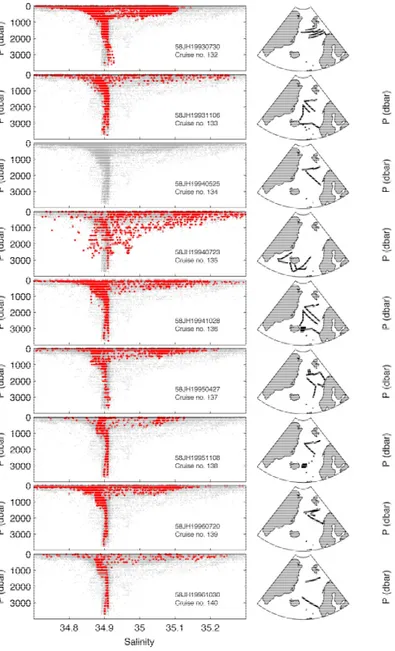
The individual cruise tracks are shown in Fig. 3, along with the salinity profiles after application of our recommen-dations. Again we note the emphasis on the Greenland Sea, only 7 of the 35 cruises did not have any stations in this area.
3 Analysis approach
The quality control was comprised of two distinct steps. First the reported measurements were studied in order to identify outliers and obvious errors, i.e. 1st level QC, which mainly involved examination of property-property plots for detec-tion of outliers. Measurements that were outliers, generally in more than one type of plot were flagged questionable (3) or bad (4). These analyses are further described in Key et al. (2009) and Tanhua et al. (2009a). Secondly, the consis-tency of the data were analysed in a process called secondary QC. These QC procedures were applied on the post-cruise data sets reported by the measurement teams, and are dif-ferent from the quality assurance (QA) procedures originally carried out by each cruise measurement team in order to en-sure sufficient quality as part of the data collection and analy-sis procedures. The secondary QC was carried out in order to identify biases in the data and to determine any adjustments (additive for salinity, TCO2, TA and pH and multiplicative for nutrients, oxygen and CFCs) in case the bias was sig-nificant. Since surface water values of TCO2, nutrients and oxygen, in particular, are highly variable, and specifically for TCO2 affected by anthropogenic CO2 penetration, the sec-ondary QC was mostly carried out using deep data. Hence these analyses assume that any bias is constant at all depths. Given the most likely causes for offsets (biases in reference material (salinity, TCO2, TA), no reference material (TCO2, TA) and problems with standardisation (nutrients), this is not unreasonable.
Figure 3. Salinity profiles and station locations for the Nordic Seas CARINA data. All data in collection shown in grey and the specific cruise is shown in red. Note that these are the data with recommendations applied, thus there are no salinity data for 58JH19940525 (134), see Sect. 4.2.2.
cruise-to-cruise differences in temperature (Johnson et al., 2001) or density (Tanhua et al., 2009a) space, depth was used as the ordinate in the Nordic Seas due to the small tempera-ture and density gradients in this region, in particular in win-ter in the Greenland Sea. Secondly, whereas the analysis in most regions is carried out using full depth profiles (John-son et al., 2001) or data from below 1500 m (Tanhua et al. 2009a) only samples from deeper than 1900 m were com-pared in the Nordic Seas. This was done to ensure that we avoided effects of ventilation, which reached depths of 1600 m during the 1990s (Ronski and Bud´eus, 2005). Thirdly, over the last decade there have been clear changes of salin-ity, silicate, and oxygen in the deep Greenland Sea
Figure 3.Continued.
4 Nordic Seas salinity analyses
In the CARINA database there are two different salinity en-tries: “salinity” and “ctdsal”, where “salinity” refers to salin-ity measured in discrete samples of water drawn from the water sampling bottle (e.g. Niskin bottle), whereas “ctdsal” refers to salinity measurements derived from the CTD con-ductivity sensor. It was not possible to unambiguously dis-tinguish between the two for all cruises due to incomplete metadata, and it is almost certain that some ctdsal values have been reported as salinity. During the secondary QC we always used salinity if available, but used cdtsal values if salinity was missing, as indicated by a footnote in Table 1. Note that the typical differences between salinity and ctd-sal (usually a few parts in ∼35 000) or the differences
Cruise
36-18HU19820228129-58JH1991110510-06MT19920701130-58JH19920712131-58JH19921105132-58JH19930730133-58JH19931106116-58AA19940203117-58AA19940224134-58JH19940525135-58JH19940723118-58AA19940826136-58JH19941028119-58AA19950217137-58JH19950427138-58JH19951108139-58JH199 6072
0
176-74JC19960720140-58JH1996 1030 1 20-58AA199611 21 121-58AA19970 225 141-58JH1 9970 414
91-34AR19970805122-58AA19980 308 142-58JH19 9808 01 143-58JH1 9990 615 144 -58JH20000527 125-58AA20010 527 179-7 7DN2 0020 420 67-316N20 0205 30 1 28-58GS2 0030 9_no Edd y Correction -0.02 -0.01 0.00 0.01 0.02
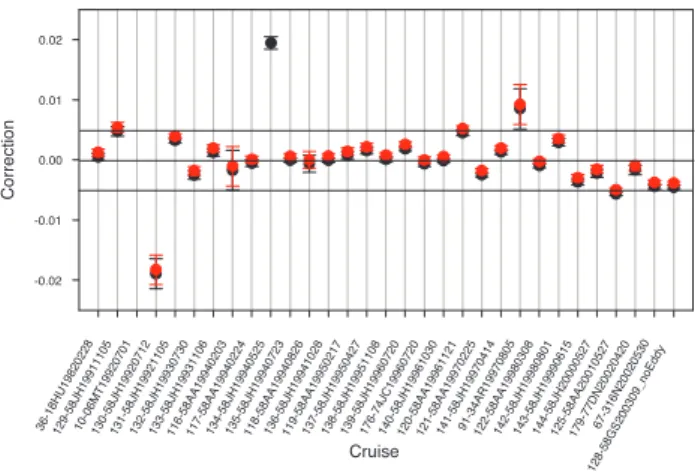
Figure 4.Salinity corrections and their uncertainties from WLSQ
inversion of cnaX crossover results (Tanhua et al., 2009a) from data without (black) and with (red) recommendations applied. 58GS20030922 (128) had several stations in a submesoscale co-herent eddy (Kasajima et al., 2006), the “ noEddy” signifies that these stations were removed prior to the crossover analysis. Note that cruises have been sorted by date, with oldest cruise to the left.
4.1 Crossover and inversion analyses
All results and analyses carried out during the sec-ondary QC of the Nordic Seas salinity data are avail-able at the CARINA website (http://cdiac.ornl.gov/oceans/ CARINA/Carina inv.html). This section summarises the im-portant findings.
The consistency of the Nordic Seas salinity data was eval-uated using an early version of the cnaX crossover routine described by Tanhua et al. (2009a). All station pairs, from different cruises, within 300 km from each other were de-fined as crossover points. Thus two cruises may cross over at several points which can over quite large regions with poten-tially quite different hydrography. This can bias the results. To avoid this, each cruisepair’s crossover stations were par-titioned into at most 6 clusters, which are groups of stations within a circle of a maximum radius of 175 km, using a k-means clustering routine (Seber, 1984). A minimum of two stations per cruise was required in each cluster. The data from each station of the two cruises involved in the cluster were interpolated onto 50 m depth intervals using a piece-wise cubic hermite interpolating approach. The interpolated profiles of each cruise were then averaged and an offset and standard deviation profile for each cluster was calculated us-ing data below 1900 dbar. Usus-ing these profiles a weighted mean offset and weighted mean standard deviation were de-termined for each cruisepair and used as input for the inver-sion that calculated the corrections, following the methodol-ogy of Johnson et al. (2001).
The salinity data from Iceland Sea (184), OMEX1NS (186), 32L919920715 (78), and 32L919930718 (79) were not included in this analysis as there were no samples from
deeper than 1900 dbar. These data have been labelled NC in Table 1. Figure 4 shows corrections from the Weighted Least Squares (WLSQ, Johnson et al. (2001); Tanhua et al. (2009a)) inversion of the cnaX crossover offsets. Addi-tive corrections have been used and posiAddi-tive values indicate that to obtain consistency an upward correction is required, these data are thus low and vice versa for negative values. Three features are noteworthy: (i) With some exceptions there is an overall trend towards higher salinity values, i.e. in-creasingly negative corrections. This is consistent with the aforementioned increasing fraction of deep waters from the Arctic Ocean in the deep Greenland Sea where most of the crossovers occurred, and should not be corrected for. (ii) The data from 58JH19920712 (130) appear almost 0.02 too high, those from 58JH19940525 (134) appear almost 0.02 too low, and those from 34AR19970805 (91) appears almost 0.01 too low. These data are thus all more offset than the CARINA wide threshold for applying salinity corrections of ±0.005 (Tanhua et al, 2009a). Finally, (iii) at the start and end there is some noise, but within±0.005 when the temporal trend is taken into account.
4.2 Recommendations
Given the outcome of the crossover and inversion analysis we believe that the cruises 58JH19920712 (130), 58JH19940525 (134) and 34AR19970805 (91) should be considered for adjustments and are discussed in the following subsec-tions. In addition some special considerations applies to 58JH19940723 (135).
4.2.1 58JH19920712 (130)
This cruise took place outside the Greenland Sea, mainly through the Denmark Strait and Iceland – Faeroe Gap (see Fig. 3). The number of crossovers with other cruises is thefore limited. Given this and given the variability of this re-gion we feel that we do not have enough evidence to recom-mend that an adjustment should be applied to these data. To signify this, the salinity data of this cruise have been labelled NC (Not Considered) in Table 1.
4.2.2 58JH19940525 (134)
34.8 34.85 34.9 34.95 0 500 1000 1500 2000 2500 3000 3500 4000 pressure(dbar) all 134−58JH19940525 8oW 0o 8o
E 16oE 24 oE 72oN 73o N 74o N 75o N 76o N 77o N 78o N
34.8 34.85 34.9 34.95
0 500 1000 1500 2000 2500 3000 3500 pressure (dbar) salinity all 134−58JH19940525 8o
W 0o
8o
E 16oE 24
o E 60o N 64o N 68o N 72o N 76o N
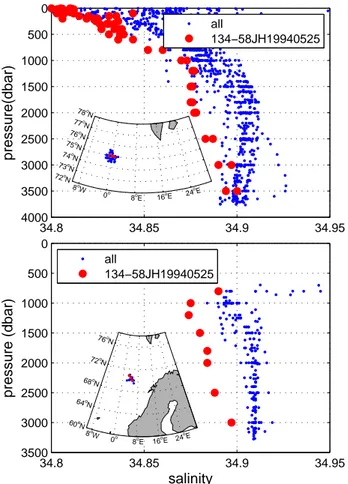
Figure 5. Salinity profiles from (upper) Central Greenland Sea
(74.5–75.5◦N, 2◦W–2◦E) and (lower) Lofoten Basin (69.5◦N–
71◦N, 2–6◦E) obtained at the 58JH19940525 (134) cruise,
com-pared to the other data in the same area. Note that scale has been customised to resolve deep ocean variations and there are surface data not appearing in this figure, as they are off-scale.
data are∼0.015 lower than what is normally observed. The difference increases moving towards shallower depths, and at 2000 dbar the data are around 0.03 lower than normal. None of the other data obtained at this cruise suggested that an exceptional hydrographic phenomenon was taking place in either of these two basins. We therefore attribute these features to deficiencies of the measurements, but given the variable nature of the offset no robust correction factor can be determined and we feel that the most appropriate recom-mendation for these data is to label them questionable. The data are therefore not included in the merged CARINA data product.
4.2.3 34AR19970805 (91)
The crossover and inversion analysis indicated that the salin-ity data from this cruise were almost 0.01 too low. The cruise took place across the Nordic Seas – North Atlantic over-flow regions (Fig. 3) and given the variability here there is
a chance that the offset has a natural rather than instrumental cause, and we have chosen to label the salinity data from this cruise NC in Table 1. This is consistent with the decision for the 58JH19920712 (130) salinity data.
4.2.4 58JH19940723 (135)
The correction determined by the inversion was smaller that the threshold of±0.005. However, the cruise took place in the same region as 58JH19920712 (130) and 34AR19970805 (91), and for consistency we have chosen to label the salinity data NC in Table 1.
4.3 Consistency of final Nordic Seas salinity data
In order to evaluate the consistency of the final Nordic Seas salinity data, a cnaX crossover analysis was carried out af-ter the recommendations were implemented. The corrections determined through the WLSQ inversion of the crossover offsets are shown in Fig. 4. The corrections for the cor-rected data are all higher than the corrections proposed for the original data. This is a consequence of the practise that the inversion objectively determines the corrections required to maximize the consistency of the cruises, i.e. no a priori assumption on what is the “correct” deep sea salinity value is invoked. By removing the very low cruise 58JH19940525 (134), the remaining cruises becomes overall less positively biased, resulting in a shift to less negative corrections.
With a few exceptions the data are consistent to within ±0.005. The most notable are 58JH19920712 (130) and 34AR19970805 (91), which both took place in the overflow regions and therefore have been labelled NC. Otherwise there appears to be a slight trend in the data, with newer cruises having higher salinities than the older (i.e. newer cruises needing negative adjustments), consistent with the observa-tions of Blindheim and Rey (2004) of increasing salinities in the deep Greenland Sea, where most of the crossovers occurred. Both 58JH19911105 (129) and 58AA20010527 (125) falls just outside the±0.005 consistency limit, but con-sidering the timing we believe that this just reflects the natu-ral variation in the Greenland Sea.
5 Data access
Acknowledgements. This work was carried out with support from the Norwegian Research Council through A-CARB (188167) and CARBON-HEAT (185093), and from EU IP CARBOOCEAN (511176). Additional support from the International Ocean Carbon Coordination Project (IOCCP) and the Hanse Institute for Advanced Study (HWK), Delmenhorst, Germany have been greatly appreciated. Additional support as follows, for R. M. Key, NOAA grant NA08OAR4320752 and NA0OAR4310820; J. L. Bullister, NOAA Climate Program Office. Without the dedication and hard work of all investigators and analysts who collected the data used in this study, this project would not have been possible and we gratefully acknowledge those who have contributed their data to the CARINA project. Comments by two anonymous reviewers helped to clarify this article, which is contribution no. A257 of the Bjerknes Centre for Climate Research.
Edited by: M. Hoppema
References
Blindheim, J. and Rey, F.: Water-mass formation and distribution in the Nordic Seas during the 1990s, ICES J. Mar. Sci., 61, 846– 863, 2004.
Brewer, P. G., Takahashi, T., and Williams, R. T.: Transient trac-ers in the ocean – Hydrography data and carbon dioxide sys-tems with revised carbon chemistry data, NDP-004/R41, Carbon Dioxide Information Analysis Center, Oak Ridge National Lab-oratory, Oak Ridge, Tenn., USA, 1986.
B¨onisch, G., Blindheim, J., Bullister, J. L., Schlosser, P., and Wal-lace, D. W. R.: Long-term trends of temperature, salinity, density and transient tracers in the Greenland Sea, J. Geophys. Res, 102, 18553–18571, 1997.
Falck, E. and Olsen, A.: Nordic Seas dissolved oxygen data in CA-RINA, Earth Syst. Sci. Data Discuss., 2, 537–553, 2009, http://www.earth-syst-sci-data-discuss.net/2/537/2009/. Jeansson, E., Olsson, K. A., Tanhua, T., and Bullister, J. L.: Nordic
Seas and Arctic Ocean CFC data in CARINA, Earth Syst. Sci. Data Discuss., 2, 493–536, 2009,
http://www.earth-syst-sci-data-discuss.net/2/493/2009/. Jeansson, E., Jutterstr¨om, S., Rudels, B., Anderson, L. G., Olsson,
K. A., Jones, E. P., Smethie Jr., W. M., and Swift, J. H.: Sources to the East Greenland Current and its contribution to the Den-mark Strait overflow, Prog. Oceanogr., 78, 12–28, 2008 Johnson, G. C., Robbins, P. E., and Hufford, G. E.: Systematic
adjustments of hydrographic sections for internal consistency, J. Atmos. Ocean. Tech., 18, 1234–1244, 2001.
Jutterstr¨om, S., Anderson, L. G., Bates, N. R., Bellerby, R., Johan-nessen, T., Jones, E. P., Key, R. M., Lin, X., Olsen, A., and Omar, A. M.: Arctic Ocean data in CARINA, Earth Syst. Sci. Data Dis-cuss., 2, 281–308, 2009,
http://www.earth-syst-sci-data-discuss.net/2/281/2009/. Jutterstr¨om, S., Jeansson, E., Anderson, L. G., Bellerby, R., Jones,
E. P., Smethie Jr., W. M., and Swift, J.: Evaluation of anthro-pogenic carbon in the Nordic Seas using observed relationships of N, P and C versus CFCs, Prog. Oceanog., 78, 78–84, 2008. Kasajima, Y., Olsson, K. A., Johannessen, T., Messias, M.-J.,
Jeans-son, E., Bellerby, R. G. J., and Skjelvan, I.: A submesoscale co-herent eddy in the Greenland Sea in 2003, J. Geophys. Res., 111, C07013, doi:10.1029/2005JC003130, 2006.
Karstensen, J., Schlosser, P., Wallace, D. W. R., Bullister, J., and Blindheim, J.: Water mass transformation in the Green-land Sea during the 1990s, J. Geophys. Res., 110, C07022, doi:10.1029/2004JC002510, 2005.
Key, R. M., Kozyr, A., Sabine, C. L., Lee, K., Wanninkhof, R., Bullister, J., Feely, R. A., Millero, F., Mordy, C., and Peng, T.-H.: Results from the Global Data Analysis Project (GLODAP), Global. Biogeochem. Cy., 18, GB4031, doi:10.1029/2004GB002247, 2004.
Key, R. M. Tanhua, T., Olsen, A., Hoppema, M., Jutterstr¨om, S., Schirnick, C., van Heuven, S., Lin. X., Wallace, D. W. R., and Mintrop, L.: The CARINA data synthesis project: Introduction and overview, Earth Syst. Sci. Data Discuss., in press, 2009. Olafsson, J. and Olsen, A.: Nordic Seas nutrients data in CARINA,
Earth Syst. Sci. Data Discuss., in preparation, 2009.
Olsen, A.: Nordic Seas total dissolved inorganic carbon data in CA-RINA, Earth Syst. Sci. Data Discuss., 2, 181–203, 2009a, http://www.earth-syst-sci-data-discuss.net/2/181/2009/. Olsen, A.: Nordic Seas total alkalinity data in CARINA, Earth Syst.
Sci. Data Discuss., 2, 309–330, 2009b,
http://www.earth-syst-sci-data-discuss.net/2/309/2009/. Olsen, A., Omar, A. M., Bellerby, R. G. J., Johannessen, T.,
Ninne-mann, U., Brown, K. R., Olsson, K. A., Olafsson, J., Nondal, G., Kivim¨ae, C., Kringstad, S., Neill, C., and Olafsdottir, S.: Magni-tude and origin of the anthropogenic CO2increase and13C Suess effect in the Nordic seas since 1981, Global Biogeochem. Cy., 20, GB3027, doi:10.1029/2005GB002669, 2006.
Ronski, S. and Bud´eus, G.: Time series of winter convec-tion in the Greenland Sea, J. Geophys. Res., 110, C04015, doi:10.1029/2004JC002318, 2005.
Sabine, C. L., Key, R. M., Kozyr, A., Feely, R. A., Wanninkhof, R., Millero, F. J., Peng, T.-H., Bullister, J. L., and Lee, K.: Global Ocean Data Analysis Project: Results and Data, ORNL/ CDIAC-145, NDP-083, Carbon Dioxide Information Analysis Center, Oak Ridge National Laboratory, U.S. Department of Energy, Oak Ridge, Tennesse, 110 pp., 2005.
Seber, C. A. F.: Multivariate Observations, NJ, John Wiley & Sons, Inc, 1984.
Tanhua, T., van Heuven, S., Key, R. M., Velo, A., Olsen, A., and Schirnick, C.: Quality control procedures and methods of the CARINA database, Earth Syst. Sci. Data Discuss., 2, 205–240, 2009a,
http://www.earth-syst-sci-data-discuss.net/2/205/2009/. Tanhua, T., Steinfeldt, R., Key, R. M., Brown, P., Gruber, N.,
Wan-ninkhof, R., Perez, F., Krtzinger, A., Velo, A., Schuster, U., van Heuven, S., Bullister, J. L., Stendardo, I., Hoppema, M., Olsen, A., Kozyr, A., Pierrot, D., Schirnick, C., and Wallace, D. W. R.: Atlantic Ocean CARINA data: overview and salinity adjust-ments, Earth Syst. Sci. Data Discuss., 2, 241–280, 2009b, http://www.earth-syst-sci-data-discuss.net/2/241/2009/. Velo, A., P´erez, F. F., Lin, X., Key, R. M., Tanhua, T., de la Paz,