High-Field Functional Imaging of Pitch
Processing in Auditory Cortex of the Cat
Blake E. Butler1,2*, Amee J. Hall3, Stephen G. Lomber1,2,4,5
1Department of Physiology and Pharmacology, University of Western Ontario, London, Ontario, Canada,
2Brain and Mind Institute, University of Western Ontario, London, Ontario, Canada,3Department of Anatomy and Cell Biology, University of Western Ontario, London, Ontario, Canada,4Department of Psychology, University of Western Ontario, London, Ontario, Canada,5National Centre for Audiology, University of Western Ontario, London, Ontario, Canada
Abstract
The perception of pitch is a widely studied and hotly debated topic in human hearing. Many of these studies combine functional imaging techniques with stimuli designed to disambigu-ate the percept of pitch from frequency information present in the stimulus. While useful in identifying potential“pitch centres”in cortex, the existence of truly pitch-responsive neurons requires single neuron-level measures that can only be undertaken in animal models. While a number of animals have been shown to be sensitive to pitch, few studies have addressed the location of cortical generators of pitch percepts in non-human models. The current study uses high-field functional magnetic resonance imaging (fMRI) of the feline brain in an attempt to identify regions of cortex that show increased activity in response to pitch-evok-ing stimuli. Cats were presented with iterated rippled noise (IRN) stimuli, narrowband noise stimuli with the same spectral profile but no perceivable pitch, and a processed IRN stimulus in which phase components were randomized to preserve slowly changing modulations in the absence of pitch (IRNo). Pitch-related activity was not observed to occur in either pri-mary auditory cortex (A1) or the anterior auditory field (AAF) which comprise the core audi-tory cortex in cats. Rather, cortical areas surrounding the posterior ectosylvian sulcus responded preferentially to the IRN stimulus when compared to narrowband noise, with group analyses revealing bilateral activity centred in the posterior auditory field (PAF). This study demonstrates that fMRI is useful for identifying pitch-related processing in cat cortex, and identifies cortical areas that warrant further investigation. Moreover, we have taken the first steps in identifying a useful animal model for the study of pitch perception.
Introduction
Pitch is the perceptual correlate of sound frequency, and the way that pitch changes over time defines the melody of a musical piece. In addition, verbal pitch is fundamental to language acquisition both for tonal languages, where pitch variations provide basic lexical information, and for non-tonal languages where pitch is used to convey emotional and other paralinguistic
OPEN ACCESS
Citation:Butler BE, Hall AJ, Lomber SG (2015) High-Field Functional Imaging of Pitch Processing in Auditory Cortex of the Cat. PLoS ONE 10(7): e0134362. doi:10.1371/journal.pone.0134362
Editor:Christian Friedrich Altmann, Kyoto University, JAPAN
Received:January 22, 2015
Accepted:July 9, 2015
Published:July 30, 2015
Copyright:© 2015 Butler et al. This is an open access article distributed under the terms of the Creative Commons Attribution License, which permits unrestricted use, distribution, and reproduction in any medium, provided the original author and source are credited.
Data Availability Statement:All relevant data are within the paper.
Funding:Funding for this project was provided by the Natural Sciences and Engineering Research Council, the Canadian Institutes for Health Research, and the Canada Foundation for Innovation. The funders had no role in study design, data collection and analysis, decision to publish, or preparation of the manuscript.
information. Moreover, pitch cues are critical for extracting meaningful signals from a back-ground of competing auditory information, such as is encountered in the classic“cocktail party”phenomenon (See [1] for a review). Thus, the accurate encoding of pitch is critical to establishing faithful representations of biologically relevant acoustic stimuli in the listener’s environment.
The vast majority of pitch-evoking sounds present in the environment contain energy at a fundamental frequency and at integer multiples of that frequency, known as harmonics. How-ever, through complex spectrotemporal processing, a singular pitch is perceived that corre-sponds to the fundamental of the complex source. This pitch percept is the result of two pitch codes that are established in parallel at the level of the cochlea: a spectral code based on the site of maximal displacement along the tonotopically organized basilar membrane, and a temporal code based on the rate of action potential generation in afferent neurons that synapse at that characteristic place. While these cues are encoded at the auditory periphery, a growing litera-ture suggests that the percept of pitch is first established cortically, at a point beyond primary auditory cortex (A1). This is despite evidence that orthogonal tonotopic and periodotopic maps exist in A1 that may provide the capacity for pitch extraction at this level [2–3]. Still, studies using electroencephalography (EEG) or functional magnetic resonance imaging (fMRI) in humans suggest that pitch processing is localized either to an area along lateral Heschl’s gyrus [4–7] or planum temporale [8–11]. These results have been supported by electrophysio-logical recordings in non-human primates that fail to find pitch-sensitive neurons in A1, instead localizing pitch processing to a cortical belt region along the anterolateral border of A1 in the marmoset [12] and to the lateral belt region in the macaque [13].
While this convergence of evidence suggests pitch emerges beyond primary auditory cortex, how the peripherally-encoded pitch cues are converted into a singular percept remains poorly understood. This represents a critical step in object representation, as perceptual judgements and consequent actions are not based on individual analysis of the frequency components encoded by peripheral structures, but instead occur following higher-level pitch perception. For example, while two speakers may produce energy at the same frequency components, the way in which the sum of these components is represented by pitch-responsive neurons helps to discriminate the speakers and may affect the meaning extracted from speech. The use of animal models allows for the combination of traditional fMRI studies of pitch perception with more invasive methods that will provide the necessary information to address this open question. Still, the neural underpinnings of pitch perception have yet to be addressed in a number of tra-ditional models of auditory function. For example, the ability of cats to perceive the pitch of complex auditory stimuli has long been known [14–15], yet the cortical region subserving this function remains unidentified. Using fMRI, the current study seeks to identify areas of cat auditory cortex that contribute to pitch perception and aims to provide a basis for future stud-ies to further examine the topic of pitch encoding in the cat. A better understanding of pitch perception will provide insight into how listeners engage with meaningful stimuli in their envi-ronment. Furthermore, it may help elucidate issues related to impoverished pitch processing, such as those reported by individuals with congenital amusia [16], and may provide a basis for improving the encoding of pitch by cochlear implant users.
Materials and Methods
Animal Preparation
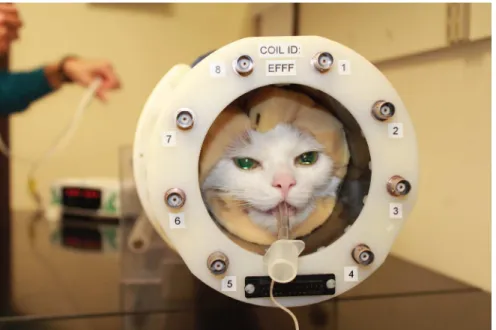
in accordance with the guidelines specified by the Canadian Council on Animal Care [17]. Normal hearing thresholds were verified for each animal using click-evoked auditory brain-stem responses (ABRs) measured with an Eclipse EP15 Diagnostic ABR sybrain-stem (Interacoustics A/S, Denmark). Prior to each imaging session, cats were pre-medicated with a mixture of atro-pine (0.02 mg/kg s.c.) and acepromazine (0.02 mg/kg s.c.). This combination has been shown to reduce the amount of general anesthesia necessary during scanning [18], thus minimizing anesthetic-induced cortical suppression. Each animal was anaesthetized 20 minutes later with a cocktail of ketamine (4 mg/kg i.m.) and dexdomitor (0.025 mg/kg i.m.). Pilot studies in our lab comparing anesthetic regimes for functional imaging in the cat have identified this as the ideal combination of drugs to maintain adequate sedation for the duration of a scanning session while optimizing BOLD response. This procedure, described in length by Brown and colleagues [19] has been shown to be effective in demonstrating stimulus-evoked activity in the cat’s audi-tory cortex [19–20]. Once anesthetized, the animal was intubated and an indwelling catheter was placed in the saphenous vein to facilitate the maintenance of anesthesia. Once prepared, the animal was placed in a sternal position within a custom-built Plexiglas apparatus (Fig 1). Body temperature was maintained with heating discs placed inside the apparatus, and vitals including respiratory rate, end-tidal CO2,heart rate, non-invasive blood pressure, and
blood-oxygen saturation were continuously monitored. MRI-compatible earphone inserts comprised of sound-attenuating foam surrounding a tube designed to deliver sound stimuli as closely as possible to the tympanic membrane were placed in the ear canals. The animals head was then placed inside a custom-built 8-channel radio frequency (RF) coil, and stabilized with sound dampening compression foam padding that further attenuated scanner noise. Finally, the ani-mal and the Plexiglas apparatus were placed inside the bore of the magnet. For the remainder of the session, anesthesia was maintained through continuous administration of ketamine (0.6–0.75 mg/kg/hr i.v.) and spontaneous inhalation of isoflurane (0.4–0.5%). Following each scanning session, anesthesia was discontinued and animals were monitored until they recov-ered from anesthetic effects. The intubation tube was removed when the cat exhibited a gag
Fig 1. An anesthetized animal in the 8-channel RF coil.The head is surrounded by foam that serves to minimize movement and attenuate scanner noise. Also pictured is the intubation tube which permits the administration of isoflurane anesthesia.
reflex and increased jaw tone. Following successful recovery, the indwelling catheter was removed and cats were returned to their clowder. Every effort was made to minimize animal trauma during the entire scanning period.
Stimuli
All stimuli were generated in MatLab (MathWorks) and presented at 85 dB SPL using in-house custom software (Microsoft Visual Studio) on a Dell laptop through an external Roland Corporation soundcard (24-bit/96kHz; Model UA-25EX) and Pyle Pro external amplifier (Model PCAU11) to MRI-compatible foam earphone inserts (Sensimetric Model S14). The narrowband Gaussian noise (NBN) stimulus was 400 ms in duration and covered a ¼ octave band centered at 10 kHz (48 dB/octave band pass filter, 10 ms linear onset/offset ramps). The IRN stimulus was generated by first creating a 1s Gaussian noise. This noise sample was then duplicated and added to itself following a 2.5ms delay. This delay-and-add process was repeated 16 times to create a stimulus with a perceivable pitch of 400 Hz. This process resulted in a 1040 ms stimulus that increased in amplitude gradually over the first 40 ms and decreased gradually over the last 40 ms. To correct for this, the first and last 320 ms were removed to cre-ate a 400 ms stimulus with equal amplitude across its entire duration. Finally, the IRN stimulus was band pass filtered to match the spectral range of the narrowband noise stimulus (a ¼ octave band centered at 10 kHz, 48 dB/octave filter) and 10 ms onset and offset ramps were applied. In addition, an IRNo stimulus was generated as described by Barker and colleagues [11]. In short, the IRN stimulus described above was sampled with a rectangular window with duration equal to the IRN delay (2.5 ms). A fast Fourier transform (FFT) was used to determine the phase and amplitude spectra of the sample and phase components were randomized. An inverse FFT was then used to regenerate the time representation. The analysis window was advanced by 2.5 ms and this process was repeated through the duration of the stimulus. The regenerated samples were concatenated (preserving onset times) to create a 400 ms IRNo stim-ulus with fine structure information (and resulting pitch percept) removed. The IRNo stimstim-ulus was band pass filtered to match the spectral range of the IRN and narrowband noise stimuli, and 10 ms linear onset and offset ramps were applied. This limited bandwidth minimized interference between the stimuli used in the current study and scanner noise, which is largest at lower frequencies, while ensuring stimuli were well within the normal range of feline hear-ing. Moreover, the pitch percept evoked by IRN stimuli is dependent upon temporal repetition rather than resolvable spectral content such that traditional spectral and temporal envelope models of pitch perception are unable to explain the perception of IRN pitch [21]. Thus, high-pass filtering has a minimal impact on the pitch percept of IRN stimuli. Each of the stimulus types (NBN, IRN, IRNo) were presented in bursts consisting of 30 repetitions of the 400 ms stimulus with a 100 ms interstimulus interval (ISI), for a total block duration of 15 s.
MRI Parameters & Scanning Protocol
All data were acquired on an actively shielded 68 cm 7 T horizontal bore scanner with a DirectDrive console (Agilent, Santa Clara, California) equipped with a Siemens AC84 gradient subsystem (Erlangen, Germany) located at the Robarts Research Institute, and operating at a slew rate of 300 mT/m/s. An in-house designed and manufactured conformal 10 cm cylindrical 8-channel transceive radiofrequency coil was used for all imaging sessions. Magnetic field opti-mization (B0shimming) was performed using an automated 3D mapping procedure [22] over
flip = 70 degrees; slices = 26 x 1 mm; matrix = 96 x 96; FOV = 84 x 84 mm; acquisition voxel size = 0.88 mm x 0.88 mm x 1.0 mm; acquisition time = 2 s/volume; BW = 3719 Hz/px. Images were corrected for physiological fluctuations using navigator echo correction [23]. A high-reso-lution anatomical reference volume was collected along the same orientation and FOV as the functional images using a FLASH imaging sequence (TR = 750 ms; TE = 8ms; matrix = 256 x 256; acquisition voxel size = 281μm x 281μm x 1 mm). At the start of each scanning session, a broadband noise stimulus (0–25 kHz, 400 ms bursts with 10 ms onset/offset ramps, 100 ms ISI) was presented in an ON-OFF block design to confirm acoustically-evoked activity in audi-tory cortex. Following this confirmation, each of the stimuli were presented in ON-OFF con-tinuous block protocols with each block consisting of 15 volumes (TR and TA = 2s). Three to six blocks of each stimulus type were collected in a scanning session. While the choice of a con-tinuous scanning protocol may have a minimal impact on the salience of pitch-evoking stimuli, previous work in our lab has suggested that continuous scanning optimizes the quality and quantity of data obtained in the anesthetized cat [20]. Moreover, tonotopic map representation in human auditory cortex has been shown to be only minimally distorted by scanner noise [24]. Three blocks of each stimulus type were collected in a run, and stimulus blocks were inter-leaved with baseline blocks during which no stimulus was presented.
Data Modelling
Individual animal analyses. Functional image volumes from each animal were analyzed separately using SPM8 (Wellcome Trust Centre for Neuroimaging, UCL, London, UK) and MatLab software. Image volumes for each animal were reoriented, realigned to the mean, motion corrected, co-registered to the high-resolution structural image from the same session, and smoothed with a 2 mm Gaussian full width at half maximum (FWHM) kernel. Some ani-mals were scanned on multiple days; in these cases, functional volumes were co-registered to the anatomical image collected on the first day of scanning to facilitate data analysis across scanning sessions. A general linear model of the functional data was created for each animal imaged. Head motion parameters (3 translational and 3 rotational measures) were included as regressors of no interest in the model to account for movement-related artifacts. Following model estimation, t-contrasts were generated for each of the stimuli presented (stimulus– base-line) as well as for the difference in activation between the IRN and NBN stimuli (IRN–NBN) and for the difference between IRN and IRNo stimuli (IRN–IRNo). Hand drawn region of interest (ROI) masks were generated for the auditory cortex of each animal based on anatomy.
activation between the IRN and NBN stimuli (IRN–NBN) and for the difference between IRN and IRNo stimuli (IRN–IRNo).
BOLD Signal Representations and Time Courses
Data from each animal were first extracted separately, followed by group-level extraction. In each case, a voxelwise threshold of p<0.001 (uncorrected) and a cluster-level threshold of p<0.05 (FWE-corrected) were applied to all results. Within each cluster, peak voxels showing a greater BOLD signal in response to IRN stimuli than either the NBN or IRNo stimuli were assigned to one of 13 defined areas of cat auditory cortex using a method described previously [19,25]. Briefly, the co-ordinates of a voxel of interest (VOI) were recorded from the output of the linear model, and plotted in three-dimensional space on the high-resolution anatomical scan for an individual animal, or on the anatomical template in the case of group analysis. Landmarks previously shown to delineate cortical areas were then used to determine the loca-tion of the BOLD activity peak. The mean percent signal change (PSC) at each voxel within a cluster was computed across the entire block of each stimulus type and normalized by subtract-ing the mean BOLD signal dursubtract-ing baseline blocks. To visualize activity related to pitch process-ing, the difference in mean BOLD activity was then computed for each voxel (IRN-NBN and IRN-IRNo), and plotted on anatomical images. Additionally, mean PSCs across voxels com-prising a 1 mm sphere surrounding each VOI were computed for each of the 15 volumes in a stimulus block individually to examine the time course of BOLD signal changes for each stimu-lus type and contrast of interest. One-sample t-tests corrected for multiple comparisons were used to determine where BOLD signals differed significantly from baseline. Related-samples t-tests corrected for multiple comparisons were used to compare the PSC elicited by different stimulus types.
Results
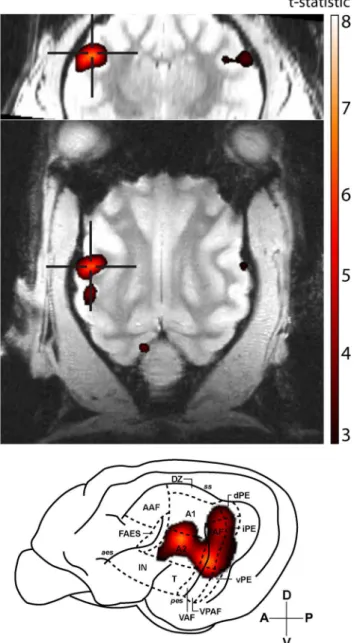
In order to determine the area of cat auditory cortex that selectively responds to stimuli with pitch, an IRN stimulus was contrasted against a narrowband noise stimulus that consisted of identical spectral content, but which did not elicit a pitch percept. Five of the ten animals scanned showed clusters of significant activity for this contrast. At an individual-animal level, these clusters of significant BOLD activity encompassed multiple areas of the auditory cortex (an example is shown inFig 2) with peak levels of activity typically observed in areas occupying the banks of the posterior ectosylvian sulcus, including the posterior auditory field (PAF), ven-tral auditory field (VAF), and venven-tral posterior auditory field (VPAF).
Discussion
Pitch-related activity is clustered about pes
Single-animal based analysis of pitch perception revealed large clusters of BOLD activity that encompassed a number of fields of the cat auditory cortex, primarily those surrounding the posterior ectosylvian sulcus (seeFig 5for a summary). This area has previously been consid-ered as a candidate for processing auditory patterns in the spectral and temporal domains, such as those found in communicative signals [26]. Group-level analysis revealed that related BOLD activity is centred over the posterior auditory field (PAF). The presence of
pitch-Fig 2. Representative T-statistic map.BOLD activity for the IRN-NBN contrast in a single animal. Significant activity was observed across multiple fields of the auditory cortex, with significant peaks in both the posterior auditory field (PAF) and second auditory cortex (A2). Maps are overlaid on coronal (top row) and horizontal (middle row) anatomical slices, and are superimposed on a lateral view of cat cortex. The local peak signal change maxima are indicated by crosshairs. A: anterior, P: posterior, V: ventral, D: dorsal.
responsive neurons in PAF satisfies a number of a priori hypotheses based on human and ani-mal studies. Maxiani-mal pitch-related activation was not observed to occur in either primary audi-tory cortex (A1) or the anterior audiaudi-tory field (AAF), which comprise the core audiaudi-tory cortex in the cat [27]. Rather, it was localized to an area of auditory cortex that is functionally upstream from A1/AAF that has been shown to receive direct projections from core areas [27]. Interestingly, the cluster of activity in the left hemispheredidextend over the portion of A1 that a previous optical imaging study [2] determined corresponds to a periodicity of 400 Hz (the pitch elicited by the IRN stimulus in the current study). The locus of maximal activity was the dorsal aspect of PAF, which is located adjacent to the low-frequency border of A1, provid-ing analogous homology to that observed in the marmoset [12]. While the IRN-NBN contrast revealed strong, bilateral activation of PAF, the IRN-IRNo contrast failed to reveal any signifi-cant activity.
Frequency- and pitch-tuning in PAF
Because pitch is considered to be the functional correlate of stimulus frequency, one would expect to find a frequency-based representation in pitch-responsive cortex. Indeed, each of areas PAF has been previously shown to display tonotopic organization [28–29]. In addition,
Fig 3. Group T-statistic maps.BOLD activity for the IRN-NBN contrast in the group of cats tested. The peaks of significant clusters of activity were localized to voxels within the posterior auditory field (PAF) bilaterally. Maps are overlaid on coronal (top row) and horizontal (middle row) anatomical slices, and are superimposed on a lateral view of cat cortex. The local peak signal change maxima are indicated by crosshairs. A: anterior, P: posterior, V: ventral, D: dorsal.
neurons within a pitch-responsive area would be expected to respond to a variety of stimuli that evoke a common pitch (e.g. to a 1 kHz pure tone as well as a stimulus that evokes a 1 kHz percept in the absence of energy at the fundamental frequency). While early studies suggested
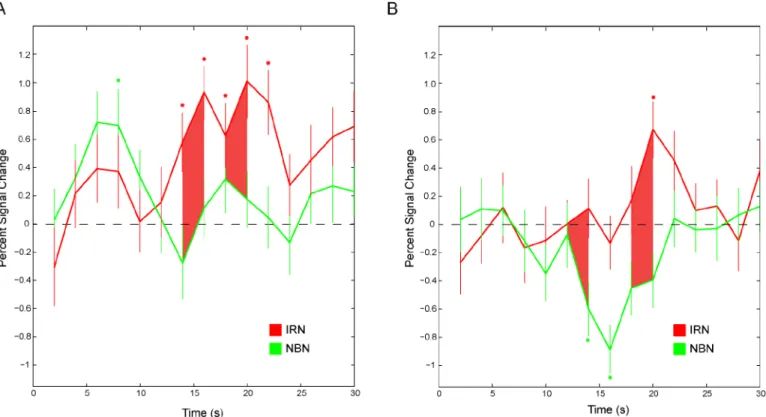
Fig 4. Hemodynamic time courses for bilateral PAF activity averaged across animals.The mean percent signal change in voxels within a 1mm sphere of the peak voxels are plotted for each volume in response to IRN (red) and NBN (green) stimuli. Error bars indicate the standard error of the mean. Points where an individual time course differs significantly from zero are marked by an asterisk while points where the two time courses significantly differ from each other are indicated by shading.
doi:10.1371/journal.pone.0134362.g004
Fig 5. Summary of the areas of cat auditory cortex that respond to pitch-evoking stimuli at the individual-animal level.Individual-level analyses revealed clusters of pitch-related BOLD activity (IRN-NBN contrast) that spread across a number of areas of auditory cortex. Shading marks areas where significant peaks of BOLD activity were located in at least one animal.
that PAF neurons showed narrow, single-frequency tuning curves [26,30], extracellular single-unit recordings have identified a significant proportion of PAF neurons with broader, multi-peaked tuning curves shaped by complex patterns of inhibition [31–32]. Loftus and Sutter [32] also identified PAF neurons that produce long-latency responses to tonal stimuli that are unre-lated to stimulus offset. These late responses might contribute to spectral integration across multiple frequencies, or to the convergence of information from parallel pathways such as those involved in spectral/temporal pitch coding. PAF has repeatedly been shown to be critical to sound localization [33–35]. Thus, one possible role of pitch-sensitive neurons in PAF involves the interpretation of pitch-based localization cues resulting from head-related transfer functions; these cues help to overcome the cone of confusion that remains after interaural dif-ferences are computed (see [36] for review).
In PAF, differences in activity between pitch-evoking and noise stimuli involved a negative BOLD signal in response to narrowband noise in addition to an accompanying increase in BOLD signal in response to IRN. The BOLD signal is a measure of the ratio of oxygenated to deoxygenated blood and is an indirect measure of neural activity; as such the meaning of a neg-ative BOLD signal (relneg-ative to baseline) is not immediately evident. However, a growing body of research suggests that a negative BOLD signal reflects GABA-mediated [37] inhibitory sig-nalling and concurrent arteriolar vasoconstriction across cortical areas [38–40]. Thus, the response to pitch in much ofpes-adjacent cortex appears to reflect a combined sensitivity to pitch-evoking stimuli and suppression of auditory stimuli without pitch.
Pitch-evoked vs. spectrotemporal modulation-evoked activity
Many human studies of pitch perception combine minimally invasive functional imaging tech-niques with IRN stimuli that target temporal cues to elicit the perception of pitch. In the major-ity of these studies, activmajor-ity elicited in response to IRN is contrasted against a spectrally-matched noise stimulus to isolate pitch-related activity [5,41–42]. However, it has been sug-gested that slowly-varying spectrotemporal modulations present in IRN stimuli, but which are unrelated to stimulus pitch may confound interpretation of the IRN-NBN contrast [11]. This is despite evidence that cortical areas identified by the IRN-NBN contrast in humans are also activated by a wide variety of pitch-evoking stimuli that do not contain similar slowly varying modulation [6]. To further examine this issue, an IRNo stimulus was created which contained slow spectrotemporal modulations in the absence of pitch. A contrast between the pitch-evok-ing IRN stimulus and the IRNo stimulus did not reveal significant activity at the group level. A lower level of activity is congruent with the findings of Barker and colleagues [11] who also observed a marked decrease in the number of subjects showing significant differences in BOLD activity between the two stimulus types (10/16 subjects in their IRN-NBN contrast vs. 3/16 for their IRN-IRNo contrast). Moreover, the possibility that some animals included in the current group analysis may have had partially supressed cortical activity due to anesthetic effects may also have led to a more conservative estimate.
Making a case for PAF as the centre of pitch processing
number of factors including anaesthetic effects on cortical activity, as well as the reduced pitch salience of IRN stimuli relative to common pitch-evoking stimuli such as those used for com-munication. Indeed a more robust examination outlining the role of pitch salience would help to address this concern. Finally, the spatial resolution of the current study does not allow for the exclusion of pitch processing at the individual neuron level in areas lower in the auditory hierarchy. Thus, single-cell electrophysiology should be undertaken in an attempt to identify pitch-sensitive neurons in PAF, and to further support the absence of such neurons in primary auditory fields. Localizing pitch-responsive neurons in cat auditory cortex will provide a flexi-ble model in which to examine pitch processing, as well as changes that may occur in response to deprivation and/or the introduction of auditory prostheses.
Acknowledgments
The authors would like to thank Pam Nixon for providing animal care, Joe Gati, Trevor Sze-keres, and Kyle Gilbert for help with MRI protocol and equipment fabrication, and Ewan Mac-pherson for help with stimulus calibration. Funding for this project was provided by the Natural Sciences and Engineering Research Council, the Canadian Institutes for Health Research, and the Canada Foundation for Innovation.
Author Contributions
Conceived and designed the experiments: BEB AJH SGL. Performed the experiments: BEB AJH. Analyzed the data: BEB. Wrote the paper: BEB AJH SGL.
References
1. Oxenham AJ. Pitch Perception. J Neurosci. 2012; 32: 13335–13338. PMID:23015422
2. Langner G, Dinse HR, Godde B. A map of periodicity orthogonal to frequency representation in the cat auditory cortex. Front Integr Neurosci. 2009; doi:10.3389/neuro.07.027.2009
3. Schulze H, Hess A, Ohl FW, Schleich H. Superposition of horseshoe-like periodicity and linear tonoto-pic maps in auditory cortex of the Mongolian gerbil. Eur J Neurosci. 2002; 15: 1077–1084. PMID: 11918666
4. Penagos H, Melcher JR, Oxenham AJ. A neural representation of pitch salience in nonprimary human auditory cortex revealed with functional magnetic resonance imaging. J Neurosci. 2004; 24: 6810– 6815. PMID:15282286
5. Hall DA, Barrett DJK, Akeroyd MA, Summerfield AQ. Cortical representations of temporal structure in sound. J Neurophysiol. 2005; 94: 3181–3191. PMID:16014796
6. Puschmann S, Uppenkamp S, Kollmeier B, Thiel CM. Dichotic pitch activates pitch processing center in Heschl’s gyrus. Neuroimage. 2010; 49: 1641–1649. doi:10.1016/j.neuroimage.2009.09.045PMID: 19782757
7. Butler BE, Trainor LJ. Sequencing the cortical processing of pitch-evoking stimuli using EEG analysis and source estimation. Front Psychol. 2012; doi:10.3389/fpsyg.2012.00180
8. Hall DA, Plack CJ. The human‘pitch center’responds differently to iterated noise and Huggins pitch. NeuroReport. 2007; 18: 323–327. PMID:17435596
9. Hall DA, Plack CJ. Pitch processing sites in the human auditory brain. Cereb Cortex. 2009; 19: 576– 585. doi:10.1093/cercor/bhn108PMID:18603609
10. Barker D, Plack CJ, Hall DA. Human auditory cortical responses to pitch and to pitch strength. Neurore-port. 2011; 22: 111–115. doi:10.1097/WNR.0b013e328342ba30PMID:21178644
11. Barker D, Plack CJ, Hall DA. Reexamining the evidence for a pitch-sensitive region: A human fMRI study using iterated rippled noise. Cereb Cortex. 2012; 22: 745–753. doi:10.1093/cercor/bhr065 PMID:21709174
12. Bendor D, Wang X. The neuronal representation of pitch in primate auditory cortex. Nature. 2005; 436: 1161–1165. PMID:16121182
14. Chung DY, Colavita FB. Periodicity pitch perception and its upper frequency limit in cats. Percept Psy-chophys. 1976; 20: 433–437.
15. Heffner H, Whitfield IC. Perception of the missing fundamental by cats. J Acoust Soc Am. 1976; 59: 915–919. PMID:1262593
16. Peretz I, Ayotte J, Zatorre RJ, Mehler J, Ahad P, Penhune VB, et al. Congenital amusia: A disorder of fine-grained pitch discrimination. Neuron. 2002; 33: 185–191. PMID:11804567
17. Olfert ED, Cross BM, McWilliam AA. Guide to the care and use of experimental animals Vol. 1. No. 2. Ottawa, Canada: Canadian Council on Animal Care; 1993.
18. Dyson DH, Allen DG, Ingwersen W, Pascoe PJ. Evaluation of Acepromazine/ Merperidine/ Atropine premedication followed by Thiopental anesthesia in the cat. Can J Vet Res. 1988; 52; 419–422. PMID: 3196970
19. Brown TA, Joanisse MF, Gati JS, Hughes SM, Nixon PL, Menon RS, et al. Characterization of the blood-oxygen level-dependent (BOLD) response in cat auditory cortex using high-field fMRI. Neuro-image. 2013; 64: 458–465. doi:10.1016/j.neuroimage.2012.09.034PMID:23000258
20. Hall AJ, Brown TA, Grahn JA, Gati JS, Nixon PL, Hughes SM, et al. There’s more than one way to scan a cat: Imaging cat auditory cortex with high-field fMRI using continuous or sparse sampling. J Neurosci Meth. 2014; 224: 99–106.
21. Patterson RD, Handel S, Yost WA, Datta AJ. The relative strength of the tone and noise components in iterated rippled noise. J Acoust Soc Am. 1996; 100: 3286–3294.
22. Klassen LM, Menon RS. Robust automated shimming technique using arbitrary mapping acquisition parameters (RASTAMAP). Magnet Reson Med. 2004; 51: 881–887.
23. Hu X, Kim S-G. Reduction of signal fluctuation in function MRI using navigator echoes. Magnet Reson Med. 1994; 31: 495–503.
24. Langers D, Sanchez-Panchuelo R, Francis S, Besle J, Krumbholz K, Bowtell R, et al. Neuroimaging of tonotopic maps in humans using the travelling wave paradigm: A puzzling finding. Presented at the International Conference on Auditory Cortex, Magdeburg, Germany. 2014.
25. Belin P, Zatorre RJ, Hoge R, Evans AC, Pike B. Event-related fMRI of the auditory cortex. Neuroimage. 1999; 10: 417–429. PMID:10493900
26. Tian B, Rauschecker JP. Processing of frequency-modulated sounds in the cat’s posterior auditory field. J Neurophysiol. 1998; 79: 2629–2642. PMID:9582234
27. Lee CC, Winer JA. Convergence of thalamic and cortical pathways in cat auditory cortex. Hear Res. 2011; 274: 85–94. doi:10.1016/j.heares.2010.05.008PMID:20576491
28. Imig TJ, Reale RA. Patterns of cortico-cortical connections related to tonotopic maps in cat auditory cor-tex. J Comp Neurol. 1980; 192: 293–332. PMID:7400400
29. Reale RA, Imig TJ. Tonotopic organization in the auditory cortex of the cat. J Comp Neurol. 1980; 192: 265–291. PMID:7400399
30. Phillips DP, Orman SS. Responses of single neurons in posterior field of cat auditory cortex to tonal stimulation. J Neurophysiol, 1984; 51: 147–163. PMID:6693932
31. Heil P, Irvine DR. The posterior field P of cat auditory cortex: coding of envelope transients. Cereb Cor-tex. 1998; 8: 125–141. PMID:9542892
32. Loftus WC, Sutter ML. Spectrotemporal organization of excitatory and inhibitory receptive fields of cat posterior auditory field neurons. J Neurosci. 2001; 86: 475–491.
33. Stecker GC, Middlebrooks JC. Distributed coding of sound locations in the auditory cortex. Biol Cybern. 2003; 89: 341–349. PMID:14669014
34. Harrington IA, Stecker GC, Macpherson EA, Middlebrooks JC. Spatial sensitivity of neurons in the ante-rior, posteante-rior, and primary fields of cat auditory cortex. Hear Res. 2008; 240: 2–14.
35. Malhotra S, Lomber SG. Sound localization during homotopic and heterotopic bilateral cooling deacti-vation of primary and nonprimary auditory cortical areas in the cat. J Neurophys. 2007; 97: 26–43.
36. Middlebrooks JC, Green DM. Sound localization by human listeners. Ann Rev Psychol. 1991; 42: 135– 159.
37. Northoff G, Walter M, Schulte RF, Beck J, Dydak U, Henning A, et al. GABA concentrations in the human anterior cingulate cortex predict negative BOLD responses in fMRI. Nat Neurosci. 2007; 10: 1515–1517. PMID:17982452
39. Kastrup A, Baudewig J, Schnaudigel S, Huonker R, Becker L, Sohns JM, et al. Behavioural correlates of negative BOLD signal changes in the primary somatosensory cortex. NeuroImage. 2008; 41: 1364– 1371. doi:10.1016/j.neuroimage.2008.03.049PMID:18495495
40. Schäfer K, Blankenburg F, Kupers R, Grüner JM, Law I, Lauritzen M, et al. Negative BOLD signal changes in ipsilateral primary somatosensory cortex are associated with perfusion decreases and behavioral evidence for functional inhibition. NeuroImage. 2012; 59: 3119–3127. doi:10.1016/j. neuroimage.2011.11.085PMID:22155327
41. Griffiths TD, Uppenkamp S, Johnsrude I, Josephs O, Patterson RD. Encoding of the temporal regularity of sound in the human brainstem. Nat Neurosci. 2001; 4: 633–637. PMID:11369945