www.earth-syst-sci-data.net/2/51/2010/
©Author(s) 2010. This work is distributed under
the Creative Commons Attribution 3.0 License. Open
Access
Science
Data
Assessing the internal consistency of the CARINA
database in the Indian sector of the Southern Ocean
C. Lo Monaco1, M. ´Alvarez2, R. M. Key3, X. Lin3, T. Tanhua4, B. Tilbrook5, D. C. E. Bakker6,
S. van Heuven7, M. Hoppema8, N. Metzl1, A. F. R´ıos9, C. L. Sabine10, and A. Velo9
1LOCEAN-IPSL, Universit´e Pierre et Marie Curie, Paris, France
2IMEDEA, CSIC-UIB, Universitat de les Illes Balears, Esporles, Spain
3Atmospheric and Oceanic Sciences Program, Princeton University, Princeton, USA
4Leibniz-Institut f¨ur Meereswissenschaften, Marine Biogeochemie, Kiel, Germany
5CSIRO Wealth from Oceans Flagship/ACE-CRC, Hobart, Australia
6School of Environmental Sciences, University of East Anglia, Norwich, UK
7Department of Ocean Ecosystems, University of Groningen, Groningen, The Netherlands
8Alfred Wegener Institute for Polar and Marine Research, Bremerhaven, Germany
9Instituto de Investigaciones Marinas – CSIC, Eduardo Cabello 6, Vigo, Spain
10NOAA-Pacific Marine Environmental Laboratory, Seattle, USA
Received: 8 September 2009 – Published in Earth Syst. Sci. Data Discuss.: 9 October 2009 Revised: 16 December 2009 – Accepted: 4 January 2010 – Published: 5 February 2010
Abstract. Carbon and carbon-relevant hydrographic and hydrochemical ancillary data from previously not publicly available cruises were retrieved and recently merged to a new data base, CARINA (CARbon IN the
Atlantic). The initial North Atlantic project, an international effort for ocean carbon synthesis, was extended
to include the Arctic Mediterranean Seas (Arctic Ocean and Nordic Seas) and all three sectors of the South-ern Ocean. Of a total of 188 cruises, 37 cruises are part of the SouthSouth-ern Ocean. The present work focuses
on data collected in the Indian sector (20◦S–70◦S; 30◦E–150◦E). The Southern Indian Ocean dataset covers
the period 1992–2004 and includes seasonal repeated observations. Parameters including salinity, dissolved
inorganic carbon (TCO2), total alkalinity (TA), oxygen, nitrate, phosphate and silicate were examined for
cruise-to-cruise and overall consistency. In addition, data from an existing, quality controlled data base (GLO-DAP) were introduced in the CARINA analysis to improve data coverage in the Southern Ocean. A global inversion was performed to synthesize the information deduced from objective comparisons of deep
measure-ments (>1500 m) at nearby stations (generally<220 km). The corrections suggested by the inversion were
allowed to vary within a fixed envelope, thus accounting for ocean interior variability. The adjustments applied to CARINA data and those recommended for GLODAP data, in order to obtain a consistent merged dataset,
are presented and discussed. The final outcome of this effort is a new quality controlled data base for TCO2
and other properties of the carbon system that can now be used to investigate the natural variability or stability
of ocean chemistry and the accumulation of anthropogenic carbon. This data product also offers an important
new synthesis of seasonal to decadal observations to validate ocean biogeochemical models in a region where available historical data were very sparse.
Data Product Parameter Name
Data Product Flag Name
Exchange File Parameter Name
Exchange File Flag Name
Units
station STANBR
day DATE
month DATE
year DATE
latitude LATITUDE decimal degrees
longitude LONGITUDE decimal degrees
depth meters
temperature CTDTMP ◦C
salinity sf SALNTY SALNTY FLAG W
ctdsal ctdsf CTDSAL CTDSAL FLAG W
pressure CTDPRS decibars
oxygen of OXYGEN OXYGEN FLAG W micromole kg−1 nitrate no3f NITRAT NITRAT FLAG W micromole kg−1 nitrite no2f NITRIT NITRIT FLAG W micromole kg−1 silicate sif SILCAT SILCAT FLAG W micromole kg−1 phosphate po4f PHSPHT PHSPHT FLAG W micromole kg−1 tco2 tco2f TCARBN TCARBN FLAG W micromole kg−1
alk alkf ALKALI ALKALI FLAG W micromole kg−1
Table of parameters directly relevant for this overview. For a list of all properties in the CARINA data base see Key et al. (2009).
Data coverage and parameter measured
Repository-Reference: CARINA.SO.V1.0,
doi:10.3334/CDIAC/otg.CARINA.SO.V1.0
http://cdiac.ornl.gov/ftp/oceans/CARINA/CARINA
Database/CARINA.SO.V1.0/
Available at:
http://cdiac.ornl.gov/oceans/CARINA/Carina inv.html Coverage: 20◦S to 70◦S; 30◦E to 150◦E
Location Name: Indian sector of the Southern Ocean
Date/Time Start: December 1992
Date/Time End: January 2005
1 Introduction
The need for consistent basin-wide data is growing as sci-entists try to address large-scale issues, not only for obser-vational assessments but also as a validation for large-scale
modeling efforts. The availability of accurate historical data
is also critical for assessments of temporal changes. A
ma-jor previous ocean carbon synthesis effort, GLODAP: Global
Data Analysis Project (Key et al., 2004; Sabine et al., 2005), primarily evaluated data from the large international WOCE and JGOFS projects conducted in the 1990’s. Coincidently, a very large data base of hydrographic, nutrients and oxy-gen measurements collected during WOCE cruises combined with pre-WOCE historical data was constructed and qual-ity controlled (Gouretski and Jancke, 2001), so that the pro-posed adjustments could also be applied in GLODAP. The final product was a coherent dataset of carbon and related parameters, publicly available, which has been widely used
(e.g., Feely et al., 2002; Mikaloff-Fletcher et al., 2006;
Mc-Neil et al., 2007; Mikaloff-Fletcher et al., 2007; Vazquez et
al., 2009) and from which major results originated, e.g.,
es-timates of anthropogenic CO2stored in the ocean (Sabine et
al., 2004; Waugh et al., 2006).
More ocean carbon observations were collected since the
WOCE-era thanks to international efforts such as the
Euro-pean Integrated Project CARBOOCEAN, as well as many national initiatives. The development of the CARINA data base dedicated to carbon-relevant cruise data from the North Atlantic Ocean was initiated in 1999 as an essentially in-formal, unfunded project organized by Ludger Mintrop and Doug Wallace (IFM-GEOMAR, Kiel, Germany). It resulted in the assembly of a large collection of previously unavail-able carbon data. In 2006, at a meeting in Laugarvatn
(Ice-land) this effort was strongly intensified under the aegis of
the EU project CARBOOCEAN and the International Ocean Carbon Coordination Project (IOCCP). It was decided that
the CARINA data synthesis effort should be extended to the
whole Atlantic basin, including the Arctic Mediterranean Seas (AMS, which includes the Arctic Ocean and Nordic Seas) and the Southern Ocean. In addition, due to the strong zonal structure of the Southern Ocean, it was considered
most efficient to include the entire circumpolar ocean in the
new synthesis effort. Reasons for this are the poor coverage
of these areas in the previous data synthesis and the recent availability of new data sets. The experience gleaned from
the GLODAP effort was invaluable for the success of the
CA-RINA project and therefore we gladly made use of it in the form of reports and publications, but more importantly by in-volving key people from GLODAP in the CARINA project.
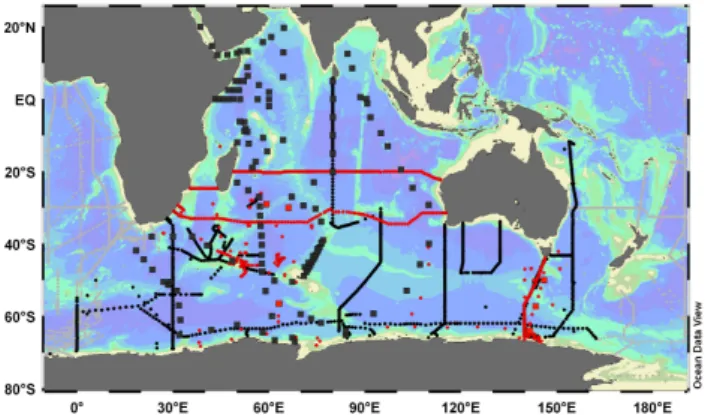
Figure 1. Map of the hydrographic stations where GLODAP and CARINA data were collected. Cruises identified in Table 1 are shown in red for CARINA data (with squares for deep OISO sta-tions). The GLODAP dataset in black includes WOCE lines (cir-cles) and historical data (GEOSECS and INDIGO, squares).
(June 2008) to tune the methodology and evaluate the re-sults. Close contact with the North Atlantic and AMS work-ing groups was maintained throughout the process, both at the above meetings and via separate visits and emails, to en-sure that consistent data processing and evaluation was main-tained among the groups. Still, each group or sub-group had to deal with specific issues. One important issue for the Southern Ocean was the need for extending the data cov-erage in order to obtain enough crossover points for all the new cruises to be evaluated, this was achieved by incorpo-rating the Southern Ocean cruise data from GLODAP to the CARINA dataset (i.e. all processing and computations were done with these data as well). In contrast to the North
At-lantic and AMS groups, it was considered more efficient to
divide the work into three specific Southern Ocean regions, the Atlantic, Indian and Pacific sectors, rather than by param-eters.
This paper presents the cross-check analyses performed with CARINA and GLODAP data from the Indian sector of the Southern Ocean. The dataset is presented first, then the cross-check analyses are described by highlighting any diver-gence from the common procedure and finally the proposed adjustments are presented and discussed.
2 Data coverage
The Southern Indian Ocean dataset consists of data collected during cruises conducted fully or partly in the South Indian
Ocean (south of 20◦S) and the corresponding Antarctic
re-gion between 30◦E and 150◦E (Fig. 1). This dataset
con-sists of new observations from 21 CARINA cruises (Table 1). These observations were not included in the previous GLO-DAP synthesis either because they were collected after the 1990’s (14 cruises) or because they were not available at that time (6 cruises conducted between 1992 and 1999). In
addi-Figure 2.Temporal distribution of the measurements assembled in the Southern Indian dataset(a)by year and(b)by month. For each year or month color bars compare the number of observations for salinity, TCO2, alkalinity, nitrate/silicate, phosphate, oxygen and
CFCs. CARINA data (bright colors) are distinguished from GLO-DAP data (light colors).
tion data from 18 GLODAP cruises were included in the sec-ondary quality control (Table 1), most of which have already been evaluated (Key et al., 2004). Here we used the unjusted data, so that our results can be compared to the
ad-justments applied in GLODAP (http://cdiac.ornl.gov/oceans/
glodap/Indian.htm). Figure 2 shows the time distribution of
the data (year and month of observation). The dataset in-cludes historical data collected at four cruises: GEOSECS (1978), INDIGO1 (1985), INDIGO2 (1986) and INDIGO3 (1987), while all other cruises were conducted after 1990 (mainly over the periods 1993–1996 and 2001–2004). Most of the observations were collected at the summer season (November-March), although about one quarter of the ob-servations were collected in winter both north and south of
the Polar Front (∼50◦S), mainly during September (Fig. 2b).
The dataset includes information on salinity and oxygen measured at all cruises, as well as nutrients (nitrate, phos-phate and silicate) for most of the cruises, dissolved
inor-ganic carbon (TCO2) and total alkalinity (TA). In addition,
pH,pCO2 and transient tracer data were also available for a
limited number of cruises. However, these observations are
Table 1.CARINA and GLODAP cruises assembled in the Southern Indian dataset. CARINA cruises are identified by their cruise number (ID).
ID Cruise expocode Southern Ocean sector Date Ship Chief scientist P.I. for TCO2/Alk
33 09AR19960822 Indian-Pacific 8/22-9/21/1996 A. Australis S. Rintoul B. Tilbrook 34 09AR20011029 Indian-Pacific 11/29-2/11/2001 A. Australis B. Tilbrook B. Tilbrook, C. Sabine 96 35MF19980121 Indian 1/21–2/19/1998 M.-Dufresne N. Metzl C. Lo Monaco 97 35MF19980818 Indian 8/18–9/9/1998 M.-Dufresne N. Metzl C. Lo Monaco 98 35MF19981205 Indian 12/5–12/27/1998 M.-Dufresne N. Metzl C. Lo Monaco 99 35MF19990104 Indian 1/4–2/23/1999 M.-Dufresne M. Denis B. Delille, D. Lef`evre 100 35MF20000117 Indian 1/17–1/27/2000 M.-Dufresne N. Metzl C. Lo Monaco 101 35MF20000719 Indian 7/19–8/16/2000 M.-Dufresne N. Metzl C. Lo Monaco 102 35MF20010103 Indian 1/3–1/26/2001 M.-Dufresne N. Metzl C. Lo Monaco 103 35MF20020104 Indian 1/4–2/1/2002 M.-Dufresne N. Metzl C. Lo Monaco 104 35MF20030123 Indian-Pacific 1/23–2/17/2003 M.-Dufresne N. Metzl C. Lo Monaco 105 35MF20040103 Indian 1/3–2/9/2004 M.-Dufresne N. Metzl C. Lo Monaco 110 49HH19941213 Indian-Pacific 12/13/1994–1/28/1995 Hakuho-Maru K. Kawaguchi, S. Watanabe M. Ishii 111 49HH20011208 Indian-Pacific 12/8/2001–1/19/2002 Hakuho-Maru M. Terazaki M. Ishii 114 49NZ20031209 Indian 12/9/2003–1/24/2004 Mirai M. Fukasawa A. Murata 115 49ZS19921203 Indian-Pacific 12/3/1992–3/19/1993 Shirase N. Sato, R. Maruse M. Ishii 149 61TG20020206 Indian-Pacific 2/6–3/7/2002 Tangaroa T. Odate M. Ishii 150 61TG20030217 Indian-Pacific 2/17–3/12/2003 Tangaroa T. Odate M. Ishii
163 74AB20020301 Indian 3/1–4/15/2002 C. Darwin H. Bryden A. Rios, M. Alvarez 174 74DI20041103 Indian 11/3–12/10/2004 Discovery R. Pollard D. Bakker 175 74DI20041213 Indian 12/13/2004–1/21/2005 Discovery R. Sanders D. Bakker
06AQ19960317 Indian-Atlantic 3/17–5/20/1996 Polarstern E. Fahrbach M. Hoppema 35MF19960220 Indian-Atlantic 2/20–3/22/1996 M. Dufresne A. Poisson A. Poisson 317519950922 Indian 9/22–10/25/1995 M. Baldridge R. Molinari F. Millero 09FA19941112 Indian 11/12–12/5/1994 Franklin M. Tomczak NA 74DI19930206 Indian 2/6–3/18/1993 Discovery R. Dickson J. Robertson 74DI19950106 Indian 1/6–2/21/1995 Discovery R. Pollard NA 74DI19940219 Indian 2/19–3/31/1994 Discovery R. Dickson NA
320619960503 Indian 5/3–7/4/1996 N. B. Palmer J. Swift, T. Whitoorth F. Millero, T. Takahashi 35MF19930123 Indian-Atlantic 1/23–3/9/1993 M. Dufresne A. Poisson A. Poisson
316N19941201 Indian 12/1/1994–1/19/1995 Knorr M. McCartney, T. Whitworth D. Wallace 09AR19941213 Indian-Pacific 12/13/1994–2/2/1995 A. Australis S. Rintoul B. Tilbrook 09AR19930404 Indian-Pacific 4/4–5/9/1993 A. Australis S. Rintoul B. Tilbrook 09FA19930624 Indian-Pacific 6/24–7/17/1993 Franklin J. Church, S. Rintoul NA 09AR19910925 Indian-Pacific 9/25–10/27/1991 A. Australis S. Rintoul NA INDIGO (1985) Indian 2/24–3/1985 M. Dufresne A. Poisson A. Poisson INDIGO (1986) Indian 4/1–4/30/1986 M. Dufresne M. Fieux A. Poisson INDIGO (1987) Indian-Atlantic 1/14–2/20/1987 M. Dufresne N. Metzl A. Poisson GEOSECS IND GEOSECS (st.403–454) 12/4/1977–4/24/1978 Melville R. Williams, H. Craig,
R. Weiss, W. Broecker, D. Spencer
R. Williams, T. Takahashi, C. Keeling
method, and only the seven parameters listed in Table 2 are evaluated in this study. The GLODAP and CARINA data are available at the Carbon Dioxide Information Analy-sis Center (http://cdiac.ornl.gov/oceans/glodap/GlopDV.htm
and http://cdiac.ornl.gov/oceans/CARINA/Carina inv.html).
In addition to metadata that documents measurements per-formed during most of the cruises, a detailed description of the GLODAP and CARINA datasets can be found in Sabine et al. (2005) and Key et al. (2009), respectively, as well as in the other more specialized papers of this special issue.
One important aspect of the cruises conducted in the
Southern Indian Ocean is their sampling strategy.
No-tably some cruises with coarse spatial resolution required
a different procedure for the crossover analysis (compared
to hydrographic section data, see Sect. 3). Among these
are the four historical cruises (GEOSECS and the INDIGO cruises), three Japanese cruises conducted between Aus-tralia and Antarctica (49ZS19921203, 49HH19941213 and 49HH20011208), as well as the nine OISO cruises (Table 2) whose sampling strategy approaches that of “time-series” with summer and winter measurements collected at a few stations visited regularly since 1998 (Jabaud-Jan et al., 2004; Metzl, 2009). While most of the OISO data were collected in the upper 1000 m, at least one deep station (to the bot-tom) was performed during each cruise in the vicinity of previously sampled sites in order to allow data cross-checks (Fig. 1). Similarly, for the CROZEX cruise 74DI20041213,
deep TCO2and alkalinity data (>1500 m) were collected at
Table 2.Number of stations (Nst), number of crossovers (Nx) and final adjustments applied to the CARINA data product and recommended for GLODAP cruises.
Cruise expocode Common name Nst Nx Salinity TCO2 Alkalinity Nitrate Phosphate Silicate Oxygen
(WOCE line) [+] [+] [+] [x] [x] [x] [x] 09AR19960822 (P12) 67 9 0 0 0 1 1 1 0.96 09AR20011029 (SR3 2001) 134 9 0 0 0 1 1.03 0.98 0.98 35MF19980121 OISO1 16 7 0 0 0 NC NA NC 1 35MF19980818 OISO2 14 6 0 −4 −9.0 1 NA 1.04 1
35MF19981205 OISO3 17 13 0 0 0 1 NA 1.04 0.99 35MF19990104 ANTARES4 35 1 0 +43 0 1 NA 1 1 35MF20000117 OISO4 19 13 0 0 NA 0.97 NA 1 1.06 35MF20000719 OISO5 12 13 0 0 0 1.06 NA 0.96 1 35MF20010103 OISO6 11 13 −0.010 0 0 1 NA 0.98 1 35MF20020104 OISO8 13 13 0 +6.5 0 NC NA 1.04 1 35MF20030123 OISO10 10 8 −0.011 0 0 1 1.10 1.14 1
35MF20040103 OISO11 15 10 −0.022 0 0 1 NA 0.95 1.01
49HH19941213 KH94 4 11 8 0 0 −16.1 0.96 0.93 1.03 1
49HH20011208 KH01 3 18 8 0 NC NA 1.04 1.04 1.03 1.04 49NZ20031209a BEAGLE leg5 145 3 0 0 +10 1 1 1 1
49ZS19921203 JARE34 22 8 0 NA NA 1 1.05 0.97 0.98 61TG20020206 JARE43 8 8 0 0 NA 0.98 1.05 1.05 0.97 61TG20030217 JARE44 11 8 +0.005 NA NA 1 NA 1 1 74AB20020301 CD139 (I5) 146 4 0 −4 0 0.98 1 0.98 1 74DI20041103 CROZEX 46 5 0 −4 0 1 0.97 0.90 1
74DI20041213 CROZEX 59 6 0 −4 0 1 1 0.94 1
06AQ19960317a (S4A/A12) 100 3 0
−4 NA 1.02 1 1.05 1.01
35MF19960220a CIVA2 (I6b) 88 6 0 0 0 0.96 0.97 0.90 1
317519950922a (IR4) 100 5 0 0 0 1 1 1 1
09FA19941112 (S5) 68 0 NC NC NC NC NC NC NC 74DI19930206a (I8A/S4) 25 8 0 NA NA 1 1 1 0.96
74DI19950106a (ISS1i) 103 6 0 NA NA 1.03 0.98 1.11 1
74DI19940219 (ISS1h) 32 6 0 NA NA 1 1.02 1.02 1.01 320619960503a (S4I) 108 7 0 0 0 1 1 1 1
35MF19930123a CIVA1 (I6) 52 4 0 0 0 0.98 0.98 0.98 1
316N19941201a (I8S/I9S) 143 7 0 0 0 1 1 1 1
09AR19941213 (SR3/S4) 106 13 0 0 0 1 1 1.03 1 09AR19930404 (P11A) 62 5 −0.010 0 NA 1 0.98 1.07 1.03 09FA19930624 (P11S) 74 3 0 NA NA 0.92 0.95 0.98 0.99 09AR19910925 (SR3) 26 8 0 NA NA 1 0.93 1 1.02 INDIGO (1985) INDIGO1 25 12 0 −10.3 −16 1 0.98 1 1 INDIGO (1986) INDIGO2 49 1 0 0 +7 NC NC NC NC INDIGO (1987) INDIGO3 43 15 0 −5.5 0 1.02 0.97 0.95 1
GEOSECS IND GEOSECS (st.403–454) 51 5 0 −23 0 1 1 1 1
Adjustments are additive for salinity, TCO2(µmol/kg) and alkalinity (µmol/kg) and multiplicative for nitrate, phosphate, silicate and oxygen. NA stands for Not Available and NC stands for Not Considered.
aIdentified as core-cruise for the final inversion (see Sect. 3.3).
historical cruises. Finally, for the trans-Indian Ocean cruise
74AB20020301, measurements of TCO2were performed at
four stations (crossovers with WOCE lines). These
measure-ments were used to check that TCO2calculated from
alkalin-ity and pH is consistent with GLODAP data.
Some of the cruises evaluated in this study are shared with the Atlantic and Pacific sectors of the Southern Ocean (as identified in Table 1). For those cruises the results ob-tained in the Indian sector are presented in Sect. 4 and
3 Quality control procedure and methods
A common quality control procedure was developed for all CARINA regions. It can be divided into three successive steps: i) crossover analyses comparing deep measurements collected at nearby stations during two different cruises in or-der to detect any systematic offset, ii) evaluation of the cruise to cruise differences (offsets), parameter by parameter, in or-der to identify the cruises that could require an adjustment, and iii) adjustments are applied and crossover analyses of deep measurements are performed again to check the inter-nal consistency of the dataset after correction. Details about the common methodology can be found elsewhere (Tanhua et al., 2009). In this section a brief description of the meth-ods is given for the purpose of highlighting any divergence from the common procedure.
3.1 Initial crossover analyses
Crossover analyses are objective comparisons of deep water data (>1500 m) collected in the same area during two diff er-ent cruises. The station distribution was such that the def-inition of the crossover area was variable and defined sub-jectively on a case by case basis: the area considered by de-fault was a circle with a 222 km radius around a sampling station, but it could be decreased in frontal regions or in-creased in homogeneous deep waters. In cases when the crossover area covered different hydrological regions (e.g. re-peated cruise lines), the crossover was separated into two
or more clusters. The mean offset between data from two
cruises is estimated by comparing the mean profiles gener-ated for each cruise by averaging deep measurements found in a crossover area (or cluster) along isopycnal surfaces, as described by Tanhua et al. (2009). Crossover plots and statistics were first generated manually in order to allow the
operator to change the settings when appropriate. Then,
similar analyses were performed using an automated (ob-jective) method (see Tanhua et al., 2009) but, because this method requires at least three stations per cruise to produce statistics, not all crossovers could be evaluated in this way. Most, but not all, crossovers were evaluated using the man-ual routine (due to time limitations and the addition of more cruise data after the initial manual checks). However, the results of the manual and automatic routines were gener-ally in good agreement (see for example Fig. 3 in Tanhua et al., 2009). All the manually and automatically gener-ated crossover plots can be found on the CARINA website
(http://cdiac.ornl.gov/oceans/CARINA/CARINA QC.html).
The 39 cruises in the South Indian Ocean and corre-sponding Antarctic sector (Table 1) generate a total of 133
crossovers. These include 57 crossovers comparing
CA-RINA data with GLODAP data, 48 CACA-RINA-CACA-RINA crossovers and 28 GLODAP-GLODAP crossovers. All the crossovers that involve at least one of the CARINA cruises were evaluated manually, as well as most of those
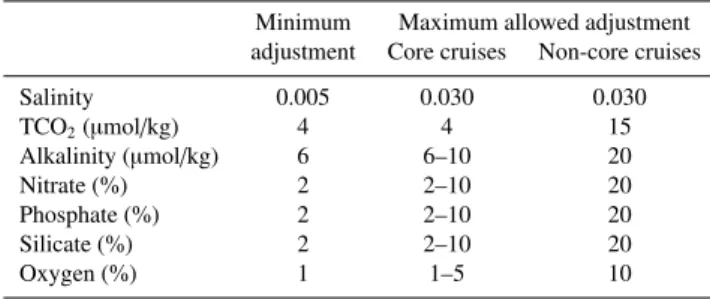
involv-Table 3. Minimum adjustment applied to the data product and the maximum allowed adjustment in the Weighted Damped Least Square (WDLSQ) inversions for core cruises identified in Table 2 and non-core cruises.
Minimum Maximum allowed adjustment adjustment Core cruises Non-core cruises Salinity 0.005 0.030 0.030 TCO2(µmol/kg) 4 4 15
Alkalinity (µmol/kg) 6 6–10 20
Nitrate (%) 2 2–10 20 Phosphate (%) 2 2–10 20 Silicate (%) 2 2–10 20 Oxygen (%) 1 1–5 10
ing two GLODAP cruises. All the crossovers that include at least three stations per cruise were also evaluated using the automatic routine, but because the Southern Indian Ocean dataset includes a large number of cruises with coarse spa-tial resolution (16 cruises out of 39), many crossovers could not be evaluated this way. Among these are the nine OISO cruises (Table 1) which were totally excluded from the au-tomatic analysis. For the other cruises with relatively coarse spatial resolution, at least one crossover area was found to satisfy the minimum of three stations required for running the automatic routine. For crossovers that include only one or two stations the plots and statistics were generated
man-ually in a way different from the automatic method in the
sense that the statistics are not comparable: for crossovers with at least three stations per cruise the error associated
with the mean offset reflects the standard deviation around
each cruise’s mean profile (Tanhua et al., 2009), whereas for crossovers with only one or two stations per cruise the
er-ror is given by the standard deviation of the mean difference
between the two profiles.
3.2 Inversion and regional analysis
The information deduced from the crossover analyses can be synthesized by using an inverse method in order to determine the adjustments required for maximizing the internal con-sistency of the dataset (Johnson et al., 2001; Tanhua et al., 2009). Results from the automatically generated crossovers were used to perform a global Southern Ocean inversion, also including the Atlantic and Pacific sectors (Hoppema et al., 2009; Sabine et al., 2009). Weighted Least Squares (WLSQ) and Weighted Dampened Least Squares (WDLSQ) methods were used for the inversions (Tanhua et al., 2009). The first method uses the standard deviation associated with
each crossover and the time difference between the cruises
adjustments of individual cruises on cost of the overall per-formance of the model (Johnson et al., 2001). For the South-ern Ocean, a first inversion was performed using both meth-ods and no core-cruise for the WDLSQ inversion. The cor-rections proposed by these two inversions were evaluated and compared with those deduced from manually generated crossovers. This comparison shows a better agreement with results from the WDLSQ inversion than with the less com-plex WLSQ method. Consequently, only the results from the WDLSQ inversion are presented and discussed in the follow-ing sections.
The advantage of using an inversion to identify the cruises that could require an adjustment is that the whole Southern Ocean dataset was treated as one. A major problem is that,
because the inversion is carried out using the crossover off
-sets generated automatically, it does not include crossovers with less than three stations per cruise and consequently the nine OISO cruises are not evaluated by the inversion. In
or-der to evaluate these nine cruises a different method had to
be used based on the manually generated crossovers. This al-ternative method, referred to as “regional analysis”, consists in identifying a set of reliable cruises for a given parameter and to use those cruises as a reference to deduce any adjust-ment that could be required for the other cruises. It should be noted that another alternative would have been to include those particular cruises in the inversion by using the infor-mation obtained from the manually generated crossovers, but we decided otherwise, because the statistics that are used to weight the inversion are not comparable (Sect. 3.1). In addi-tion it is valuable that the regional analysis and the Southern Ocean inversion remain two independent results, the first
be-ing a “manual” analysis based on crossover offsets generated
manually, while the second is a fully automated procedure. Adjustments were determined by comparing the correc-tions deduced from the regional analysis with the results of the WDLSQ inversion when possible. Parameters were eval-uated cruise by cruise, and only corrections above a defined threshold were considered (Table 3). When the regional anal-ysis and inversion agreed by suggesting a correction (no cor-rection), an adjustment (no adjustment) was applied. Oth-erwise crossover results were carefully examined in order to collect evidence that might support one or the other sug-gestion. In a few cases we made no recommendation (NC in Table 2) and the data were not corrected, either because the evidence for an adjustment was poor (only one or two crossovers), or because the proposed correction was sus-pected to be biased (in regions where large horizontal gra-dients are observed at depth).
3.3 Final check
The last step consists in evaluating the improvement in data
coherence after the adjustments were applied. This was
done by performing new crossover analyses of deep data (af-ter data adjustment) using the automatic routine (Tanhua et
al., 2009) and a final Southern Ocean inversion (WDLSQ method, with cocruises identified in Table 2). The
re-sults were evaluated in order to detect any remaining offset
in the CARINA-GLODAP merged dataset. In most cases
the offsets that were detected after data adjustment had
al-ready been detected with the initial inversion but no adjust-ment was applied to the data based on the evidence presented in Sect. 4. In such cases the crossovers generated before and after data adjustment were carefully examined and the evi-dence for or against an adjustment was re-evaluated. Cruise data that were adjusted before this stage of the analysis are listed in Sect. 4. In a few cases the initial recommendation was revised, so adjustments were only considered final after this last check (Table 2).
4 Adjustments
The final adjustments applied to CARINA data in the In-dian sector of the Southern Ocean and those recommended for GLODAP data for improving the internal consistency of the CARINA-GLODAP merged dataset are reported in
Table 2. These adjustments result from a critical
analy-sis of the corrections proposed by the WDLSQ inversion
based on automatically generated crossovers and/or those
de-duced from the regional analysis based on manually gener-ated crossovers. The results of the initial crossover analysis (uncorrected data) are presented in Fig. 3 and compared to those proposed by the final inversion (after data correction), as well as those applied in GLODAP (Key et al., 2004). The decision for or against an adjustment is detailed on the CA-RINA website for all the cruises and parameters listed in
Ta-ble 2 (http://cdiac.ornl.gov/oceans/CARINA/CARINA QC.
html) (Tanhua et al., 2009). Here, the main results of the initial crossover analysis and the final inversion are summa-rized parameter by parameter, with more emphasis on cruises identified for correction. Each section is organized as fol-lows. The initial crossover analysis is presented first. The corrections proposed by the initial inversion are discussed and compared to those deduced from the regional analysis and a decision is made based on the best available evidence. For the cruises not evaluated in the inversion, the results of the regional analysis are presented in more detail. Finally, the results of the final inversion are presented and discussed (when CARINA and GLODAP cruise data are adjusted fol-lowing the initial recommendations).
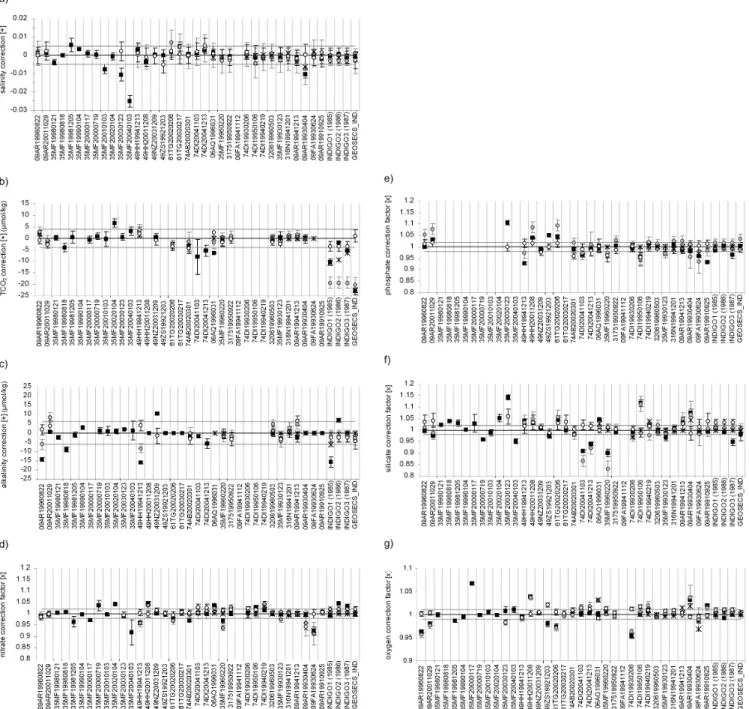
Figure 3.Corrections (additive) and correction factors (multiplicative) obtained from different methods for(a)salinity(b)TCO2,(c)
alkalin-ity,(d)nitrate,(e)phosphate,(f)silicate and(g)oxygen. Results obtained with the WDLSQ inversion before and after data correction (gray and white dots, respectively) and from the regional analysis (black squares) are compared with previous estimates (GLODAP corrections, black crosses). Only adjustments above a defined threshold were considered for correction (salinity: 0.005, TCO2: 4µmol/kg, alkalinity:
6µmol/kg , nutrients: 2% and oxygen: 1%).
relatively coarse spatial resolution (GEOSECS, INDIGO, 49ZS19921203, 49HH19941213 and 49HH20011208), at least one crossover area was found to satisfy the minimum of three stations allowing one or more automatic crossovers for each cruise. For some of the cruises this information was
one single cruise. This would have no consequence if the
three INDIGO data sets had no (or a similar) offset. A
pre-vious study suggested different offsets for TCO2 and
alka-linity (Sabine et al., 1999), and it is likely that the inversion failed at least for these two parameters. In addition, the cor-rections deduced from the regional analysis for the cruise IN-DIGO2 should also be considered with care because only one crossover was found for this cruise (Table 2). The same holds for the results for cruise 35MF19990104 (ANTARES4), re-sults were obtained by increasing the size of the crossover area in order to include stations sampled during INDIGO1
(located about 5◦ to the west of the ANTARES4 site). For
09FA19941112, no crossover was found with any of the other
cruises assembled in the dataset. No recommendation is
made for this cruise in Table 2.
4.1 Salinity
4.1.1 Initial crossover analysis – salinity
Salinity was measured during all the cruises in the CARINA-GLODAP merged dataset. Since international standards are used for salinity measurements, one can expect to find very
few offsets. A total of 133 crossovers were generated with
salinity data for the cruises listed in Table 2. Most of them were generated both manually (127 crossovers) and using the automatic (common) routine (85 crossovers). The correc-tions deduced from the regional analysis (based on manually generated crossovers) and the WDLSQ inversion (based on automatically generated crossovers) are compared in Fig. 3a. A good agreement is obtained for most of the cruises. When a small disagreement exists, the inversion generally suggests a larger correction than the one deduced from the regional analysis. Most of the GLODAP cruises have already been
checked for offsets in salinity (Gouretski and Jancke, 2001;
Johnson et al., 2001). The corrections (no correction) applied in GLODAP (Key et al., 2004) are in very good agreement with those deduced from the present analysis (Fig. 3a).
The automatic routine generated 85 crossovers and only
15 of them show a significant offset in salinity (>0.005).
The inversion identified only three cruises that should be considered for correction: 61TG20020206, 61TG20030217 and the GLODAP cruise 09AR19930404. The result of the inversion for cruise 61TG20020206 is surprising, as it is
based on eight crossovers that show no systematic offsets
compared to cruises that are thought to have good salinity data. This suggests that no correction would be required, in good agreement with the conclusion of the regional analy-sis. Consequently no adjustment is applied to salinity mea-surements for this cruise (Table 2). For the other cruises, 61TG20030217 and 09AR19930404, an adjustment is ap-plied based on the good agreement between the inversion and the regional analysis (and the GLODAP correction for cruise 09AR19930404).
More crossovers were generated manually and again
rela-tively few offsets were detected (35 crossovers out of 126),
which makes it easy to identify the cruises that could require an adjustment. In addition to those already mentioned, four OISO cruises not evaluated in the inversion were identified for salinity correction (35MF19981205, 35MF20010103,
35MF20030123 and 35MF20040103, Fig. 3a). For each
OISO cruise between 8 and 13 crossovers found north and south of the Polar Front were analyzed. For the nine OISO cruises evaluated in this study salinity data recorded by the CTD (Conductivity-Temperature-Depth) sonde was used rather than bottle salinity, because measurements were not performed at all sampling depths. However, the few mea-surements that were performed at each station were used to check and eventually to correct the continuous salinity profile derived from the CTD sensor. Consequently similar
offsets would be detected using either CTD or bottle
salin-ity (i.e., any adjustment detected for CTD data also applies to salinity measurements). For the cruises 35MF20030123 and 35MF20040103, all crossovers show systematic and
co-herent offsets, leading to the adjustments reported in
Ta-ble 2. For the two other OISO cruises mentioned above (35MF19981205 and 35MF20010103) it is likely that ocean interior variability also played a role, which would explain that different offsets are detected north and south of the Po-lar Front. Higher confidence is given to the station in the
subtropical region (30◦S) than the one located at 56◦S
be-cause deep data are generally more noisy south of the Po-lar Front, probably due to Po-larger horizontal gradients in deep waters. Therefore, no adjustment is applied to salinity for these two cruises (35MF19981205 and 35MF20010103)
de-spite the offset detected at 56◦S in December 1998.
4.1.2 Final inversion – salinity
Based on the initial crossover analysis, salinity data from five cruises were adjusted prior to the final
analy-sis: 35MF20010103 (−0.010), 35MF20030123 (−0.011),
35MF20040103 (−0.022), 61TG20030217 (−0.005) and
09AR19930404 (−0.011). Only small corrections are
pro-posed by the final inversion, either below or close to the limit of 0.005 (Fig. 3a). The largest corrections are pro-posed for cruises 49ZS19921203 and 74DI20041213, while for all other cruises the proposed correction is below 0.003. Low confidence is given to the result of the inversion for cruise 49ZS19921203, because it is based on one crossover only, whereas the regional analysis is based on the analysis of eight crossovers that show no significant offset in salinity for this cruise. For cruise 74DI20041213 the regional anal-ysis is based on six reliable crossovers that indicate an
av-erage correction of+0.003±0.002, which is in good
agree-ment with the result of the two inversions (+0.004±0.008
initially and+0.005±0.004 after data correction). This
slightly low, but the correction is too small to justify an ad-justment (Table 2).
4.2 TCO2
4.2.1 Initial crossover analysis – TCO2
TCO2 was measured during 32 cruises out of 39
(Ta-ble 2), resulting in a total of 80 crossovers. The histori-cal cruises (GEOSECS and INDIGO) were conducted be-fore the use of Certified Reference Material (CRM, intro-duced by A. G. Dickson, Scripps Institution of Oceanogra-phy, in 1991). In addition, the crossovers south of the
Po-lar Front (∼50◦S) must be considered with care, because a
small increase in TCO2 can be expected in Antarctic deep
waters due to anthropogenic CO2that has penetrated deeply
in the Southern Ocean (Lo Monaco et al., 2005a, b; Vazquez et al., 2009). For all other cruises, one can expect to detect
only small offsets. And indeed near-zero corrections are
de-duced from the inversion and the regional analysis for most of the cruises (Fig. 3b). Still, seven of them could require an adjustment, as discussed below. Figure 3b also shows a very good agreement between the results of the inversion and the regional analysis, as well as with the corrections (no cor-rection) proposed in previous studies (GLODAP corrections taken from Sabine et al. (1999), Lamb et al. (2003) and Wan-ninkhof et al. (2003)).
Only half of the 80 crossovers were generated automat-ically and used in the inversion (41 crossovers). Despite the relatively large number of crossovers showing a signif-icant offset in TCO2(20 crossovers>4µmol/kg), the inver-sion identified only four cruises that should be considered for correction: the three INDIGO cruises and GEOSECS.
An adjustment of−23µmol/kg is applied to GEOSECS data
in the view of the close agreement found between the in-version, the regional analysis and the adjustment applied in
GLODAP (−22.5µmol/kg). The inversion suggests that the
INDIGO cruises may require an adjustment, but the correc-tion proposed by the inversion is disregarded because IN-DIGO was evaluated as one single cruise. Instead, the adjust-ments reported in Table 2 result from the regional analysis that evaluated the three cruises individually. The adjustments
applied to TCO2 data from INDIGO1 (−10.3µmol/kg) and
INDIGO3 (−5.5µmol/kg) are in good agreement with those
applied in GLODAP (−10.7µmol/kg and −6.4µmol/kg,
re-spectively). No adjustment is applied to TCO2 data from
INDIGO2 based on the comparison with data from the BEAGLE cruise (49NZ20031209) and with INDIGO1 data. This result contradicts the adjustment applied in GLODAP
(−9.4µmol/kg). The inversion and the regional analysis
also disagree for two other cruises, the GLODAP cruise 06AQ19960317 and the CARINA cruise 74AB20020301. For the cruise 06AQ19960317, no correction is proposed by the inversion, in agreement with GLODAP. However, the careful analysis of crossovers found in the Indian sector (this
study) and the Atlantic sector (Hoppema et al., 2009)
sug-gests that a small correction would be required (−6µmol/kg
and −4µmol/kg, respectively). The lowest correction
de-duced from data in the Atlantic sector is preferred, because only three crossovers are found in the Indian sector and all
three are located near 50◦S at the Indian-Atlantic boundary,
a region subject to large interannual variability. For cruise 74AB20020301, the regional analysis suggests a small cor-rection of−3.3µmol/kg, below the limit of 4µmol/kg. Since the inversion suggested no correction, no adjustment was ap-plied at first. This result was modified after the final inver-sion which suggests a correction of−4.4 (±1.6)µmol/kg, in
agreement with the PI’s recommendation to decrease TCO2
by 4µmol/kg ( ´Alvarez et al. 2009).
Through the regional analysis, we identified five cruises not evaluated by the inversion, that could require an
adjustment: two OISO cruises (35MF19980818 and
35MF20020104), the ANTARES4 cruise (35MF19990104)
and the two CROZEX cruises (74DI20041103 and
74DI20041213). Between five and thirteen crossovers
were analyzed for each OISO cruise. These show systematic
offsets for two cruises with crossovers either north of the
Polar Front only (35MF19980818) or north and south of the Polar Front (35MF20020104), leading to the adjustments
re-ported in Table 2. The large offset detected for ANTARES4
(−43±2µmol/kg) is surprising given that CRM was used.
Nevertheless, it is supported by TCO2calculated from
alka-linity and pH that is higher than the measured TCO2 by 29
(±8)µmol/kg (B. Delille, 2009, personal communication).
The CROZEX cruises 74DI20041103 and 74DI20041213 were conducted back to back (Bakker et al., 2007) and no
offset was detected between these two cruise data. Three
other crossovers are found for these two cruises, with three historical cruises: INDIGO1, INDIGO3 and GEOSECS, all
known to have high TCO2data (Table 2). When this is taken
into account all three crossovers suggest that the CROZEX
TCO2data are higher than the corrected historical data. The
correction proposed for the two CROZEX cruises range
from 4 to 13µmol/kg, which reflects the uncertainty of the
historical data. The smallest correction is applied (Table 2).
4.2.2 Final inversion – TCO2
Based on the initial crossover analysis, TCO2 data from
eight cruises were adjusted prior to the final analysis:
the CARINA cruises 35MF19980818 (−4µmol/kg),
35MF19990104 (+43µmol/kg), 35MF20020104
(+6.5µmol/kg), 74DI20041103 (−4µmol/kg) and
74DI20041213 (−4µmol/kg) and the GLODAP cruises
INDIGO1 (−10.3µmol/kg), INDIGO3 (−5.5µmol/kg) and
GEOSECS (−23µmol/kg). The inversion performed after
data correction suggests that a significant offset could remain for one cruise: 74AB20020301 (Fig. 3b). For this cruise it was decided to revise the initial result (no adjustment) to
between the result of the final inversion (−4.4±1.6µmol/kg)
and an independent analysis performed by ´Alvarez et
al. (2009) who concluded that calculated TCO2 data should
be decreased by 4µmol/kg. The regional analysis also
de-tected high TCO2measurements for this cruise, but a smaller
correction was proposed (−3.3±3.3µmol/kg) whereas the
initial inversion proposed no correction (−1.3±3.9µmol/kg). A correction of−18 (±2)µmol/kg, is suggested by the fi-nal inversion for cruise 35MF20030123 (result not shown in Fig. 3b), but it is disregarded because it was obtained
using TCO2 data not adjusted to CRMs. When CRM
ad-justed TCO2 is used (data in the individual cruise file), no
offset is detected. Consequently no adjustment is applied
(Table 2). The inversion suggests a correction factor close
to the limit of 4µmol/kg for the INDIGO cruises. This result
is based on four crossovers generated after data correction
which show an offset of+4±5µmol/kg for cruise INDIGO2
(crossover with GEOSECS), but no significant offset for the
cruises INDIGO1 and INDIGO3. The latter gives support to the adjustments recommended for these two cruises (Ta-ble 2), in agreement with the adjustments applied in
GLO-DAP (−10.7µmol/kg and−6.4µmol/kg, respectively). For
INDIGO2, comparison with TCO2 data from the BEAGLE
cruise led to no adjustment before the final inversion. Be-cause good confidence is given to this result, no further change is made (Table 2), which disagrees with the
GLO-DAP correction of−9.4µmol/kg (Sabine et al., 1999).
4.3 Alkalinity
4.3.1 Initial crossover analysis – alkalinity
Alkalinity was measured at 27 cruises out of 39 (Table 2),
re-sulting in a total of 61 crossovers. As for TCO2, CRMs were
used for alkalinity measurements during most of WOCE
and post-WOCE cruises. However, CRM analyses for
alkalinity were not made on early cruises (INDIGO and GEOSECS), and on CARINA cruises 49HH19941213 and 09AR19960822, whereas CRMs were used on these two
cruise for TCO2 measurements. Thus, biases are likely
for these cruises, as suggested in Fig. 3c for three of them (49HH19941213, INDIGO1 and INDIGO2). Figure 3c also shows that a good agreement exists between the results of the inversion and the regional analysis for about half of the cruises evaluated by the two methods. For some of the GLO-DAP cruises, a third independent result is available (GLO-DAP corrections taken from Sabine et al., 1999; Lamb et al., 2003; and Wanninkhof et al., 2003), which shows a better agreement with the results from the regional analysis com-pared to the inversion.
Less than half of the 61 crossovers were generated au-tomatically and used for the inversion (26 crossovers).
Only ten of them show a significant offset in
alkalin-ity (>5µmol/kg). Thus the inversion identifies three
cruises that should be considered for alkalinity correction:
09AR19960822, 09AR20011029 and 49HH19941213. For all three cruises the corrections proposed by the
inver-sion and those deduced from the regional analysis differ
by about 8µmol/kg. Good evidence supports the results
from the regional analysis, including the recommendation by the data PIs. Consequently, no adjustment is applied for cruise 09AR20011029, while alkalinity is decreased by
13.7µmol/kg for cruise 09AR19960822 and by 16.1µmol/kg
for cruise 49HH19941213 (Table 2). Importantly, TCO2and
alkalinity data from cruise 09AR19960822 were updated af-ter the crossover analysis (data corrected for a titration cell
volume error), and the final data show no offset compared to
data from cruise 09AR20011029. Consequently, preliminary data were adjusted prior to the final inversion, but no adjust-ment is applied to the final data in the data product (Table 2). The inversion suggests no correction for the historical cruises (GEOSECS and INDIGO). For GEOSECS this is in good agreement with the regional analysis and GLO-DAP corrections (Sabine et al., 1999). Therefore no
ad-justment is applied to GEOCSECS alkalinity data. The
adjustments applied to INDIGO data are based on the re-gional analysis. For INDIGO1, a larger adjustment is
ap-plied here (−16µmol/kg) than in GLODAP (−6.5µmol/kg,
Sabine et al., 1999). Good confidence is given to the larger adjustment, as more crossovers are now available, includ-ing six crossovers with CARINA cruises thought to have
good alkalinity data and that show offsets ranging from 14 to
20µmol/kg. For INDIGO2, only one crossover was found,
suggesting a correction of +7µmol/kg, which supports the
adjustment applied in GLODAP (+6.8µmol/kg, Sabine et al.,
1999). For INDIGO3, crossovers found north of the Polar Front suggest no correction, in good agreement with GLO-DAP (Sabine et al., 1999). However, the seven crossovers
south of the Polar Front show offsets increasing with time:
from about −6µmol/kg over a 9 years-period (with cruise
320619960503) to−17µmol/kg over a 17 years-period (with
cruise 35MF20040103). This signal is attributed to ocean variability in the complex polar frontal region and conse-quently no adjustment is applied to INDIGO3 alkalinity data. Two other cruises not evaluated in the inversion were iden-tified for alkalinity correction by the regional analysis: the OISO2 cruise (35MF19980818) and the BEAGLE cruise
(Leg 5: 49NZ20031209). As for INDIGO3, the offset
de-tected at 56◦S for OISO2 is disregarded and instead, an
ad-justment of−9µmol/kg is applied based on crossovers found
north of the Polar Front (Table 2). For the BEAGLE cruise,
the correction proposed (+10µmol/kg) agrees with a
previ-ous analysis conducted by the data PIs who concluded that alkalinity measured along the Indian line (Leg 5) are
system-atically lower by 5 to 10µmol/kg compared to WOCE data
4.3.2 Final inversion – alkalinity
Based on the initial crossover analysis, alkalinity data from six cruises were adjusted prior to the final analysis:
pre-liminary data from cruise 09AR19960822 (−13.7µmol/kg),
the CARINA cruises 35MF19980818 (−9µmol/kg),
49HH19941213 (−16.1µmol/kg), 49NZ20031209
(+10µmol/kg) and the GLODAP cruises INDIGO1
(−16µmol/kg) and INDIGO2 (+7µmol/kg). The final inver-sion still suggests an additional adjustment for one cruise: 09AR19941213 (Fig. 3c). Since no adjustment was applied to these data, the correction suggested by the final inversion (+6±3µmol/kg) is close to the result of the initial inversion
(+5±3µmol/kg). The regional analysis also suggested a
small correction for data collected between 130◦E–150◦E
(+4µmol/kg), but no offset was detected for data collected
between 110◦E–120◦E. Consequently, no change is made to
the initial result (no adjustment), because it is likely that the
signal detected at 130◦E–150◦E reflects ocean variability.
Similar to TCO2, the correction of−6 (±3)µmol/kg sug-gested by the final inversion for cruise 35MF20030123 (re-sult not shown in Fig. 3c) is disregarded because it was ob-tained using alkalinity data not adjusted to CRMs. When CRM adjusted alkalinity is used (data in the individual cruise
file), no offset is detected, and consequently, no adjustment
is applied (Table 2).
4.4 Nitrate
4.4.1 Initial crossover analysis – nitrate
Nitrate was measured on all the cruises. No international ref-erence material existed for nutrient measurements and, as a
result, offsets were detected in many crossovers. A total of
131 crossovers were found and 125 of them were generated
manually, half of which show significant offsets in nitrate
(>2%). Most of the cross-overs were also generated auto-matically and used in the inversion (84 crossovers, including 42 that show a significant offset in nitrate). The large number
of significant offsets complicates the task of identifying the
cruises that could require an adjustment. Nevertheless, the results of the regional analysis and the inversion are in good agreement for about two thirds of the cruises evaluated by the two methods (Fig. 3d). For most of the GLODAP cruises, a third independent result is available (Gouretski and Jancke, 2001 and L. Gordon and C. Mordy, 2003, personal commu-nication), which shows a better agreement with results from the regional analysis than with the inversion (Fig. 3d).
Ad-ditive corrections (Cadd) taken from Gouretski and Jancke
(2001) were converted into correction factors (Cmul)
follow-ing Eq. (1), with a mean concentration (C) of 32µmol/kg .
Cmul=1+(Cadd/C) (1)
The inversion identifies ten cruises for nitrate correction:
49HH19941213, 49HH20011208, 61TG20020206, and
the GLODAP cruises 06AQ19960317, 35MF19960220,
317519950922, 74DI19940219, 35MF19930123,
09AR19930404 and 09FA19930624. The correction
factors proposed for five of them are in good agreement with those deduced from the regional analysis. The corre-sponding adjustments are applied to nitrate data from those cruises (49HH19941213, 49HH20011208, 61TG20020206, 06AQ19960317 and 09FA19930624). A good agreement is also found for cruise 74DI19940219, but no adjustment is applied for two reasons: i) three crossovers of this cruise with cruises that are thought to have good nitrate data (74DI20041103, 74DI20041213 and 74DI19930206) show
no systematic offset and ii) the proposed correction is close
to the limit of 2%. Disagreement between the results from the regional analysis and the inversion exist for four cruises. For two of them, 35MF19960220 and 35MF19930123, the inversion proposes a larger correction (0.94 and 0.97, respectively) than the regional analysis (0.95–0.98 and 0.98–1.00, respectively). The scatter in the results of the regional analysis probably reflects both interannual and spatial variability, as some of the crossovers are located
around 40◦S at the Indian-Atlantic boundary, a region
where deep eddies have been observed (Lo Monaco et al., 2005a), while other crossovers are located in the frontal
region (∼50◦S) where large horizontal gradients exist.
Nevertheless, the results of the regional analysis are in good agreement with those obtained in the Atlantic sector (0.95 for cruise 35MF19960220 and 0.98 for cruise 35MF19930123) (Hoppema et al., 2009). The latter adjustment is applied to nitrate data from cruise 35MF19930123 (Table 2), whereas for cruise 35MF19960220 the correction factor has been re-evaluated to 0.96 in the final check (see Sect. 4.4.2). For cruises 317519950922 and 09AR19930404 no adjustment is applied based on the analysis of nine crossovers, including
six crossovers that show no offset with cruises that are
thought to have good nitrate data.
Two other cruises, 74AB20020301 and 74DI19950106 have discrepancies between the crossover analyses. The in-version proposes no correction, whereas the regional analy-sis suggests a small correction. The result of the inversion for cruise 74DI19950106 is surprising, as it is not coherent with the analysis of the five automatically generated crossovers used in the inversion for this cruise: all crossovers show low nitrate for this cruise and two of them involve cruises that are thought to have good nitrate data (74DI20041103 and 74DI20041213). For this reason the correction factor of 1.03 deduced from the regional analysis for cruise 74DI19950106 is applied. An adjustment is also applied to nitrate data from the first cruise mentioned above (74AB20020301) based on the good agreement between the correction factor deduced from the regional analysis and an independent analysis per-formed by the data PI who concluded that the nitrate data
should be reduced by 0.978 (±0.003).
only one crossover was analyzed and there is insufficient evidence to recommend an adjustment. Fifteen crossovers were analyzed for INDIGO3, but only those found north of
the Polar Front show a coherent offset (0.979±0.007),
lead-ing to the adjustment of 1.02 reported in Table 2. For the other crossovers, located at 56◦S, it is likely that ocean vari-ability also played a role, as also suspected for salinity and alkalinity.
Finally five OISO cruises, not evaluated in the inversion, were also considered for nitrate correction: 35MF19981205,
35MF20000117, 35MF20000719, 35MF20020104 and
35MF20040103. Only crossovers found in the subtropical
region show coherent offsets leading to the adjustments (no
adjustment) reported in Table 2. As also observed for the INDIGO data, we found inconsistencies between crossovers
at 56◦S attributed to ocean variability. As a consequence
we made no suggestion for the cruises 35MF19980121 and 35MF20020104, for which all crossovers are located at 56◦S.
4.4.2 Final inversion – nitrate
Based on the initial crossover analysis, nitrate data from twelve cruises were adjusted prior to the final analysis: CARINA cruises 35MF20000117 (0.97), 35MF20000719 (1.06), 49HH19941213 (0.96), 49HH20011208 (1.04), 61TG20020206 (0.98) and 74AB20020301 (0.98) and GLODAP cruises 06AQ19960317 (1.02), 35MF19960220
(0.95), 74DI19950106 (1.03), 35MF19930123 (0.98),
09FA19930624 (0.92) and INDIGO3 (1.02). The
inver-sion performed after data correction suggests that offsets
remain for six cruises: 74DI20041103, 74DI20041213,
74DI19930206, 35MF19960220, 74DI19940219 and
09AR19930404 (Fig. 3d). For one of these, cruise
35MF19960220, the final inversion suggests that the initial adjustment of 0.95 applied to the nitrate data might be too large, and proposes to correct the data by a further
1.01 (±0.01). This new result is in good agreement with
the correction factor deduced from the regional analysis
(0.965±0.015). Thus, a final adjustment of 0.96 is
rec-ommended for nitrate data from this cruise (Table 2). For the other five cruises, no adjustment was applied after
the first crossover analysis. For cruises 74DI20041103,
74DI20041213 and 74DI19930206 the final inversion
proposes correction factors of 1.03 (±0.01), 1.03 (±0.01)
and 1.02 (±0.01), respectively. This is surprising since
automatically generated crossovers show no significant
offset before or after data correction. For the two other
cruises, 74DI19940219 and 09AR19930404, slightly larger
corrections are proposed by the final inversion (1.04±0.01
and 0.94±0.01, respectively) than by the first inversion
(1.03±0.01 and 0.96±0.06, respectively). However, about
half of the automatically generated crossovers show no offset
in nitrate, in good agreement with the manually generated
crossovers which suggest only small offsets (0.99±0.02 and
1.01±1.01, respectively).
4.5 Phosphate
4.5.1 Initial crossover analysis – phosphate
Phosphate was measured at 29 of the 39 cruises (Table 2). The absence of international reference material for nutrient
measurements was evident from the large number of offsets
detected for many crossovers. A total of 82 crossovers were found among the cruises. 76 crossovers were generated
man-ually and almost two third of them show significant offsets in
phosphate (47 crossovers>2%). 77 crossovers were
gener-ated automatically and used in the inversion, including 50
crossovers that show a significant offset in phosphate.
Cor-rections deduced from the regional analysis and the inversion agree for about half of the cruises evaluated by the two meth-ods (Fig. 3e). In case of a disagreement, the value proposed by the inversion is generally higher than the one deduced from the regional analysis. For most GLODAP cruises, a third independent result is available (Gouretski and Jancke, 2001 and L. Gordon and C. Mordy, 2003, personal communi-cation) and, as for alkalinity and nitrate, a better agreement is observed with results from the regional analysis than with the
inversion (Fig. 3e). Additive corrections (Cadd) taken from
Gouretski and Jancke (2001) were converted into correction
factors (Cmul) following Eq. (1), with a mean concentration
(C) of 2.2µmol/kg .
Significant corrections (>2%) are proposed by the in-version for all cruises found south of Tasmania but one (cruise 09AR19910925). And for all of them the correction factors proposed by the inversion and the regional anal-ysis disagree. Interestingly for seven of them a constant disagreement of 0.05 is found, which highlights the strong dependence that exists between those cruises in both anal-yses. The results from the regional analysis are preferred, because they are supported by good evidence, including recommendations for no correction made by the data PI
for cruise 09AR19960822. Corresponding adjustments
are applied to phosphate data from the following cruises:
09AR200011029, 49HH19941213, 49HH20011208,
61TG20020206, 09AR19930404, 09FA19930624 and
09AR19910925 (see Table 2); and no adjustment for cruises 09AR19941213 and 09AR19960822.
Seven other cruises are identified by the inversion for
phosphate correction: 74DI20041103, 35MF19960220,
317519950922, 74DI19950106, 35MF19930123,
south of 62◦S that show an offset of 0.97, whereas six
crossovers in subtropical waters show no significant offsets
with cruises that are believed to have good phosphate
data. Because the evidence is insufficient to warrant an
adjustment, and the suggested offset is relatively small, no
adjustment is applied. For GEOSECS, the result of the
inversion is disregarded because it is not consistent with the analysis of crossovers: two of the four crossovers used
for the inversion show no significant offset (with cruises
31751995092 and 49NZ20031209), in good agreement with
the analysis of manually generated crossovers (mean offset
of 1.00±0.02).
The regional analysis suggests a significant correction for INDIGO3 based on six crossovers (including three reliable crossovers with cruises that are thought to have good
phos-phate data), which indicate a mean offset of 1.033 (±0.013).
A corresponding adjustment of 0.97 is applied. The correc-tion deduced from the regional analysis for INDIGO2 data
(1.01±0.02) should be considered with care, because only
one crossover was found for this cruise. Consequently no recommendation is made for this cruise (NC in Table 2).
Two other cruises, not evaluated in the inversion, were also identified for phosphate correction in the regional analysis: 35MF20030123 and 49ZS19921203. A large and coherent
offset (0.904±0.007) is deduced for cruise 35MF20030123
based on the analysis of seven crossovers, including one with cruise 09AR19960822 that is thought to have good
phosphate data. A corresponding adjustment of 1.10 is
applied. Similarly, the adjustment applied to data from
cruise 49ZS19921203 is based on the analysis of five reliable
crossovers that indicate a coherent offset of 0.95 (±0.007).
This result is further supported by the only automatically
generated crossover showing an offset of 0.944 with cruise
320619960503 which is thought to have good phosphate data.
4.5.2 Final inversion – phosphate
Based on the initial crossover analysis, phosphate data from sixteen cruises were adjusted prior to the
fi-nal analysis: the CARINA cruises 09AR20011029
(1.03), 35MF20030123 (1.10), 49HH19941213
(0.93), 49HH20011208 (1.04), 49ZS19921203 (1.05),
61TG20020206 (1.05) and 74DI20041103 (0.97) and the GLODAP cruises 35MF19960220 (0.98), 74DI19950106
(0.98), 74DI19940219 (1.02), 35MF19930123 (0.98),
09AR19930404 (0.98), 09FA19930624 (0.95),
09AR19910925 (0.93), INDIGO1 (0.98) and INDIGO3
(0.97). The inversion performed after data correction
suggests that offsets remain for four cruises (two of
which had already been adjusted as mentioned above):
74AB20020301, 49NZ20031209, 35MF19960220
(ad-justed) and 74DI19950106 (ad(ad-justed) (Fig. 3e). For cruise 35MF19960220, the final inversion suggests that the ad-justment of 0.98 applied to phosphate data might be too
low. Because this is in good agreement with the correction
factor deduced from the regional analysis (0.97±0.03), an
adjustment of 0.97 is recommended instead (Table 2). For the other three cruises mentioned above, no change was made to the initial results, because they are based on good evidence and it is likely that the final inversion failed since the crossovers generated after data adjustment (and used for
the inversion) show no significant offset in phosphate.
4.6 Silicate
4.6.1 Initial crossover analysis – silicate
Silicate was measured during all the cruises evaluated here. In the absence of international reference material for nutrient
measurements, offsets were detected in many crossovers. A
total of 133 crossovers was generated manually, more than
two third of which show significant offsets in silicate (94
crossovers>2%). Most of these crossovers were also
gener-ated automatically and used in the inversion (84 crossovers),
including 59 that show a significant offset in silicate.
De-spite the large number of significant offsets that complicates
the analysis, a good agreement is found between the results of the regional analysis and the inversion for about two third of the cruises evaluated by the two methods (Fig. 3f). Com-pared to the assessments made during GLODAP (Gouretski and Jancke, 2001 and L. Gordon and C. Mordy, 2003, per-sonal communication), there is no general agreement to sup-port either the regional analysis or the inversion (Fig. 3f).
Additive corrections (Cadd) taken from Gouretski and Jancke
(2001) were converted into correction factors (Cmul)
follow-ing Eq. (1), with a mean concentration (C) of 120µmol/kg.
Particularly large disagreements are found between GLO-DAP corrections and CARINA recommendations for the cruises 35MF19960220 and 74DI19950106 .
Ten cruises are identified by the inversion for silicate cor-rection: 74DI20041103, 74DI20041213, 49HH19941213,
49HH20011208, 61TG20020206, 35MF19960220,
74DI19930206, 74DI19950106, 09AR19941213 and
09AR19930404. The correction factors proposed for four of them (49HH19941213, 61TG20020206, 74DI19950106 and 09AR19930404) are in good agreement with those
deduced from the regional analysis. The corresponding
For four other cruises the correction factors pro-posed by the inversion are close to the limit of 0.98: 09AR20011029, 74AB20020301, 35MF19930123 and 09FA19930624. Corresponding adjustments are applied to these cruises based on the good agreement with the regional analysis and, for the cruise 74AB20020301, with the result of an independent analysis performed by the data PI who con-cluded that silicate should be reduced by 0.98.
For two other cruises, 06AQ19960317 and INDIGO3, the inversion suggests that no correction is required, whereas significant corrections are deduced from the regional anal-ysis (1.05 and 0.95 respectively). The latter adjustments are applied based on the good agreement with the analysis of crossovers from the Atlantic sector (Hoppema et al., 2009). For INDIGO3, only the crossovers found in the subtropical
region show a consistent offset, leading to the adjustment
re-ported in Table 2. The different offset found in crossovers at
56◦S is attributed to ocean variability, as already suspected
for salinity, alkalinity and nitrate. The correction deduced
from the regional analysis for cruise INDIGO2 (0.99±0.02)
should be considered with care because it is based on only one crossover. Consequently no recommendation is made for this cruise (NC in Table 2).
Eight cruises not evaluated in the inversion have also been identified for silicate correction in the regional analysis: 49ZS19921203 and seven OISO cruises (35MF19980818,
35MF19981205, 35MF20000117, 35MF20000719,
35MF20020104, 35MF20030123 and 35MF20040103).
Good confidence is given to the correction factor deduced from the regional analysis for cruise 49ZS19921203 based on four reliable crossovers with cruises that are thought to have good silicate data, leading to the adjustment reported
in Table 2. The adjustments (no adjustment) applied to
the OISO data are based on crossovers in the subtrop-ical region only, due to noise in deep data collected at
56◦S. Consequently, no adjustment is applied to cruises
35MF20000117 (despite the significant offset detected at
56◦S) and 35MF19980121, for which all crossovers are at
about 56◦S (NC in Table 2).
4.6.2 Final inversion – silicate
Based on the initial crossover analysis, silicate data from twenty-four cruises were adjusted prior to the final analysis: 09AR20011029 (0.98), 35MF19980818 (1.04),
35MF19981205 (1.04), 35MF20000719 (0.96), 35MF20010103 (0.98), 35MF20020104 (1.04), 35MF20030123 (1.13), 35MF20040103 (0.95), 49HH19941213 (1.03), 49HH20011208 (1.04), 49ZS19921203 (0.97), 61TG20020206 (1.05), 74AB20020301 (0.98), 74DI20041103 (0.90) and 74DI20041213 (0.94) and the GLODAP cruises 06AQ19960317 (1.05), 35MF19960220 (0.90), 74DI19950106 (1.11), 74DI19940219 (1.02), 35MF19930123 (0.98), 09AR19941213 (1.04),
Table 4. Statistics for the global Southern Ocean: mean and standard deviation of the corrections proposed by the inversion (WDLSQ) before and after adjustment of the data and the number of cruises evaluated by the inversion.
Initial corrections Final corrections mean std dev nb mean std dev nb
Salinity 0.000 0.003 59 0.000 0.002 65 TCO2(µmol/kg) 0.5 6.5 35 0.2 3.5 45 Alkalinity (µmol/kg) −0.9 5.1 32 −0.1 4.4 40 Nitrate 1.000 0.023 57 1.001 0.015 62 Phosphate 1.002 0.040 56 0.999 0.015 61 Silicate 0.998 0.051 57 1.014 0.035 62 Oxygen 0.999 0.016 57 1.000 0.008 63
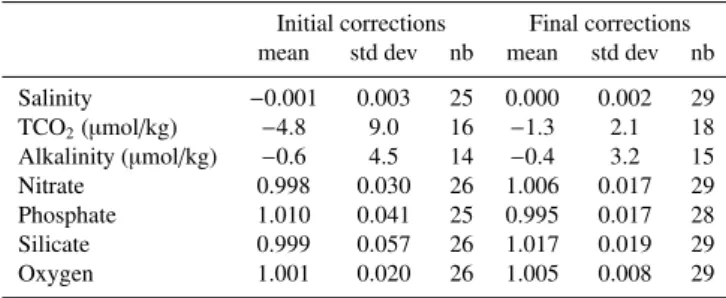
Table 5. Statistics for the Indian sector of the Southern Ocean (same as Table 4 for cruises listed in Table 1).
Initial corrections Final corrections mean std dev nb mean std dev nb Salinity −0.001 0.003 25 0.000 0.002 29 TCO2(µmol/kg) −4.8 9.0 16 −1.3 2.1 18
Alkalinity (µmol/kg) −0.6 4.5 14 −0.4 3.2 15 Nitrate 0.998 0.030 26 1.006 0.017 29 Phosphate 1.010 0.041 25 0.995 0.017 28 Silicate 0.999 0.057 26 1.017 0.019 29 Oxygen 1.001 0.020 26 1.005 0.008 29
09AR19930404 (1.07), 09FA19930624 (0.98) and INDIGO3 (0.95). The inversion performed after data adjustment sug-gests that a correction could be required for the following ten cruises (most of which had already been adjusted as men-tioned above): 09AR20011029 (adjusted), 35MF20030123 (adjusted), 49HH20011208 (adjusted), 61TG20020206 justed), 74DI20041103 (adjusted), 09AR19941213 (ad-justed), 09AR19960822, 61TG20030217, 09AR19910925 and INDIGO (Fig. 3f). Surprisingly, the final inversion pro-poses to increase silicate data for all of them (by a factor of 1.02 to 1.06). However, most of the crossovers generated after data adjustment and used for the inversion show no sig-nificant offset in silicate. This inconsistency probably results from a bias in the final inversion, as already suggested for the whole Southern Ocean (Table 4), also detected for the Indian
sector (1.017±0.019, Table 5). Consequently, the final
ad-justments reported in Table 2 are based on a careful analysis of the crossovers generated after data adjustment, rather than the corrections proposed by the final inversion.
No change is made to the initial results for the cruises mentioned above, except for two of them: 49HH20011208
and 35MF20030123. Correction factors of 1.03±0.03