Hepatocyte Nuclear Factor 4 Alpha Is a Key
Factor Related to Depression and
Physiological Homeostasis in the Mouse Brain
Kyosuke Yamanishi1,5, Nobutaka Doe3,4, Miho Sumida4, Yuko Watanabe5,
Momoko Yoshida5, Hideyuki Yamamoto2, Yunfeng Xu2, Wen Li2, Hiromichi Yamanishi5, Haruki Okamura2, Hisato Matsunaga1*
1Department of Neuropsychiatry, Hyogo College of Medicine, Nishinomiya, Hyogo, Japan,2Laboratory of Tumor Immunology and Cell Therapy, Hyogo College of Medicine, Nishinomiya, Hyogo, Japan,3Laboratory of Neurogenesis and CNS Repair, Hyogo College of Medicine, Nishinomiya, Hyogo, Japan,4Section of Behavioral Science, Kouiken Co., Ltd., Akashi, Hyogo, Japan,5Hirakata General Hospital for
Developmental Disorders, Hirakata, Osaka, Japan
Abstract
Major depressive disorder (MDD) is a common psychiatric disorder that involves marked disabilities in global functioning, anorexia, and severe medical comorbidities. MDD is asso-ciated with not only psychological and sociocultural problems, but also pervasive physical dysfunctions such as metabolic, neurobiological and immunological abnormalities. Never-theless, the mechanisms underlying the interactions between these factors have yet to be determined in detail. The aim of the present study was to identify the molecular mechanisms responsible for the interactions between MDD and dysregulation of physiological homeosta-sis, including immunological function as well as lipid metabolism, coagulation, and hormon-al activity in the brain. We generated depression-like behavior in mice using chronic mild stress (CMS) as a model of depression. We compared the gene expression profiles in the prefrontal cortex (PFC) of CMS and control mice using microarrays. We subsequently cate-gorized genes using two web-based bioinformatics applications: Ingenuity Pathway Analy-sis and The Database for Annotation, Visualization, and Integrated Discovery. We then confirmed significant group-differences by analyzing mRNA and protein expression levels not only in the PFC, but also in the thalamus and hippocampus. These web tools revealed that hepatocyte nuclear factor 4 alpha (Hnf4a) may exert direct effects on various genes specifically associated with amine synthesis, such as genes involved in serotonin metabo-lism and related immunological functions. Moreover, these genes may influence lipid me-tabolism, coagulation, and hormonal activity. We also confirmed the significant effects of Hnf4a on both mRNA and protein expression levels in the brain. These results suggest that Hnf4a may have a critical influence on physiological homeostasis under depressive states, and may be associated with the mechanisms responsible for the interactions between MDD and the dysregulation of physiological homeostasis in humans.
OPEN ACCESS
Citation:Yamanishi K, Doe N, Sumida M, Watanabe Y, Yoshida M, Yamamoto H, et al. (2015) Hepatocyte Nuclear Factor 4 Alpha Is a Key Factor Related to Depression and Physiological Homeostasis in the Mouse Brain. PLoS ONE 10(3): e0119021. doi:10.1371/journal.pone.0119021
Academic Editor:Eiji Shimizu, Chiba University Graduate School of Medicine, JAPAN
Received:March 10, 2014
Accepted:January 26, 2015
Published:March 16, 2015
Copyright:© 2015 Yamanishi et al. This is an open access article distributed under the terms of the Creative Commons Attribution License, which permits unrestricted use, distribution, and reproduction in any medium, provided the original author and source are credited.
Funding:This work was internally supported by the fund of Department of Neuropsychiatry in Hyogo College of Medicine. The funder had no role in study design, data collection and analysis, decision to publish, or preparation of the manuscript.
Introduction
Major depressive disorder (MDD) is recognized as one of the most common mental disorders in developed countries, including Japan [1–2]. However, the etiological and psychobiological mechanisms responsible for the development of MDD remain unclear, even though pharmaco-logical treatments for MDD have been investigated extensively. These treatments have primari-ly targeted deficiencies in monoamine neurotransmitters or receptors, particularprimari-ly serotonin and noradrenergic systems [3].
Evidence of significant relationships between MDD and dysfunction in the prefrontal cortex (PFC) and hippocampus is growing. For example, reduced expression of synapse-related genes and loss of synapses has been reported in the PFC of patients with MDD [4–5]. Moreover, studies of MDD patients have revealed that certain types of depressive symptoms may be asso-ciated with a decrease in the integrity of the ventromedial PFC and cingulate cortices [4–6]. Stressful conditions exert critical effects on the PFC and limbic or prelimbic regions, resulting in hyperactivity in the hypothalamic–pituitary–adrenal (HPA) axis and hippocampus [7–8]. The hippocampus is a key limbic area that is located at the“cross-roads”of circuitry. It regu-lates stress responses by providing inhibitory feedback to the HPA axis and also plays a role in mood modulation and memory function. Although these findings support a close association between the PFC, thalamus, and hippocampus in MDD, the molecular mechanisms responsi-ble for physiological aspects of MDD remain unknown [9–11].
Therefore, to clarify these issues, we generated depression-like behavior in mice in the pres-ent study using a chronic mild stress (CMS) model. Indeed, the CMS model has been well vali-dated as an animal model of MDD [29–30]. However, its biological validity has not been fully examined. In particular, the physiological aspects of the CMS model, such as lipid metabolism, hormonal function, or coagulation, have not yet been verified. These factors are closely associ-ated with the general health of people, and significant dysfunction of these factors is expected to cause a variety of physical problems, such as dyslipidemia or insulin resistance. These prob-lems can significantly increase the risk of serious diseases such as diabetes, myocardial infarc-tion or stroke [31–33]. In this study, therefore, we sought to examine the molecular
mechanism of MDD, focusing on lipid metabolism, hormonal activity and coagulation, using the CMS model. In addition, we elucidated the functions of amine synthesis, including seroto-nin metabolism, and the immune system to analyze the correlations among these factors.
Materials and Methods
Animals
We purchased experimentally naive male C57BL/6N mice from Japan SLC, Inc. for use in the present study. Mice were 9–10 weeks old and weighed 22.3 g on average at the start of the ex-periment. All mice were housed in groups of 3–5 in polycarbonate cages that were placed in a colony room maintained at a constant temperature (22 ± 1°C) and humidity (50–60%), under a 12-h light/dark cycle (lights on at 7:00 am) with free access to food and water.
Animals were randomly assigned to one of two groups; 25 control mice (C group) were given ordinary daily care, whereas 25 chronic mildly stressed mice (CMS group) were housed individually and exposed to CMS for 4 weeks according to previously published procedures [34]. Sixteen mice from each group were used in the molecular and tail suspension tests, where-as the rest were used for the open space swimming test.
Animal experiments were conducted according to the“Guide for Care and Use of Laborato-ry Animals’’published by the National Institutes of Health (NIH) and approved by the“Ethical committee of Behavioral and Medical Science Research Consortium”(Hyogo, Japan). The ap-proved IDs were 2012-B-09 and 2012-B-10. All efforts were made to minimize the suffering of animals including the number of mice used for all analyses.
CMS procedure
The CMS procedure consisted of various unpredictable mild stressors including water depriva-tion (8 h), continuous overnight illuminadepriva-tion (36 h), a wet cage (200 ml water in 100 g sawdust bedding; 4 h), 45° cage tilt (8 h), physical restraint with a suitably designed mouse holder (4 h), forced swimming in a plastic cylinder (diameter, 18 cm; height, 30 cm) containing water (24°C) at a depth of 15 cm (30 min), and exposure to 60 inescapable electric shocks (0.36 mA, 1 s) pre-sented on a variable interval 60-s schedule in a chamber with a grid floor (10 × 10 × 10 cm). These stressors were randomly scheduled over a 1-week period and repeated 4 times.
Behavioral tests
Standardized behavioral tests were performed 4 weeks after the study was initiated to quantita-tively compare behavioral differences between groups.
Open space swimming test (OST)
was filled with water to a depth of 20 cm and made opaque by the addition of titanium oxide. The temperature of the water was maintained at 22 ± 1°C. Each mouse was placed in the pool, with its head facing the outer edge of the pool, and allowed to swim (or not swim) freely for 10 min. All trials were recorded with a digital video camera placed above the maze. The swim path distance was calculated by a computerized video-based tracking system (Be-Chase ver.3.0, Kouiken Co. Ltd., Akashi, Japan).
Tail suspension test (TST)
The tail suspension test was performed using the Be-Sensor system (Taiyo Electric Co. Ltd., Osaka, Japan). An isolation chamber (45 × 45 × 45 cm) equipped with an infrared ray sensor on the ceiling was used. This sensor consisted of paired infrared pyroelectric detectors that measured heat energy radiating from the mouse. Each mouse was suspended by the tail using adhesive tape from a horizontal bar attached 30 cm above the chamber floor for 6 min. Strug-gling activity during tail suspension was quantitated by analyzing changes in heat energy.
Sample collection
We euthanized the mice by decapitation using a guillotine, and collected brain samples for fur-ther analyses according to previously described methods [35]. Ten mice per group were used for microarrays and quantitative real-time polymerase chain reaction (qRT-PCR) and 6 were used for western blotting analysis (WB). The other 9 mice were used for behavioral analysis. We performed the same experiment twice for molecular and behavioral analyses and used a total of 25 mice per group (as described in Animal session). All samples were extracted the day after the last stress condition. Brain samples were immediately placed in liquid nitrogen after extraction, and kept in a−80°C freezer until later analyses.
RNA purification
Total RNA was purified from the mouse brain using a Sepasol-RNA I Super kit (Nacalai Tes-que, Kyoto, Japan) according to the manufacturer’s instructions, and treated with five units of RNase free DNase I at 37°C for 30 min to remove genomic DNA contamination. After phenol/ chloroform extraction and ethanol precipitation, total RNA was dissolved in de-ionized dis-tilled water. RNA concentrations were determined by spectrophotometry.
Microarray analysis
We outsourced (Takara Bio Inc, Mie, Japan) the microarray analysis for the whole genome. The details were shown below.
RNA quality check
RNA was quantified using a NanoDrop-2000 spectrophotometer and quality was monitored with the Agilent 2100 Bioanalyzer (Agilent Technologies, Santa Clara, CA).
Label protocol (1color)
Cyanine-3 (Cy3)-labeled cRNA was prepared from 0.1μg total RNA using the Low Input
Quick Amp Labeling Kit (Agilent) according to the manufacturer’s instructions, followed by RNeasy column purification (Qiagen, Valencia, CA).
Hybridization protocol
A total of 0.6μg of Cy3-labeled cRNA was fragmented at 60°C for 30 min in a reaction volume
of 25μl containing 1× Agilent fragmentation buffer and 2× Agilent blocking agent following
the manufacturer's instructions.
Upon completion of the fragmentation reaction, 25μl 2× Agilent hybridization buffer was
added to the fragmentation mixture and hybridized to Agilent SurePrint G3 Mouse GE 8x60K (cat; G4858A-028005) for 17 h at 65°C in a rotating Agilent hybridization oven.
After hybridization, microarrays were washed for 1 min at room temperature with GE Wash Buffer 1 and 1 min with 37°C GE Wash buffer 2 (Agilent), then dried immediately by brief centrifugation.
Scan protocol
Slides were scanned immediately after washing on the Agilent DNA Microarray Scanner (G2565CA) using a one color scan setting for 8×60k array slides (Scan Area 61 × 21.6 mm, Scan resolution 3μm, the dye channel set to Green, and Green PMT set to 100%).
Data processing
The scanned images were analyzed with Feature Extraction Software 10.10.1.1 (Agilent) using default parameters to obtain background subtracted and spatially detrended Processed Signal intensities.
Value definition
Scaled signal intensities were adjusted to an average intensity value of 2500.
Details of the analysis method can also be found on the Gene Expression Omnibus (GEO) website. Our series entry was GSE49867 (http://www.ncbi.nlm.nih.gov/geo/query/acc.cgi?acc= GSE49867).
Database for Annotation, Visualization, and Integrated Discovery
(DAVID) web tool analysis
An approach to annotation enrichment analysis was performed using the DAVID (http:// david.abcc.ncifcrf.gov/) web tools (version 6.7, 2010) [36–37]. This web-based resource provid-ed a set of functional annotation tools for statistical enrichment of the genes categorizprovid-ed into Gene Ontology (GO) terms. We used the GO FAT category, which filtered out very broad GO terms to identify significantly enriched functional groups. We examined the functions of lipid metabolism, coagulation, hormonal activity, immunological function, and amine synthesis be-cause they had apvalue less than 0.05.
Ingenuity Pathway Analysis (IPA)
Quantitative real-time polymerase chain reaction (qRT-PCR)
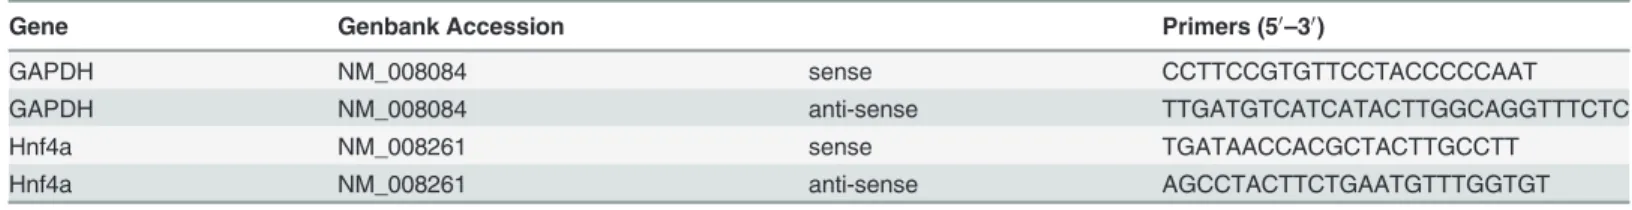
To validate the results obtained by the microarray, DAVID, and IPA analyses, qRT-PCR was performed twice under at least 10 different experimental conditions. Total RNA (10 ng/reac-tion) extracted from the CMS and C groups was used in the RNA-direct SYBR Green Real-Time PCR Master Mix: One-step qPCR kit (Toyobo Co. Ltd., Tokyo, Japan). Samples were run in duplicate reactions in 96-well plates. Median threshold cycle values were used to calculate fold changes (FC) between the samples from 2 groups. FC values were normalized to glyceral-dehyde-3-phosphate dehydrogenase (GAPDH) levels. The following temperature profile was used: 30 s at 90°C and 20 min at 61°C for reverse transcription according to the manufacturer’s instructions, followed by 45 cycles of 95°C for 15 s, 65°C for 15 s, and 74°C for 35 s. We used the primers of hepatocyte nuclear factor 4 alpha (Hnf4a) and GAPDH, as shown inTable 1.
Western blotting analysis (WB)
Mouse brains were minced in Lysis buffer (80μl) on ice and sonicated using a sonicator
(Soni-fier II, BRANSON). The lysate was centrifuged (12,000 rpm/13,000 G, 3 min) and the superna-tant was collected. The protein concentration in the supernasuperna-tant was determined with a Bio-Rad protein assay kit (Bio-Bio-Rad Laboratories). Sample buffer was added to the supernatant, and the mixture was heat-treated (95°C, 5 min). Samples were electrophoresed in a 12.5% SDS polyacrylamide gel and transferred onto polyvinylidene difluoride membranes (Hybond-P, Amersham Bioscience). Membranes were then incubated with the anti-goat Hnf4a antibody (cat no: sc-6557, Santa Cruz Biotechnology, Inc. CA, USA) overnight, washed with T-PBS, and incubated with Anti-goat IgG (cat no: sc-2020, Santa Cruz Biotechnology, Inc.). The specific binding of antibodies was captured using the LAS-4000 photo-image analyzer (Fuji Photo Film Co., Ltd.). We measured the density of stained protein bands using ImageJ (http://rsbweb.nih. gov/ij/, version 1.6) and the results obtained were normalized to GAPDH levels. We also as-sessed positive controls (cat no: sc-126960, Santa Cruz Biotechnology, Inc.).
Serum data analysis
We measured triglyceride (TG), total cholesterol (T-cho), HDL cholesterol (H-cho), and corti-sol levels from the sera collected. TG, T-cho, and H-cho levels were measured by enzymatic methods and cortisol by a chemiluminescent enzyme immunoassay method (CLEIA method). We outsourced (Mitsubishi Chemical Medience Co., Tokyo, Japan) the serum analysis.
Statistical analysis
All results are expressed as the mean ± SEM. Differences between groups were analyzed by Stu-dent’st-test or Mann–Whitney U-test. We used Sigmaplot (version 10.0 Systat Software, Inc., San Jose, CA, USA) for all analyses of our results.
Table 1. Structures of the primers used.
Gene Genbank Accession Primers (50
–30)
GAPDH NM_008084 sense CCTTCCGTGTTCCTACCCCCAAT
GAPDH NM_008084 anti-sense TTGATGTCATCATACTTGGCAGGTTTCTC
Hnf4a NM_008261 sense TGATAACCACGCTACTTGCCTT
Hnf4a NM_008261 anti-sense AGCCTACTTCTGAATGTTTGGTGT
GAPDH, glyceraldehyde-3-phosphate dehydrogenase; Hnf4a, Hepatocyte nuclear factor 4 alpha.
Results
Behavioral tests (Reduced locomotive activity in CMS mice)
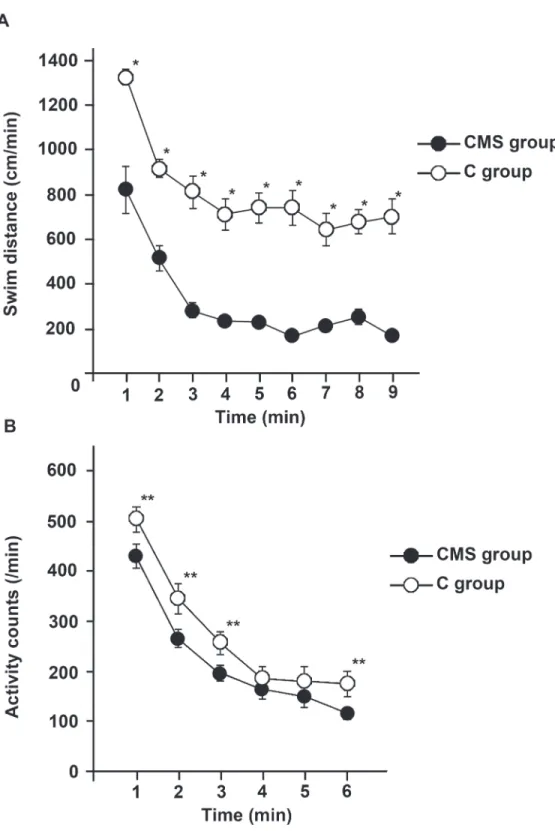
The results of the OST and TST are shown inFig. 1. A marked reduction in the swimming speed was observed until 2 to 3 min after the start of swimming and was maintained thereafter in both the CMS and C groups (Fig. 1A). The mean swimming distance was significantly shorter in the CMS group than in the C group at each time point. Physical activity, including heat energy radiated in the TST, was significantly lower in the CMS group (Fig. 1B). Therefore, locomotive activity was reduced in CMS mice. No significant differences were observed in weight changes between the two groups (data not shown).
Microarray analysis of the PFC
Because mice exposed to CMS exhibited behavioral patterns consistent with those observed in MDD patients, we subsequently performed microarray analysis on the PFC to compare gene expression profiles of the CMS and C group. We isolated a total of 494 genes in CMS group whose expression was more than 2-fold higher than or less than half that of the C group. We searched for the functions, categories, and interactions of these genes by DAVID and IPA.
DAVID analysis (Categorization of CMS-related genes)
We categorized the 494 genes by DAVID according to their biological functions. We selected genes whose functions were related to lipid metabolism, hormonal activity, coagulation, immu-nological function, and amine synthesis. As shown asTable 2andS1 Table, 41 genes were re-lated to lipid metabolism, 22 to hormonal activity, 17 to coagulation, 77 to immunological function and 13 to amine synthesis, respectively. Some genes overlapped the different catego-ries. We analyzed the relationships between these genes by IPA.
CMS, chronic mild stress; GO, Gene Ontology; DAVID, the Database for Annotation, Visu-alization, and Integrated Discovery.
IPA analysis
We previously categorized all of the isolated genes. We hypothesized that some candidate genes were augmented in the PFC and directly responsible for the disturbances reported in lipid metabolism, hormonal activity, coagulation and immunological function, under a depres-sive state. We searched for only direct interactions among extracted genes from DAVID analy-sis using IPA. As shown inFig. 2, we identified one gene,‘Hnf4a’that had direct interactions between the extracted genes and was located in the center of these interactions. Hnf4a was cate-gorized into‘steroid hormone receptor activity’and‘lipid binding’by DAVID analysis. Fur-thermore, Hnf4a had a strong influence on genes that were related to lipid metabolism, hormonal activity, coagulation, immunological function, and amine synthesis. The gene details and log2ratio of IPA are shown inTable 3. The results of the core analyses for Hnf4a are also inS2 Table.
qRT-PCR
Fig 1. CMS group displayed depressive symptom patterns in the behavioral tests.(A) Open space swimming test (OST). Mice performed the OST following exposure to CMS. The swimming distance was measured by recording movement with a digital video camera and analyzed using a computerized video-based tracking system. The results are expressed as the average values obtained from the CMS and C groups, and were analyzed by Student’st-test (n= 9 for each group;*:p<0.001). (B) Tail suspension test
(TST). The activity counts of the CMS group were measured using the Be-sensor system, which analyzed radiated heat energy. The mean values in CMS and C groups are presented. The activity counts of the CMS group were significantly lower than those of the controls in the first 3 minutes and the last minute of the test. The data were analyzed by Student’st-test and apvalue less than 0.05 was considered significant (n= 9 per each group;**:p<0.05).
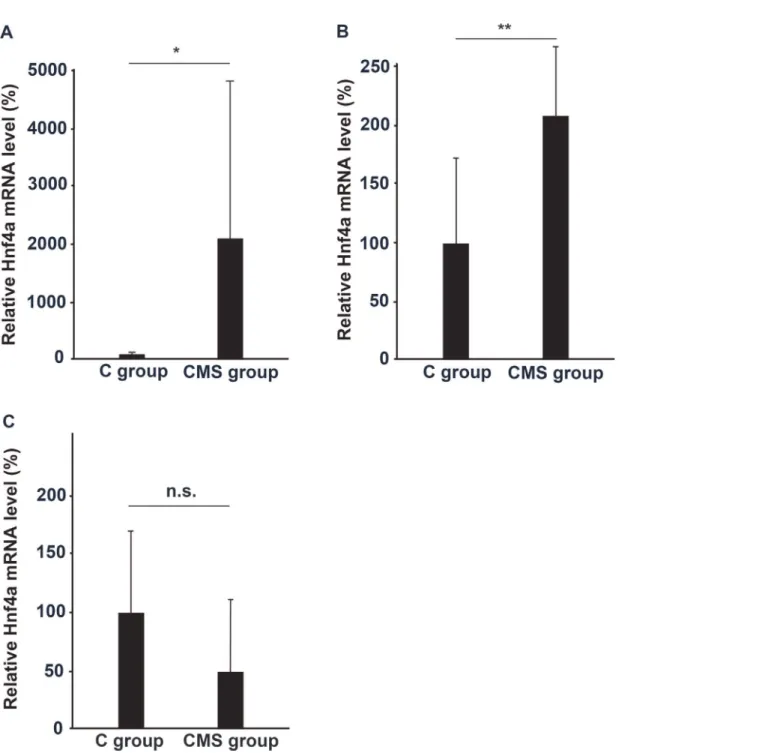
Subsequently, we confirmed the expression of Hnf4a in the PFC (Fig. 3A). Hnf4a expression in the PFC was significantly higher in the CMS group than in the C group, which confirmed the results of microarray analysis. We also examined the expression of Hnf4a in the thalamus, and hippocampus. Hnf4a mRNA expression was significantly increased in the thalamus, but was not in the hippocampus (Fig. 3B and C). Thus, Hnf4a expression was significantly in-creased in the PFC and thalamus under a depressive state.
WB
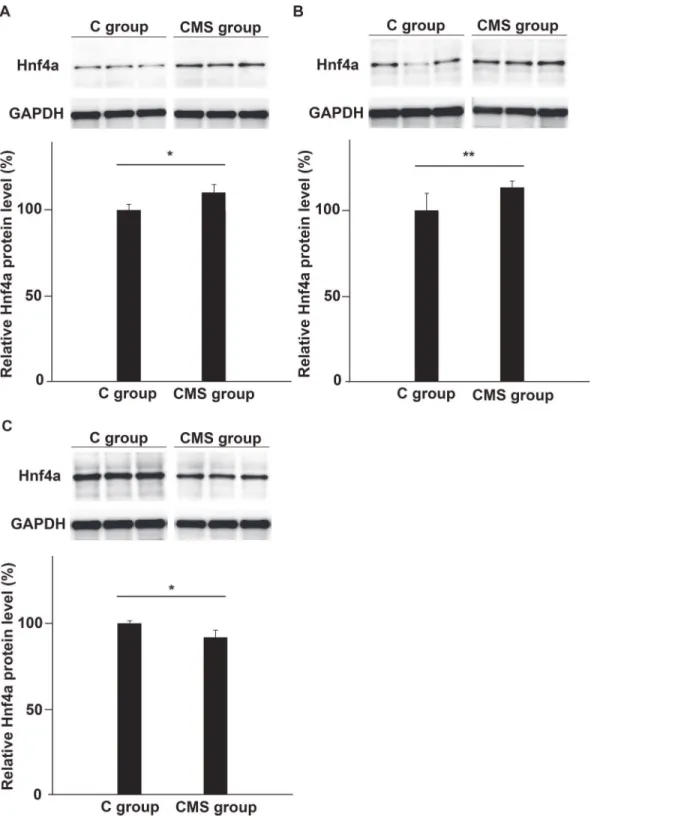
We further examined augmented expression of Hnf4a in the PFC of CMS mice by WB analysis of the protein levels produced (Fig. 4A). In accordance with the results of qRT-PCR analysis, quantitative analysis of the representative blots indicated the enhanced synthesis of the Hnf4a protein in the PFC of CMS mice. Hnf4a protein expression in the PFC was higher in the CMS group than in the C group (Fig. 4A). Similar to the results for mRNA levels in the thalamus and hippocampus, synthesis of the Hnf4a protein was higher in the thalamus and lower in the hippocampus in the CMS group than in the C group (Fig. 4B, 4C). We checked that there were no non-specific bands and also confirmed the bands observed using a positive control, as shown inS1 Fig.
Serum data
Metabolic parameters as well as circulating hormones were measured because they were previ-ously shown to be altered in association with a depressive state. The results obtained are shown Table 2. Classification and enrichment of CMS genes extracted from DAVID results.
Group GO category Count pvalue
Lipid metabolism GO:0006869 lipid transport 19 <0.001
GO:0010876 lipid localization 19 <0.001
GO:0055088 lipid homeostasis 7 0.002
GO:0006638 neutral lipid metabolic process 8 0.002
GO:0006641 triglyceride metabolic process 7 0.002
GO:0008289 lipid binding 23 0.025
Hormonal activity GO:0008202 steroid metabolic process 23 <0.001
GO:0009725 response to the hormone stimulus 19 <0.001
GO:0003707 steroid hormone receptor activity 6 0.048
Coagulation GO:0050817 coagulation 20 <0.001
GO:0007596 blood coagulation 20 <0.001
Immunological function GO:0006954 inflammatory response 33 <0.001
GO:0006952 defense response 48 <0.001
GO:0050778 positive regulation of immune response 24 <0.001
GO:0002253 activation of immune response 19 <0.001
GO:0019724 B cell mediated immunity 14 <0.001
GO:0002449 lymphocyte mediated immunity 15 <0.001
GO:0002252 immune effector process 19 <0.001
GO:0006955 immune response 40 <0.001
GO:0034097 response to cytokine stimulus 9 <0.001
GO:0002697 regulation of immune effector process 10 0.007
Amine synthesis GO:0009310 amine catabolic process 9 0.003
GO:0009309 amine biosynthetic process 9 0.007
inTable 4. Although no significant differences were observed in T-cho or H-cho levels between the groups, TG levels were significantly higher and cortisol levels were significantly lower in the CMS group than in the C group.
Serum cytokines levels were also measured to examine group differences in inflammatory responses. The inflammatory cytokines IL-5, IL-12 beta, IL-17 alpha, and Tnf-alpha were sig-nificantly higher in the CMS group than the C group (S5 Table).
Discussion
The results of the present study that have crucial implications regarding the pathophysiology of MDD were: 1) the CMS model clearly engendered a set of behaviors indicative of depressive symptoms observed in humans, 2) the CMS model animals were significantly more likely than the controls to show lipid metabolic dysfunction, especially hypertriglycemia, 3) the presence of the Hnf4a protein was confirmed in 3 parts of the brain: the PFC, thalamus, and hippocam-pus, and 4) Hnf4a may have affected molecules related to lipid metabolism, hormonal activity, coagulation, immunological function, or amine synthesis under a depressive state, indicating that Hnf4a may play a role in the interactions between MDD and dysfunctions of
physiological homeostasis.
Fig 2. IPA analysis; direct networks among Hnf4a and other genes related to homeostasis and amine synthesis.Total mRNA was extracted from the PFC of the CMS and C groups and analyzed by microarray. A number of genes were selected from the genes differentially expressed in the PFC of the CMS groups, and transferred to DAVID web tool analysis. Hnf4a had an impact on these genes. They were categorized into genes related to lipid metabolism (blue), hormonal activity (green), coagulation (pink), immunological function (red), and amine synthesis (purple). The details of these genes including their log2ratios are shown inTable 3.
The serum level of inflammatory cytokines such as Tnf-alpha may increase under depres-sive conditions, and their elevated levels may trigger MDD [12,18]. Metabolic syndrome, char-acterized by increased TG levels and non-treated Diabetes Mellitus (DM), may also increase Table 3. Gene details and differences observed between the CMS and control groups with the IPA analysis.
Group Genes Entrez Gene Name Log2Ratio
Lipid metabolism Akr1c6 aldo-keto reductase family 1, member C4 3.08
Apoa1 apolipoprotein A-I 3.98
Apoa2 apolipoprotein A-II 3.12
Apob apolipoprotein B (including Ag(x) antigen) 3.79
Apoc1 apolipoprotein C-I 3.18
Apoc3 apolipoprotein C-III 2.85
Apoh apolipoprotein H (beta-2-glycoprotein I) 2.89
Apom apolipoprotein M 2.31
Asgr2 asialoglycoprotein receptor 2 1.31
C8g complement component 8, gamma polypeptide 1.44
Cd1d CD1d molecule 1.12
Fabp1 fatty acid binding protein 1, liver 3.35
Fabp2 fatty acid binding protein 2, intestinal 1.53
Hnf4a hepatocyte nuclear factor 4, alpha 3.56
Pck1 phosphoenolpyruvate carboxykinase 1 (soluble) 3.58
Slc27a2 solute carrier family 27 (fatty acid transporter), member 2 1.08
Hormonal activity Aldob aldolase B, fructose-bisphosphate 2.54
G6pc glucose-6-phosphatase, catalytic subunit 2.68
Hsd17b2 hydroxysteroid (17-beta) dehydrogenase 2 1.82
Pon1 paraoxonase 1 3.36
Ugt1a6b UDP glucuronosyltransferase 1 family, polypeptide A6 1.48
Coagulation Cpb2 carboxypeptidase B2 (plasma) 2.36
F12 coagulation factor XII (Hageman factor) 1.62
Fga fibrinogen alpha chain 1.13
Fgb fibrinogen beta chain 3.25
Kng1 kininogen 1 3.00
Plg plasminogen 3.08
Proz protein Z, vitamin K-dependent plasma glycoprotein 2.34
Immunological function Ahsg alpha-2-HS-glycoprotein 3.39
C1s1 complement component 1, s subcomponent 1.73
C3 complement component 3 2.90
Hamp hepcidin antimicrobial peptide 2.81
Hpx hemopexin 2.97
Mbl2 mannose-binding lectin (protein C) 2 3.06
Serpina1a serine peptidase inhibitor, clade A, member 1A 3.07 Serpina3c serine peptidase inhibitor, clade A, member 3c 3.16
Traf6 TNF receptor-associated factor 6 -1.46
Amine synthesis Bhmt betaine—homocysteine S-methyltransferase 2.21
Hpd 4-hydroxyphenylpyruvate dioxygenase 3.57
Prodh2 proline dehydrogenase (oxidase) 2 1.66
Tdo2 tryptophan 2,3-dioxygenase 2.60
CMS, chronic mild stress; IPA, Ingenuity Pathway Analysis.
the risk of MDD [28,40]. Conversely, MDD has been regarded as a risk factor for the develop-ment of hyperlipidemia [27]. Significantly greater elevations in inflammatory cytokine and TG levels were observed in the CMS group, which suggests the possibility that unpredictable and chronic stress may lead to inflammation and dyslipidemia in our model.
Fig 3. Enhanced expression of Hnf4a mRNA in the PFC, thalamus, and hippocampus of the CMS group.We performed qRT-PCR analysis on Hnf4a mRNA expressed in the (A) PFC (n= 10), (B) thalamus (n= 7), and (C) hippocampus (n= 7) of the CMS group. The mean concentration of mRNA from the brains of the C group was set at 100%, and relative mRNA levels in each part of the brain were expressed by the mean multiplicity of the CMS group. The results of the PFC were analyzed with the Mann–Whitney U test, and those of the thalamus and hippocampus were analyzed with Student’st-test (*:p<0.005,**:p<0.05, n.s.: not significant).
Fig 4. Expression of the Hnf4a protein in the brains of CMS and C groups.Protein extracts were prepared from the PFC (A), thalamus (B), and hippocampus (C) from the CMS and C groups. The density of the stained protein dots of Hnf4a were normalized to that of GAPDH. We clearly demonstrated that the Hnf4a protein was expressed in the brain (S1 Fig.). Expression of the Hnf4a protein in the PFC and thalamus was significantly higher in the CMS group than in the control group. On the other hand, its expression was reduced in the hippocampus. (A, B) We examined the expression of the Hnf4a protein in the PFC and thalamus of the CMS group by WB, and significant differences were observed between the CMS and C groups. WB results of the PFC and thalamus were analyzed using Student’st-test (A:n= 5 for each group, B:n= 6 for each group). (C) The same analysis was performed on the hippocampus by WB. Significantly lower Hnf4a expression was found in the hippocampus of the CMS group. The data were analyzed by Student’st-test and thepvalue obtained was 0.007 (n= 6 for each group;*:p<0.01,**:p<0.05).
Hnf4a is a transcription factor that is involved in gluconeogenesis and lipid homeostasis [41], and may be closely related to the development of DM in the young [42]. In the present study, we confirmed that Hnf4a was clearly up-regulated in the PFC and thalamus and down-regulated in the hippocampus in CMS mice.
A number of isolated genes were detected in the present study using microarray analysis. DAVID categorized these genes into those controlling lipid metabolism, coagulation, hormon-al activity, immunologichormon-al function, and amine synthesis, with significant interactions among each categorized gene. The PFC is a projection area for dopaminergic and serotonergic neurons and modulates these systems [43–45]. For instance, Tryptophan 2,3-dioxygenase (Tdo2) was categorized as an amine synthesis molecule by DAVID in this study, and it is a rate-limiting en-zyme expressed in the pathway from tryptophan to kynurenine, which is an alternative path-way to the tryptophan-serotonin pathpath-way [15]. When stimulated by stress, Tdo2 reduces serotonin levels because of a shift in tryptophan metabolism from serotonin to kynurenine [15]. We found higher expression of Tdo2 in the CMS group than the C group, which may have led to higher depression-like behaviors in the CMS group because of deficient serotonin levels through regulation by Tdo2. Furthermore, Hnf4a increased the expression of Tdo2, and the augmentation of Tdo2 expression may be related to both stress and elevated Hnf4a levels [15,46]. Hnf4a itself was identified to have a regulatory role in lipid metabolism by our core analysis. Indeed, seventeen genes associated with lipid metabolism were regulated by Hnf4a in our analysis. Hnf4a also increased insulin resistance, DM, glucose tolerance, and inflammatory responses. It also appears to affect coagulation, hormonal activity and immunological func-tions, as 8, 10 and 14 molecules related to these processes were affected by Hnf4a, respectively.
Recently, there has been a growing interest in the role of Hnf4a in humans. For instance, the Tnf antagonist infliximab was found to be effective in ameliorating depressive symptoms, and when patients experiencing high inflammation were administered infliximab, they showed greater reductions in depressive symptoms than patients treated with placebo [41,47]. Addi-tionally, infliximab also affects gluconeogenesis and lipid homeostasis through Hnf4a [41]. These results seem to support our speculation that Hnf4a might exert direct effects on the levels of inflammatory cytokines including Tnf-alpha, along with its effects on lipid metabolism.
Thus, Hnf4a may have critical effects in monoamine deficiency and impaired lipid metabo-lism, coagulation, hormonal activity, and immunological functions in depression.
The thalamus is generally considered to regulate body homeostasis, hormone levels, and food intake [7,48]. In this study, similar results were observed in the PFC and thalamus, which suggests that Hnf4a may also exert some effects on homeostasis, especially in the regulation of cortisol levels. As shown inFig. 2, Hnf4a regulated hormonal activity genes. Our results suggest the possibility that the up-regulation of Hnf4a expression in stressful situations may stimulate the activity of steroid hormone receptors.
Table 4. TG, T-cho, H-cho, and cortisol levels in the serum.
CMS group (n= 15) C group (n= 15)
Mean SD Mean SD t pvalue
TG (mg/dl) 52.4 13.8 43.0 8.8 2.23 0.034
T-cho (mg/dl) 88.2 9.9 87.3 13.6 0.21 0.838
H-cho (mg/dl) 67.0 10.5 64.3 14.4 -0.038 0.72
Cortisol (μg/dl) 0.90 0.09 1.39 0.41 -3.58 0.001
CMS group, chronic mild stress group; C group, control group; TG, triglyceride; T-cho, total cholesterol; H-cho, HDL-cholesterol; SD, standard deviation.
However, the results of the present study demonstrate that Hnf4a may be down-regulated in the hippocampus. Neurogenesis in the hippocampus of mammals may be significantly less in depressive status than in non-depressive healthy controls, which is consistent with the find-ings obtained from adult humans [49–50]. Neurogenesis may also be decreased in the hippo-campus and apoptosis may be enhanced in cerebral cells of CMS-treated rats [30]. Our results show that expression of the Hnf4a protein in the hippocampus was lower in the CMS group than in the C group. Liver cells have also been shown to be more susceptible to lipopolysaccha-rimediated apoptosis in Hnf4a knock-out mice [51]. In addition, Hnf4a knock-out mice de-veloped severe hepatomegaly and steatosis, resulting in premature death [52]. Based on these findings, Hnf4a can be considered to be an essential transcription factor that protects against cell apoptosis, and the down-regulation of Hnf4a expression may lead to apoptosis and the in-hibition of neurogenesis in the hippocampus.
In the present study, we only measured Hnf4a in 3 brain regions. To more thoroughly ex-amine our hypotheses, especially those related to the central regulation of physiological func-tions such as lipid metabolism, coagulation, hormonal activity, immunological function, and amine synthesis, future studies should analyze metabolism in peripheral organs to clarify the interactions and global mechanisms of Hnf4a function. Moreover, the effects of antidepressant drugs on the expression of Hnf4a and other molecules should be examined in our model. Fur-ther studies to measure the role and dynamics of Hnf4a under a depressive state, including hor-monal metabolism and its distribution in depressed humans, are warranted. Finally, our suggestions regarding the crucial role of Hnf4a on physiological homeostasis under depressive status are based on web-based informatics using DAVID. We used DAVID as it is the most suitable and reliable method at present for elucidating the molecular interactions between MDD and the dysregulation of physiological homeostasis. Thus its reliability should be further examined once more advanced methods become available.
In conclusion, in the present study, we demonstrate the possibility that Hnf4a may be a cen-tral regulator of genes involved in lipid metabolism, hormonal activity, coagulation, immuno-logical function, and amine synthesis. The Hnf4a protein was clearly expressed in the brain, and this gene may be both essential for life and have a critical impact on physiological homeo-stasis under depressive status. Regardless of the limitations of this study, our finding should provide valuable insights into the mechanisms responsible for the interactions between MDD and physiological homeostasis in laboratory animals and human patients.
Supporting Information
S1 Fig. Western blotting using 2 different antibodies clearly detected the Hnf4a protein in the brain.We used 2 different antibodies (A): a goat polyclonal anti-mouse Hnf4a antibody (cat no: sc-6557, Santa Cruz Biotechnology, Inc.) and (B): a mouse monoclonal Hnf4a antibody (cat no: PP-K9218-00, Perseus Proteomics, Inc.) for western blotting analysis to detect Hnf4a in the brain. We used the thalamus lysate and 293T lysate (cat no: sc-126960, Santa Cruz Bio-technology, Inc.) as positive controls (PC), to confirm that we successfully stained the Hnf4a protein in the brain. We also examined these same thalamus samples with only secondary anti-bodies; (C) anti-goat IgG, and (D) anti-mouse IgG. No bands were observed.
(TIF)
S1 Table. Functional annotation clustering of gene differences between the CMS and C groups based on DAVID analysis.
S2 Table. Core analyses of Hnf4a using IPA.We performed the core analyses using IPA. We extracted the functions and the diseases related to Hnf4a from all results of the core analyses. (XLSX)
S3 Table. The primers for the validation of microarray data of the PFC with qRT-PCR one. We confirmed the expression of 10 genes from IPA results, including the genes shown in Fig. 2, by qRT-PCR. We showed the primers used for qRT-PCR experiments. PFC, prefrontal cortex; qRT-PCR, quantitative real-time polymerase chain reaction;
(DOCX)
S4 Table. Validation of microarray data of the PFC with qRT-PCR one.We compared the results of microarray from qRT-PCR to determine significant correlations by Spearman’s rank collection test, which revealed a significant correlation (rs = 0.903, p<0.001). PFC, prefrontal
cortex; qRT-PCR, quantitative real-time polymerase chain reaction; FC(qRT-PCR), fold change based on the results obtained with qRT-PCR; FC(Microarray), fold change based on the results obtained by microarray.
(DOCX)
S5 Table. Levels of IL-5, IL-12b, IL-17A, and TNF-a in the serum.To investigate the influ-ence of immune factors to MDD, we measured the serum cytokines by Bio-Plex Pro Mouse Cy-tokine 23-Plex Panel (cat; M60-009RDPD, Bio-Rad Laboratories, Inc.) and Bio-Plex Pro Mouse Cytokines GII 9-Plex Panel (cat; MD0-00000EL). The cytokine in the CMS group that exhibited significantly higher levels than in the C group were IL-5, IL-12b, IL-17A, and TNF-a. Conversely, the levels of IL-1b, IL-2, IL-6, IL-9, IL-10, and IL-18 were not significantly different between the groups (data not shown). CMS group, chronic mild stress group; C group, control group; IL-5, interleukin 5; IL-12b, interleukin 12 beta; IL-17A, interleukin 17 alpha; TNF-a, tumor necrosis factor alpha; SD, standard deviation.
(DOCX)
Acknowledgments
We all thank Mr. Nobutaka Okamura and Mrs. Naomi Gamachi for their technical support; Mr. Nobutaka Okamura for his assistance in the accurate collection of brain samples; and Mrs. Naomi Gamachi for her skillful western blotting techniques.
Author Contributions
Conceived and designed the experiments: KY ND HM. Performed the experiments: ND MS. Analyzed the data: KY ND MS YW MY H. Yamanishi HO HM. Contributed reagents/materi-als/analysis tools: KY YW MY H. Yamamoto YX WL. Wrote the paper: KY ND HM.
References
1. Health Statistics Office, Vital, Health and Social Statistics Division. Patient Survey. Ministry of Health, Labour and Welfare, Japan. 2011. Available:http://www.mhlw.go.jp/english/database/db-hss/ps.html.
2. Ministry of Health, Labour and Welfare. Health, Labour and Welfare Report. Ministry of Health, Labour and Welfare, Japan. 2010. Available:http://www.mhlw.go.jp/english/wp/wp-hw5/index.html.
3. Slattery DA, Hudson AL, Nutt DJ. Invited review: the evolution of antidepressant mechanisms. Fundam Clin Pharmacol. 2004; 18: 1–21. PMID:14748749
4. Radley JJ, Rocher AB, Miller M, Janssen WG, Liston C, Hof PR, et al. Repeated stress induces dendrit-ic spine loss in the rat medial prefrontal cortex. Cereb Cortex. 2006; 16: 313–320. PMID:15901656
6. Keedwell PA, Andrew C, Williams SC, Brammer MJ, Phillips ML. A double dissociation of ventromedial prefrontal cortical responses to sad and happy stimuli in depressed and healthy individuals. Biol Psychi-atry. 2005; 58: 495–503. PMID:15993859
7. Young EA, Korszun A. The hypothalamic-pituitary-gonadal axis in mood disorders. Endocrinol Metab Clin North Am. 2002; 31: 63–78. PMID:12055991
8. Paizanis E, Hamon M, Lanfumey L. Hippocampal neurogenesis, depressive disorders, and antidepres-sant therapy. Neural Plast. 2007; 2007: 73754. PMID:17641737
9. Light SN, Heller AS, Johnstone T, Kolden GG, Peterson MJ, Kalin NH, et al. Reduced right ventrolateral prefrontal cortex activity while inhibiting positive affect is associated with improvement in hedonic ca-pacity after 8 weeks of antidepressant treatment in major depressive disorder. Biol Psychiatry. 2011; 70: 962–968. doi:10.1016/j.biopsych.2011.06.031PMID:21867991
10. Diener C, Kuehner C, Brusniak W, Ubl B, Wessa M, Flor H. A meta-analysis of neurofunctional imaging studies of emotion and cognition in major depression. Neuroimage. 2012; 61: 677–685. doi:10.1016/j. neuroimage.2012.04.005PMID:22521254
11. Sawyer K, Corsentino E, Sachs-Ericsson N, Steffens DC. Depression, hippocampal volume changes, and cognitive decline in a clinical sample of older depressed outpatients and non-depressed controls. Aging Ment Health. 2012; 16: 753–762. doi:10.1080/13607863.2012.678478PMID:22548411
12. Dowlati Y, Herrmann N, Swardfager W, Liu H, Sham L, Reim EK, et al. A meta-analysis of cytokines in major depression. Biol Psychiatry. 2010; 67: 446–457. doi:10.1016/j.biopsych.2009.09.033PMID: 20015486
13. Schiepers OJ, Wichers MC, Maes M. Cytokines and major depression. Prog Neuropsychopharmacol Biol Psychiatry. 2005; 29: 201–217. PMID:15694227
14. Slavich GM, Irwin MR. From stress to inflammation and major depressive disorder: a social signal trans-duction theory of depression. Psychol Bull. 2014; 140: 774–815. doi:10.1037/a0035302PMID: 24417575
15. Oxenkrug GF. Tryptophan kynurenine metabolism as a common mediator of genetic and environmen-tal impacts in major depressive disorder: the serotonin hypothesis revisited 40 years later. Isr J Psychia-try Relat Sci. 2010; 47: 56–63. PMID:20686200
16. Hage MP, Azar ST. The Link between Thyroid Function and Depression. J Thyroid Res. 2012; 2012: 590648. doi:10.1155/2012/590648PMID:22220285
17. Ross DA, Cetas JS. Steroid psychosis: a review for neurosurgeons. J Neurooncol. 2012; 109: 439– 447. doi:10.1007/s11060-012-0919-zPMID:22763760
18. Shelton RC, Miller AH. Eating ourselves to death (and despair): the contribution of adiposity and inflam-mation to depression. Prog Neurobiol. 2010; 91: 275–299. doi:10.1016/j.pneurobio.2010.04.004 PMID:20417247
19. Schroeder V, Borner U, Gutknecht S, Schmid JP, Saner H, Kohler HP. Relation of depression to vari-ous markers of coagulation and fibrinolysis in patients with and without coronary artery disease. Eur J Cardiovasc Prev Rehabil. 2007; 14: 782–787. PMID:18043299
20. Geiser F, Meier C, Wegener I, Imbierowicz K, Conrad R, Liedtke R, et al. Association between anxiety and factors of coagulation and fibrinolysis. Psychother Psychosom. 2008; 77: 377–383. doi:10.1159/ 000151518PMID:18716423
21. Brown ES, Denniston D, Gabrielson B, Khan DA, Khanani S, Desai S. Randomized, double-blind, pla-cebo-controlled trial of acetaminophen for preventing mood and memory effects of prednisone bursts. Allergy Asthma Proc. 2010; 31: 331–336. doi:10.2500/aap.2010.31.3338PMID:20819324
22. Geiser F, Conrad R, Imbierowicz K, Meier C, Liedtke R, Klingmuller D, et al. Coagulation activation and fibrinolysis impairment are reduced in patients with anxiety and depression when medicated with sero-tonergic antidepressants. Psychiatry Clin Neurosci. 2011; 65: 518–525. doi:10.1111/j.1440-1819. 2011.02241.xPMID:21851461
23. Dong JY, Zhang YH, Tong J, Qin LQ. Depression and risk of stroke: a meta-analysis of prospective studies. Stroke. 2012; 43: 32–37. doi:10.1161/STROKEAHA.111.630871PMID:22020036
24. Marazziti D, Rutigliano G, Baroni S, Landi P, Dell'osso L. Metabolic syndrome and major depression. CNS Spectr. 2013: 1–12.
25. Rotella F, Mannucci E. Depression as a risk factor for diabetes: a meta-analysis of longitudinal studies. J Clin Psychiatry. 2013; 74: 31–37. doi:10.4088/JCP.12r07922PMID:23419223
27. Chien IC, Lin CH, Chou YJ, Chou P. Increased risk of hyperlipidemia in patients with major depressive disorder: a population-based study. J Psychosom Res. 2013; 75: 270–274. doi:10.1016/j.jpsychores. 2013.06.003PMID:23972417
28. Wahlqvist ML, Lee MS, Chuang SY, Hsu CC, Tsai HN, Yu SH, et al. Increased risk of affective disor-ders in type 2 diabetes is minimized by sulfonylurea and metformin combination: a population-based cohort study. BMC Med. 2012; 10: 150. doi:10.1186/1741-7015-10-150PMID:23194378
29. Ma XC, Jiang D, Jiang WH, Wang F, Jia M, Wu J, et al. Social isolation-induced aggression potentiates anxiety and depressive-like behavior in male mice subjected to unpredictable chronic mild stress. PLoS One. 2011; 6: e20955. doi:10.1371/journal.pone.0020955PMID:21698062
30. You Z, Luo C, Zhang W, Chen Y, He J, Zhao Q, et al. Pro- and anti-inflammatory cytokines expression in rat's brain and spleen exposed to chronic mild stress: involvement in depression. Behav Brain Res. 2011; 225: 135–141. doi:10.1016/j.bbr.2011.07.006PMID:21767575
31. Baigent C, Keech A, Kearney PM, Blackwell L, Buck G, Pollicino C, et al. Efficacy and safety of choles-terol-lowering treatment: prospective meta-analysis of data from 90,056 participants in 14 randomised trials of statins. Lancet. 2005; 366: 1267–1278. PMID:16214597
32. O'Donnell MJ, Xavier D, Liu L, Zhang H, Chin SL, Rao-Melacini P, et al. Risk factors for ischaemic and intracerebral haemorrhagic stroke in 22 countries (the INTERSTROKE study): a case-control study. Lancet. 2010; 376: 112–123. doi:10.1016/S0140-6736(10)60834-3PMID:20561675
33. Kahn R, Robertson RM, Smith R, Eddy D. The impact of prevention on reducing the burden of cardio-vascular disease. Circulation. 2008; 118: 576–585. doi:10.1161/CIRCULATIONAHA.108.190186 PMID:18606915
34. Willner P. Validity, reliability and utility of the chronic mild stress model of depression: a 10-year review and evaluation. Psychopharmacology (Berl). 1997; 134: 319–329.
35. Gilabert-Juan J, Castillo-Gomez E, Guirado R, Molto MD, Nacher J. Chronic stress alters inhibitory net-works in the medial prefrontal cortex of adult mice. Brain Struct Funct. 2013; 218: 1591–1605. doi:10. 1007/s00429-012-0479-1PMID:23179864
36. Huang da W, Sherman BT, Lempicki RA. Systematic and integrative analysis of large gene lists using DAVID bioinformatics resources. Nat Protoc. 2009; 4: 44–57. doi:10.1038/nprot.2008.211PMID: 19131956
37. Huang da W, Sherman BT, Lempicki RA. Bioinformatics enrichment tools: paths toward the compre-hensive functional analysis of large gene lists. Nucleic Acids Res. 2009; 37: 1–13. doi:10.1093/nar/ gkn923PMID:19033363
38. Shao L, Vawter MP. Shared gene expression alterations in schizophrenia and bipolar disorder. Biol Psychiatry. 2008; 64: 89–97. doi:10.1016/j.biopsych.2007.11.010PMID:18191109
39. Jagannathan K, Calhoun VD, Gelernter J, Stevens MC, Liu J, Bolognani F, et al. Genetic associations of brain structural networks in schizophrenia: a preliminary study. Biol Psychiatry. 2010; 68: 657–666. doi:10.1016/j.biopsych.2010.06.002PMID:20691427
40. Kahl KG, Greggersen W, Schweiger U, Cordes J, Balijepalli C, Losch C, et al. Prevalence of the meta-bolic syndrome in unipolar major depression. Eur Arch Psychiatry Clin Neurosci. 2012; 262: 313–320. doi:10.1007/s00406-011-0277-4PMID:22183567
41. Mehta D, Raison CL, Woolwine BJ, Haroon E, Binder EB, Miller AH, et al. Transcriptional signatures re-lated to glucose and lipid metabolism predict treatment response to the tumor necrosis factor antagonist infliximab in patients with treatment-resistant depression. Brain Behav Immun. 2013; 31: 205–215. doi: 10.1016/j.bbi.2013.04.004PMID:23624296
42. Laine B, Eeckhoute J, Suaud L, Briche I, Furuta H, Bell GI, et al. Functional properties of the R154X HNF-4alpha protein generated by a mutation associated with maturity-onset diabetes of the young, type 1. FEBS Lett. 2000; 479: 41–45. PMID:10940385
43. Vazquez-Borsetti P, Celada P, Cortes R, Artigas F. Simultaneous projections from prefrontal cortex to dopaminergic and serotonergic nuclei. Int J Neuropsychopharmacol. 2011; 14: 289–302. doi:10.1017/ S1461145710000349PMID:20374686
44. Mao ZM, Arnsten AF, Li BM. Local infusion of an alpha-1 adrenergic agonist into the prefrontal cortex impairs spatial working memory performance in monkeys. Biol Psychiatry. 1999; 46: 1259–1265. PMID:10560031
45. Avery RA, Franowicz JS, Studholme C, van Dyck CH, Arnsten AF. The alpha-2A-adrenoceptor agonist, guanfacine, increases regional cerebral blood flow in dorsolateral prefrontal cortex of monkeys perform-ing a spatial workperform-ing memory task. Neuropsychopharmacology. 2000; 23: 240–249. PMID:10942848
47. Raison CL, Rutherford RE, Woolwine BJ, Shuo C, Schettler P, Drake DF, et al. A randomized controlled trial of the tumor necrosis factor antagonist infliximab for treatment-resistant depression: the role of baseline inflammatory biomarkers. JAMA Psychiatry. 2013; 70: 31–41. doi:10.1001/2013. jamapsychiatry.4PMID:22945416
48. Kurose Y, Terashima Y. Histamine regulates food intake through modulating noradrenaline release in the para-ventricular nucleus. Brain Res. 1999; 828: 115–118. PMID:10320730
49. Lee MM, Reif A, Schmitt AG. Major depression: a role for hippocampal neurogenesis? Curr Top Behav Neurosci. 2013; 14: 153–179. doi:10.1007/7854_2012_226PMID:22903751
50. Eriksson PS, Perfilieva E, Bjork-Eriksson T, Alborn AM, Nordborg C, Peterson DA, et al. Neurogenesis in the adult human hippocampus. Nat Med. 1998; 4: 1313–1317. PMID:9809557
51. Bulla GA, Givens E, Brown S, Oladiran B, Kraus D. A common regulatory locus affects both HNF4/ HNF1alpha pathway activation and sensitivity to LPS-mediated apoptosis in rat hepatoma cells. J Cell Sci. 2001; 114: 1205–1212. PMID:11228163