HESSD
11, 6969–6992, 2014Technical Note: Reducing the spin-up
time of
H. Ajami et al.
Title Page
Abstract Introduction
Conclusions References
Tables Figures
◭ ◮
◭ ◮
Back Close
Full Screen / Esc
Printer-friendly Version Interactive Discussion
Discussion
P
a
per
|
Discus
sion
P
a
per
|
Discussion
P
a
per
|
Discussion
P
a
per
|
Hydrol. Earth Syst. Sci. Discuss., 11, 6969–6992, 2014 www.hydrol-earth-syst-sci-discuss.net/11/6969/2014/ doi:10.5194/hessd-11-6969-2014
© Author(s) 2014. CC Attribution 3.0 License.
This discussion paper is/has been under review for the journal Hydrology and Earth System Sciences (HESS). Please refer to the corresponding final paper in HESS if available.
Technical Note: Reducing the spin-up
time of integrated surface
water–groundwater models
H. Ajami1,2, J. P. Evans3,4, M. F. McCabe5, and S. Stisen6
1
School of Civil and Environmental Engineering, University of New South Wales, Sydney, Australia
2
Connected Waters Initiative Research Centre, University of New South Wales, Sydney, Australia
3
Climate Change Research Centre, University of New South Wales, Sydney, Australia
4
ARC Centre of Excellence for Climate System Science, University of New South Wales, Sydney, Australia
5
Water Desalination and Reuse Center, King Abdullah University of Science and Technology, Thuwal, Saudi Arabia
6
Geological Survey of Denmark and Greenland, Copenhagen, Denmark
Received: 30 April 2014 – Accepted: 21 June 2014 – Published: 26 June 2014
Correspondence to: H. Ajami ([email protected])
HESSD
11, 6969–6992, 2014Technical Note: Reducing the spin-up
time of
H. Ajami et al.
Title Page
Abstract Introduction
Conclusions References
Tables Figures
◭ ◮
◭ ◮
Back Close
Full Screen / Esc
Printer-friendly Version Interactive Discussion
Discussion
P
a
per
|
Discus
sion
P
a
per
|
Discussion
P
a
per
|
Discussion
P
a
per
Abstract
One of the main challenges in catchment scale application of coupled/integrated hy-drologic models is specifying a catchment’s initial conditions in terms of soil moisture and depth to water table (DTWT) distributions. One approach to reduce uncertainty in model initialization is to run the model recursively using a single or multiple years of
5
forcing data until the system equilibrates with respect to state and diagnostic variables. However, such “spin-up” approaches often require many years of simulations, making them computationally intensive. In this study, a new hybrid approach was developed to reduce the computational burden of spin-up time for an integrated groundwater-surface water-land surface model (ParFlow.CLM) by using a combination of ParFlow.CLM
sim-10
ulations and an empirical DTWT function. The methodology is examined in two catch-ments located in the temperate and semi-arid regions of Denmark and Australia spectively. Our results illustrate that the hybrid approach reduced the spin-up time re-quired by ParFlow.CLM by up to 50 %, and we outline a methodology that is applicable to other coupled/integrated modelling frameworks when initialization from equilibrium
15
state is required.
1 Introduction
The issue of model initialization is important for hydrologic predictions as the model state has a major impact on catchment’s response (Berthet et al., 2009). In cou-pled/integrated surface–subsurface models uncertainty in a catchment antecedent
20
condition is of particluar importance because both soil moisture distribution and depth to water table (DTWT) need to be specified at the start of a simulation (Ivanov et al., 2004; Noto et al., 2008).
Since there is often no a priori information on the spatial pattern of water table and soil moisture distributions, various approaches have been developed to determine
ini-25
HESSD
11, 6969–6992, 2014Technical Note: Reducing the spin-up
time of
H. Ajami et al.
Title Page
Abstract Introduction
Conclusions References
Tables Figures
◭ ◮
◭ ◮
Back Close
Full Screen / Esc
Printer-friendly Version Interactive Discussion
Discussion
P
a
per
|
Discus
sion
P
a
per
|
Discussion
P
a
per
|
Discussion
P
a
per
|
spatial distribution of initial DTWT. In another approach, Troch et al. (1993) used re-cession flow analysis to estimate the effective water table height of a catchment. Re-gardless of the choice of initial DTWT, the uncertainty involved is such that a period of spin-up is always required (Cloke et al., 2003) as the applied atmospheric forcing is often inconsistent with the hydrodynamic initialization of the catchment inferred from
5
limited observations (Ajami et al., 2014).
The two most common initialization approaches in coupled/integrated distributed hy-drologic models are as follows: (1) initial depth to water table is specified at a certain uniform depth below the land surface (Kollet and Maxwell, 2008), with the impact of initialization reduced through recursive simulations over a single or multiple years of
10
forcing data, until equilibrium conditions are reached: usually related to spin-up criteria based on changes in groundwater heads (Refsgaard, 1997) or changes in water and energy balances (Kollet and Maxwell, 2008); or (2) the model is initialized from a fully saturated condition and simulations are continued until modelled baseflow matches the observations (Jones et al., 2008).
15
Results of a ParFlow.CLM spin-up study for a catchment in Denmark showed that at least 20 years of recursive simulations were required to reach equilibrium in subsur-face storages, defined as when percent changes in monthly unsaturated and saturated zone storages were less than 0.1 and 0.01 % respectively (Ajami et al., 2014). For reference, 20 years of spin-up simulations required 20 000 service units on a high
per-20
formance parallel computing cluster: equivalent to over 26 days of computation using 32 processors. The challenge lies in designing methodologies to reduce spin-up time in computationally intensive integrated models such as ParFlow.CLM (Ashby and Fal-gout, 1996; Jones and Woodward, 2001; Kollet and Maxwell, 2006) when initialization from equilibrium states is required for transient simulations.
25
HESSD
11, 6969–6992, 2014Technical Note: Reducing the spin-up
time of
H. Ajami et al.
Title Page
Abstract Introduction
Conclusions References
Tables Figures
◭ ◮
◭ ◮
Back Close
Full Screen / Esc
Printer-friendly Version Interactive Discussion
Discussion
P
a
per
|
Discus
sion
P
a
per
|
Discussion
P
a
per
|
Discussion
P
a
per
simulation approach commonly applied for land surface model spin-up and referred to here as a baseline spin-up approach.
2 Data and methodology
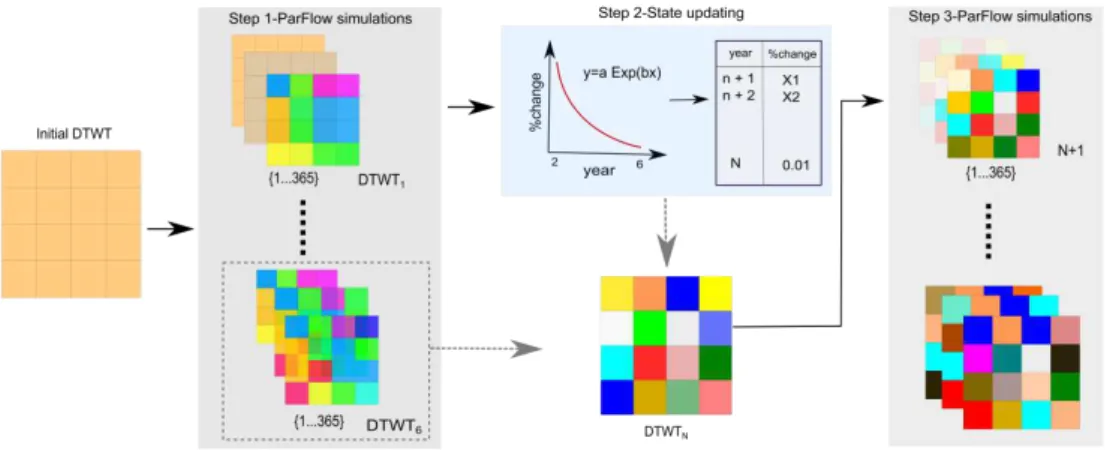
The hybrid approach consists of a two-stage model simulation step and an intermediate state updating step using the DTWT function. Figure 1 illustrates this hybrid spin-up
ap-5
proach. The applicability of the proposed scheme is examined against the equilibrated ParFlow.CLM model of the sub-catchment of the Skjern River basin in Denmark, de-veloped by Ajami et al. (2014) using a traditional baseline spin-up approach. Further, performance of the hybrid approach in reducing spin-up time is evaluated by developing a ParFlow.CLM model for a semi-arid catchment in Australia.
10
2.1 Overview of the ParFlow.CLM models
2.1.1 Sub-catchment of the Skjern River Basin, Denmark
The sub-catchment of the Skjern River basin in western Denmark has an area of 208 km2 (Fig. 2) that is characterized by mild topography and a temperate climate (Jensen and Illangasekare, 2011). Agricultural land is the dominant cover type (78 %),
15
with the remainder of the catchment area covered by evergreen needle leaf forest. The catchment’s ParFlow.CLM model covered a 28 km by 20 km area. The modelling grid had a horizontal resolution of 500 m and a vertical discretization of 0.5 m. Catch-ment topography was determined via a 500 m digital elevation model (DEM) and the bottom elevation of the domain was a uniform−75 m. At the land surface, the ParFlow
20
HESSD
11, 6969–6992, 2014Technical Note: Reducing the spin-up
time of
H. Ajami et al.
Title Page
Abstract Introduction
Conclusions References
Tables Figures
◭ ◮
◭ ◮
Back Close
Full Screen / Esc
Printer-friendly Version Interactive Discussion
Discussion
P
a
per
|
Discus
sion
P
a
per
|
Discussion
P
a
per
|
Discussion
P
a
per
|
Ground surface temperature was set to the mean annual air temperature (281 K) at the start of a simulation. Prescribed subsurface hydraulic parameters include the sat-urated hydraulic conductivity (0.3 m h−1), porosity (0.39), van Genuchten parameters (α=1.5 m−1andn
=2), and relative residual saturation (0.1).
2.1.2 Baldry sub-catchment, Australia
5
The Baldry sub-catchment, located in central west New South Wales of Australia, has an area of 1.9 km2with an elevation range from 443 m to 500 m (Fig. 2). For the spin-up experiment, the catchment land cover was assumed to be evergreen broadleaf forest representing eucalyptus plantation.
The ParFlow.CLM model of the site was set up over a 2.9 km by 2.9 km area
encom-10
passing the Baldry catchment. Catchment topography was represented using a 60 m pre-processed DEM. The bottom elevation of the modelling grid was a uniform 400 m. The modelling grid had a 60 m resolution in thex andy directions and its vertical dis-cretization was 0.5 m resulting in a 48×48×203 grid. At the land surface, the ParFlow
free-surface overland flow boundary condition was assigned. A no-flow boundary
con-15
dition was specified for the lateral and bottom boundaries. Hourly forcing data for the year 2004 were obtained from a weather station at the site. For the hourly downward longwave radiation, the Modern Era Retrospective Analysis for Research and Appli-cations (MERRA) reanalyses data interpolated to 0.25◦
×0.25◦ resolution was used
(Decker et al., 2012). Prescribed subsurface hydraulic parameters include the
satu-20
rated hydraulic conductivity (0.18 m h−1), porosity (0.25), van Genuchten parameters (α=1.5 m−1 and n
HESSD
11, 6969–6992, 2014Technical Note: Reducing the spin-up
time of
H. Ajami et al.
Title Page
Abstract Introduction
Conclusions References
Tables Figures
◭ ◮
◭ ◮
Back Close
Full Screen / Esc
Printer-friendly Version Interactive Discussion
Discussion
P
a
per
|
Discus
sion
P
a
per
|
Discussion
P
a
per
|
Discussion
P
a
per
2.2 Development of empirical DTWT functions for model re-initialization
Analysis of ParFlow.CLM spin-up behavior via the baseline spin-up approach for the sub-catchment of the Skjern River identified that percentage changes in subsurface storages and DTWT had the form of an exponential decay (Ajami et al., 2014). Us-ing the functional relationships between number of simulation years and percentage
5
change of a variable, Ajami et al. (2014) developed a series of spin-up functions based on 16 years of initial ParFlow.CLM simulations. These spin-up functions were used to predict the number of years required until the model equilibrated, based on a prede-fined threshold i.e. 0.1 or 0.01 % change for a given variable.
Conversely, the inverse of a spin-up function for DTWT predicts percent changes in
10
DTWT as a function of simulation years, which hereinafter is referred to as the empirical DTWT function. In this study, we examined the capabilities of empirical DTWT functions as a means for updating DTWT and hence groundwater storage after just a few initial ParFlow.CLM spin-up simulations. The expectation is that this state updating should reduce the total number of spin-up years of simulation, substantially reducing the
com-15
putational burden. To do this, a series of spin-up simulations were performed based on an arbitrary initial state (DTWT was 3 m below the land surface as in Ajami et al., 2014), in order to identify the minimum number of data points required to develop an empirical DTWT function (stage 1 of model simulation).
Due to the anticipated large changes in mean annual DTWT values between the first
20
and second year of the spin-up simulation, the first year of data is removed from the analysis. This means that a minimum of four data points (i.e. 6 cycles of ParFlow.CLM simulations) are required to fit a double exponential function to percentage change values. Therefore, six years of spin-up simulations were performed using forcing data for the year 2003. Percent changes in catchment and domain averaged annual DTWT
25
HESSD
11, 6969–6992, 2014Technical Note: Reducing the spin-up
time of
H. Ajami et al.
Title Page
Abstract Introduction
Conclusions References
Tables Figures
◭ ◮
◭ ◮
Back Close
Full Screen / Esc
Printer-friendly Version Interactive Discussion
Discussion
P
a
per
|
Discus
sion
P
a
per
|
Discussion
P
a
per
|
Discussion
P
a
per
|
exponential (Eq. 2) terms:
y=aexp(bx) (1)
y=aexp(bx)+cexp(dx) (2)
wherey is the percentage change in DTWT,x is the number of simulation years, and
5
a,b,c,d are the fitting parameters.
These empirical DTWT functions estimate percentage changes in DTWT as a func-tion of simulafunc-tion years. Depending on the number of ParFlow.CLM cycles used to fit the DTWT functions (i.e. 2 to 6, cycles), the mean annual DTWT from the last cycle of the ParFlow.CLM spin-up simulation for every grid cell was used as the initial value to
10
estimate DTWT distributions based on the predicted percent change values. To assess the performance of these DTWT functions, estimated mean annual DTWT from the DTWT functions were compared against mean annual DTWT from the ParFlow.CLM model of Ajami et al. (2014) spun-up for 20 years.
In the state updating stage, the best performing empirical DTWT function (a double
15
exponential DTWT function) was used to estimate percentage changes in DTWT as a function of simulation years, until percentage changes reached the 0.01 % threshold. Using the percent change values and mean annual DTWT distribution from the sixth cycle of the ParFlow.CLM spin-up simulation, spatially distributed DTWT was predicted. In the second stage of model simulations, the ParFlow.CLM was re-initialized using
20
newly estimated DTWT values from a double exponential DTWT function, and spin-up simulations were continued until equilibration based on subsurface storage spin-spin-up criteria. The second stage of spin-up simulations was necessary to ensure equilibrium after re-initialization, especially for the unsaturated zone storage.
One issue with the re-initialization of DTWT using the DTWT function is that the
distri-25
HESSD
11, 6969–6992, 2014Technical Note: Reducing the spin-up
time of
H. Ajami et al.
Title Page
Abstract Introduction
Conclusions References
Tables Figures
◭ ◮
◭ ◮
Back Close
Full Screen / Esc
Printer-friendly Version Interactive Discussion
Discussion
P
a
per
|
Discus
sion
P
a
per
|
Discussion
P
a
per
|
Discussion
P
a
per
land surface; and (2) adjusting the pressure head distribution of the unsaturated zone from the last day of the sixth cycle of ParFlow.CLM spin-up simulations based on new DTWT values.
2.3 Evaluation of the hybrid spin-up approach
Performance of the hybrid spin-up approach in reducing the spin-up time is evaluated
5
by developing a ParFlow.CLM model for the Baldry sub-catchment. The baseline spin-up simulations were performed using spatially uniform, hourly forcing data for the year 2004. The equilibrium condition was achieved when percent changes in catchment av-eraged monthly groundwater storages were below 0.1 % threshold level. In the next step, the hybrid spin-up approach outlined in Sect. 2.2 was implemented to re-initialize
10
the ParFlow.CLM using the adjusted pressure head distribution approach above the water table. Recursive simulations after re-initialization continued until equilibrium con-dition was achieved.
3 Results
3.1 Performance of empirical DTWT functions in predicting DTWT
15
Performance of the single and double exponential DTWT functions in predicting 14 years of DTWT were compared against ParFlow.CLM baseline spin-up simulations (years 7 through 20) of Ajami et al. (2014) to find the optimum empirical DTWT func-tion for the Skjern River sub-catchment. Post-simulafunc-tion analysis indicates that global DTWT functions based on domain or catchment averaged percentage change values
20
HESSD
11, 6969–6992, 2014Technical Note: Reducing the spin-up
time of
H. Ajami et al.
Title Page
Abstract Introduction
Conclusions References
Tables Figures
◭ ◮
◭ ◮
Back Close
Full Screen / Esc
Printer-friendly Version Interactive Discussion
Discussion
P
a
per
|
Discus
sion
P
a
per
|
Discussion
P
a
per
|
Discussion
P
a
per
|
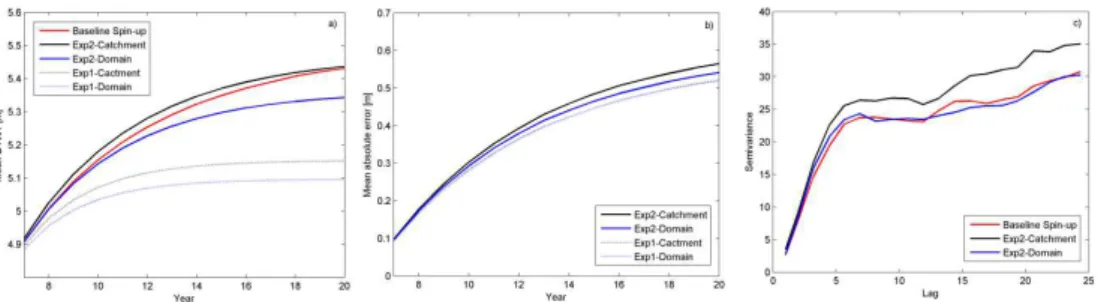
Calculated root mean square difference (RMSD) and percent bias relative to the baseline spin-up simulations indicate that global double exponential functions using ParFlow.CLM spin-up simulations 2 to 6 provide a better fit compared to various sin-gle exponential functions obtained from different spin-up simulation years (e.g. 2 to 3, 2 to 4, etc.). Only for the mean absolute error (MAE) do single exponential
func-5
tions based on simulations 2 to 6 perform better than the double exponential functions (Fig. 3b). Because the first six cycles of ParFlow.CLM simulations were the same be-tween the baseline spin-up simulations and DTWT distributions presented in Fig. 3, comparisons were made with simulations 7 to 20 of the baseline spin-up approach of Ajami et al. (2014). As can be seen from Fig. 3, the mean annual DTWT from single
10
exponential functions (fitted to percentage change data from simulations 2 to 6) under-predict the baseline spin-up simulations in comparison to double exponential functions fitted to the same data points. In terms of mean DTWT (Fig. 3a), the catchment delin-eated double exponential DTWT function provides a better prediction when compared to the function based on the entire model domain. However, Fig. 3b indicates that the
15
mean absolute error values are slightly smaller for the domain based double exponen-tial function.
To investigate this further, three empirical semi-variograms were generated by re-moving the trend from DTWT values using a polynomial function and calculating the semi-variance of the residuals as a function of distance. The semi-variance is a
mea-20
sure for spatial variance of a variable and presents average dissimilarity between data pairs at a given distance. Investigating the empirical semi-variograms of DTWT values (Fig. 3c) indicates that the domain based double DTWT function is a better predictor of DTWT, because the spatial structure of DTWT is sufficiently reproduced by the domain based function, and the catchment based function had a higher variance compared
25
HESSD
11, 6969–6992, 2014Technical Note: Reducing the spin-up
time of
H. Ajami et al.
Title Page
Abstract Introduction
Conclusions References
Tables Figures
◭ ◮
◭ ◮
Back Close
Full Screen / Esc
Printer-friendly Version Interactive Discussion
Discussion
P
a
per
|
Discus
sion
P
a
per
|
Discussion
P
a
per
|
Discussion
P
a
per
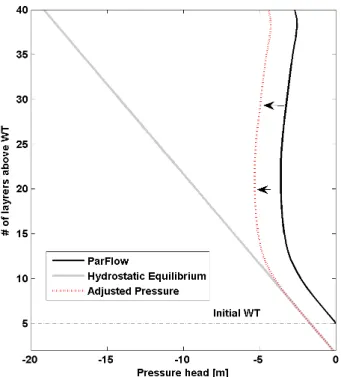
3.2 Impact of unsaturated zone re-initialization on ParFlow.CLM spin-up
Impacts of re-initializing the unsaturated zone using the hydrostatic equilibrium vs. ad-justed vertical pressure distribution on the spin-up time were also explored using the ParFlow.CLM simulations of the Skjern River sub-catchment. As can be seen from Fig. 4, the difference between the two initialization methods is more pronounced in
ar-5
eas of deep water table, where hydrostatic pressure head distribution results in a drier unsaturated zone compared to adjusted pressure head distribution. Results indicate that after re-initialization, the system equilibrated after 6 additional years of spin-up simulation when using the hydrostatic equilibrium option. With the adjusted pressure head distribution option, only 4 additional years of spin-up simulation were required.
10
Therefore, depending on the pressure head distribution above the water table, either 10 or 12 years of ParFlow.CLM simulations were sufficient to ensure subsurface storage equilibrium, reducing the spin-up time by 40 or 50 %, compared to the baseline spin-up approach. Improved performance of the adjusted pressure distribution is related to the fact that information about soil moisture distribution from stage 1 of spin-up simulations
15
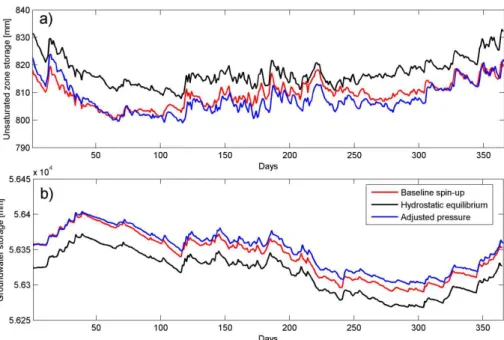
is preserved in this approach. In both initialization approaches, the groundwater stor-age was equilibrated at the 0.01 % threshold level, based on changes in mean monthly values. In comparison to the baseline spin-up approach, both groundwater and unsat-urated zone storages of the equilibrium year are closely reproduced by the adjusted pressure head distribution option (Fig. 5). For the hydrostatic equilibrium, increases in
20
unsaturated zone storage compared to the baseline spin-up resulted in unsaturated zone equilibrium at different threshold level.
Changes in annual water balance after re-initialization were also compared against the baseline spin-up approach of Ajami et al. (2014). While changes in annual evap-otranspiration were approximately 1 mm between the two spin-up approaches (annual
25
re-HESSD
11, 6969–6992, 2014Technical Note: Reducing the spin-up
time of
H. Ajami et al.
Title Page
Abstract Introduction
Conclusions References
Tables Figures
◭ ◮
◭ ◮
Back Close
Full Screen / Esc
Printer-friendly Version Interactive Discussion
Discussion
P
a
per
|
Discus
sion
P
a
per
|
Discussion
P
a
per
|
Discussion
P
a
per
|
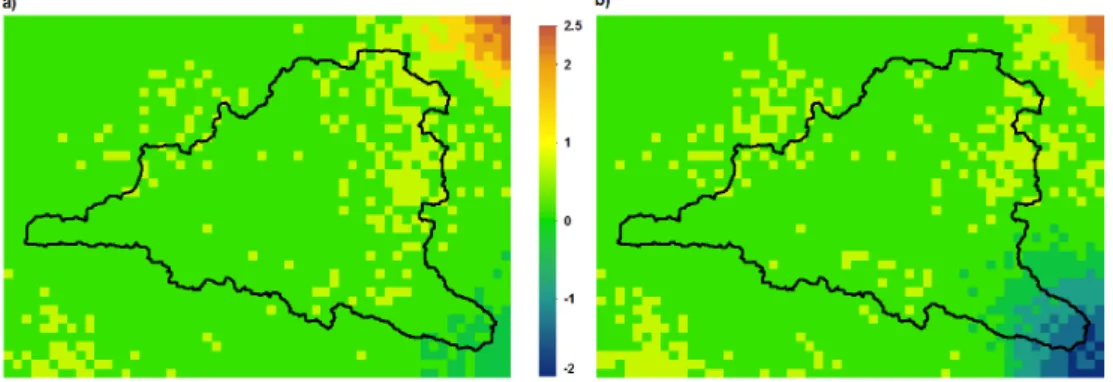
initialization, DTWT decreased as simulations proceed and the system reached equi-librium (Fig. 5). Differences in simulated DTWT from the last day of the ParFlow.CLM simulations after re-initialization and the baseline spin-up approach varied by up to 2 m inside the catchment boundary (Fig. 6), although most areas were within 0.5 m. Differences were more pronounced in areas of higher elevation in the catchment.
Fig-5
ure 6 shows that the hydrostatic equilibrium pressure head adjustment leads to a clear bias with consistent over estimation of the DTWT, while the adjusted vertical pressure distribution produces a distribution of pressure head errors centred on the expected value.
3.3 Evalulation of the hybrid spin-up approach
10
Similar to the Skjern River sub-catchment, percent changes in monthly groundwater storages were used to assess equilibrium condition. However, for the Baldry sub-catchment a threshold level of 0.1 % was chosen as the convergence criterion. Results indicated that 28 years of recursive simulations were required until the model equi-librated based on monthly groundwater storage changes. For reference, 28 years of
15
baseline spin-up simulations for Baldry required 37 000 service units equivalent to 24 days of computation using 64 processors of a high performance computing cluster.
Similar to the Skjern River sub-catchment, a double exponential DTWT function us-ing simulations 2 to 6 resulted in WT distributions with the smallest RMSD and percent bias relative to the baseline spin-up simulations. For Baldry, a domain based double
ex-20
ponential function had the closest mean (Fig. S1a in the Supplement) and the smallest mean absolute error relative to the baseline simulation (Fig. S1b in the Supplement). However, DTWT semi-variograms showed higher variances in the domain based dou-ble exponential function relative to the catchment based function. Despite the slight differences in the predictive power of DTWT functions between the two catchments,
25
HESSD
11, 6969–6992, 2014Technical Note: Reducing the spin-up
time of
H. Ajami et al.
Title Page
Abstract Introduction
Conclusions References
Tables Figures
◭ ◮
◭ ◮
Back Close
Full Screen / Esc
Printer-friendly Version Interactive Discussion
Discussion
P
a
per
|
Discus
sion
P
a
per
|
Discussion
P
a
per
|
Discussion
P
a
per
After re-initialization with the adjusted pressure head distribution, only 8 additional sim-ulations were required until percent changes in monthly groundwater storages reached below the 0.1 % level. This result indicates a 50 % reduction in the spin-up time of a semi-arid catchment when the hybrid spin-up approach is used.
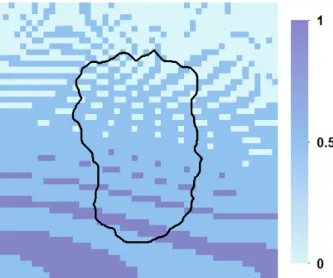
Comparison of WT distributions from the last day of equilibrium simulations (baseline
5
simulation and the hybrid approach) illustrated differences of up to 1 m (Fig. 7). How-ever, for the majority of cells inside the catchment, differences were up to 0.5 m. Sim-ilar to the Skjern River sub-catchment, the largest differences in WT distribution were observed in higher elevation areas. Lower WT levels in the hybrid spin-up approach resulted in larger unsaturated zone storage compared to the baseline spin-up (Fig. S2
10
in the Supplement). In this semi-arid catchment, no stream flow was generated at the catchment’s outlet for the equilibrium year. The difference in annual evapotranspiration was only 0.2 mm between the two equilibrium simulations (Table 2).
4 Summary
We present a hybrid approach for reducing the number of spin-up simulations of the
15
integrated hydrological model ParFlow.CLM. In the case of the Skjern River and the Baldry sub-catchments, simulation time decreased by 50 % compared to the baseline spin-up approach when an adjusted pressure head distribution was specified above the water table. Although, ParFlow.CLM was used as a modeling platform, the developed methodology is applicable to other coupled/integrated hydrologic models. Therefore,
20
a general approach to spin-up should include the following steps: (1) perform six years of hydrologic model simulations with DTWT initialized via an informed guess (here 2 m and 3 m below the land surface for the Baldry and Skjern River sub-catchments respectively), (2) calculate a global double exponential DTWT function using domain wide data and estimate the new DTWT for the desired equilibration level, (3)
imple-25
HESSD
11, 6969–6992, 2014Technical Note: Reducing the spin-up
time of
H. Ajami et al.
Title Page
Abstract Introduction
Conclusions References
Tables Figures
◭ ◮
◭ ◮
Back Close
Full Screen / Esc
Printer-friendly Version Interactive Discussion
Discussion
P
a
per
|
Discus
sion
P
a
per
|
Discussion
P
a
per
|
Discussion
P
a
per
|
being used to define initial states of the model, this process has the potential to as-sist in parameter calibration. Previous efforts in calibrating coupled/integrated hydro-logic models required a spin-up process after every parameter update (Stisen et al., 2011; Weill et al., 2013). Development of the hybrid spin-up approach could be one step towards enabling systematic calibration of integrated/coupled hydrologic models.
5
However, further refinement is required to facilitate automatic calibration approaches. Additional experiments across multiple catchments with different climate and subsur-face heterogeneity and DTWT initializations are also required to assess the efficiency of the proposed approach in reducing time to equilibration in a variety of settings. Re-ducing the required spin-up time of integrated/coupled hydrologic models will expand
10
their application for hydrological investigations and facilitate the use of these models to investigate both real world and theoretical system behavior.
The Supplement related to this article is available online at doi:10.5194/hessd-11-6969-2014-supplement.
Acknowledgements. This research was funded by the Australian Research Council and the
15
National Water Commission through support of the National Centre for Groundwater Research and Training (NCGRT). We acknowledge the support provided by the National Computational Infrastructure at the Australian National University through the National Computational Merit Allocation Scheme, Intersect partner share and University of New South Wales LIEF grant (LE120100181) for high performance computing. The use of high performance computing
fa-20
HESSD
11, 6969–6992, 2014Technical Note: Reducing the spin-up
time of
H. Ajami et al.
Title Page
Abstract Introduction
Conclusions References
Tables Figures
◭ ◮
◭ ◮
Back Close
Full Screen / Esc
Printer-friendly Version Interactive Discussion
Discussion
P
a
per
|
Discus
sion
P
a
per
|
Discussion
P
a
per
|
Discussion
P
a
per
References
Ajami, H., McCabe, M. F., Evans, J. P., and Stisen, S.: Assessing the impact of model spin-up on surface water–groundwater interactions using an integrated hydrologic model, Water Resour. Res., 50, 2636–2656, doi:10.1002/2013WR014258, 2014.
Ashby, S. F. and Falgout, R. D.: A parallel multigrid preconditioned conjugate gradient algorithm
5
for groundwater flow simulations, Nucl. Sci. Eng., 124, 145–159, 1996.
Berthet, L., Andréassian, V., Perrin, C., and Javelle, P.: How crucial is it to account for the antecedent moisture conditions in flood forecasting? Comparison of event-based and continuous approaches on 178 catchments, Hydrol. Earth Syst. Sci., 13, 819–831, doi:10.5194/hess-13-819-2009, 2009.
10
Cloke, H. L., Renaud, J. P., Claxton, A. J., McDonnell, J. J., Anderson, M. G., Blake, J. R., and Bates, P. D.: The effect of model configuration on modelled hillslope–riparian interactions, J. Hydrol., 279, 167–181, doi:10.1016/S0022-1694(03)00177-X, 2003.
Decker, M., Pitman, A. J., and Evans, J. P.: Groundwater constraints on simulated transpiration variability over southeastern Australian forests, J. Hydrometeorol., 14, 543–559, 2012.
15
Ivanov, V. Y., Vivoni, E. R., Bras, R. L., and Entekhabi, D.: Catchment hydrologic response with a fully distributed triangulated irregular network model, Water Resour. Res., 40, W11102, doi:10.1029/2004wr003218, 2004.
Jensen, K. H. and Illangasekare, T. H.: HOBE: a hydrological observatory, Vadose Zone J., 10, 1–7, doi:10.2136/vzj2011.0006, 2011.
20
Jones, J. E. and Woodward, C. S.: Newton–Krylov-multigrid solvers for large-scale, highly heterogeneous, variably saturated flow problems, Adv. Water Resour., 24, 763–774, doi:10.1016/s0309-1708(00)00075-0, 2001.
Jones, J. P., Sudicky, E. A., and McLaren, R. G.: Application of a fully-integrated surface– subsurface flow model at the watershed-scale: a case study, Water Resour. Res., 44,
25
W03407, doi:10.1029/2006wr005603, 2008.
Kollet, S. J. and Maxwell, R. M.: Integrated surface–groundwater flow modeling: a free-surface overland flow boundary condition in a parallel groundwater flow model, Adv. Water Resour., 29, 945–958, doi:10.1016/j.advwatres.2005.08.006, 2006.
Kollet, S. J. and Maxwell, R. M.: Capturing the influence of groundwater dynamics on land
30
HESSD
11, 6969–6992, 2014Technical Note: Reducing the spin-up
time of
H. Ajami et al.
Title Page
Abstract Introduction
Conclusions References
Tables Figures
◭ ◮
◭ ◮
Back Close
Full Screen / Esc
Printer-friendly Version Interactive Discussion
Discussion
P
a
per
|
Discus
sion
P
a
per
|
Discussion
P
a
per
|
Discussion
P
a
per
|
Noto, L. V., Ivanov, V. Y., Bras, R. L., and Vivoni, E. R.: Effects of initializa-tion on response of a fully-distributed hydrologic model, J. Hydrol., 352, 107–125, doi:10.1016/j.jhydrol.2007.12.031, 2008.
Refsgaard, J. C.: Parameterisation, calibration and validation of distributed hydrological models, J. Hydrol., 198, 69–97, doi:10.1016/s0022-1694(96)03329-x, 1997.
5
Sivapalan, M., Beven, K., and Wood, E. F.: On hydrologic similarity: 2. A scaled model of storm runoff production, Water Resour. Res., 23, 2266–2278, doi:10.1029/WR023i012p02266, 1987.
Stisen, S., Sonnenborg, T. O., Hojberg, A. L., Troldborg, L., and Refsgaard, J. C.: Evaluation of climate input biases and water balance issues using a coupled surface–subsurface model,
10
Vadose Zone J., 10, 37–53, doi:10.2136/vzj2010.0001, 2011.
Troch, P. A., Mancini, M., Paniconi, C., and Wood, E. F.: Evaluation of a distributed catchment scale water balance model, Water Resour. Res., 29, 1805–1817, doi:10.1029/93wr00398, 1993.
Weill, S., Altissimo, M., Cassiani, G., Deiana, R., Marani, M., and Putti, M.: Saturated area
15
HESSD
11, 6969–6992, 2014Technical Note: Reducing the spin-up
time of
H. Ajami et al.
Title Page
Abstract Introduction
Conclusions References
Tables Figures
◭ ◮
◭ ◮
Back Close
Full Screen / Esc
Printer-friendly Version Interactive Discussion
Discussion
P
a
per
|
Discus
sion
P
a
per
|
Discussion
P
a
per
|
Discussion
P
a
per
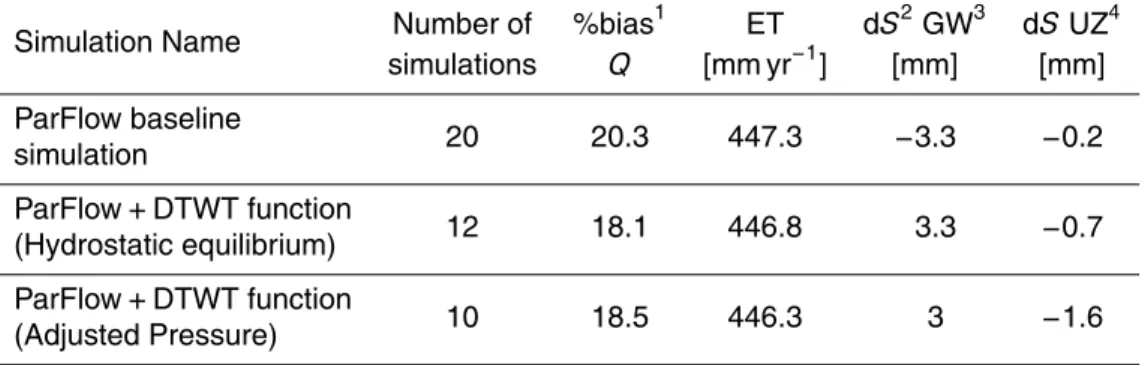
Table 1.Skjern River sub-catchment annual water balance for the equilibrium year after the baseline spin-up approach and the hybrid approach using the hydrostatic equilibrium and adjusted pressure head distribution options above the water table. Annual precipitation is 801.6 mm.
Simulation Name Number of %bias
1
ET dS2GW3 dSUZ4 simulations Q [mm yr−1] [mm] [mm]
ParFlow baseline
20 20.3 447.3 −3.3 −0.2
simulation
ParFlow+DTWT function
12 18.1 446.8 3.3 −0.7
(Hydrostatic equilibrium)
ParFlow+DTWT function
10 18.5 446.3 3 −1.6
(Adjusted Pressure)
1Percent bias is based on observed discharge at the gauge shown in Fig. 2. 2Changes in storage.
HESSD
11, 6969–6992, 2014Technical Note: Reducing the spin-up
time of
H. Ajami et al.
Title Page
Abstract Introduction
Conclusions References
Tables Figures
◭ ◮
◭ ◮
Back Close
Full Screen / Esc
Printer-friendly Version Interactive Discussion
Discussion
P
a
per
|
Discus
sion
P
a
per
|
Discussion
P
a
per
|
Discussion
P
a
per
|
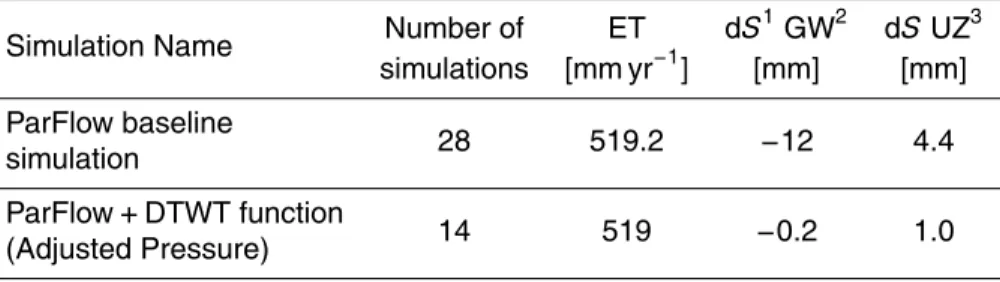
Table 2.Baldry sub-catchment annual water balance for the equilibrium year after the baseline spin-up approach and the hybrid approach with the adjusted pressure head distribution option above the water table. Annual precipitation is 674.8 mm.
Simulation Name Number of ET dS
1
GW2 dS UZ3 simulations [mm yr−1] [mm] [mm]
ParFlow baseline
28 519.2 −12 4.4
simulation
ParFlow+DTWT function
14 519 −0.2 1.0
(Adjusted Pressure)
HESSD
11, 6969–6992, 2014Technical Note: Reducing the spin-up
time of
H. Ajami et al.
Title Page
Abstract Introduction
Conclusions References
Tables Figures
◭ ◮
◭ ◮
Back Close
Full Screen / Esc
Printer-friendly Version Interactive Discussion
Discussion
P
a
per
|
Discus
sion
P
a
per
|
Discussion
P
a
per
|
Discussion
P
a
per
|
HESSD
11, 6969–6992, 2014Technical Note: Reducing the spin-up
time of
H. Ajami et al.
Title Page
Abstract Introduction
Conclusions References
Tables Figures
◭ ◮
◭ ◮
Back Close
Full Screen / Esc
Printer-friendly Version Interactive Discussion
Discussion
P
a
per
|
Discus
sion
P
a
per
|
Discussion
P
a
per
|
Discussion
P
a
per
|
HESSD
11, 6969–6992, 2014Technical Note: Reducing the spin-up
time of
H. Ajami et al.
Title Page
Abstract Introduction
Conclusions References
Tables Figures
◭ ◮
◭ ◮
Back Close
Full Screen / Esc
Printer-friendly Version Interactive Discussion
Discussion
P
a
per
|
Discus
sion
P
a
per
|
Discussion
P
a
per
|
Discussion
P
a
per
|
Figure 6. Differences in equilibrium DTWT between ParFlow.CLM simulations after re-initializations and ParFlow.CLM after 20 years of baseline spin-up simulations in (m), where
HESSD
11, 6969–6992, 2014Technical Note: Reducing the spin-up
time of
H. Ajami et al.
Title Page
Abstract Introduction
Conclusions References
Tables Figures
◭ ◮
◭ ◮
Back Close
Full Screen / Esc
Printer-friendly Version Interactive Discussion
Discussion
P
a
per
|
Discus
sion
P
a
per
|
Discussion
P
a
per
|
Discussion
P
a
per