Original papers
GLASS MELTING PHENOMENA, THEIR ORDERING
AND MELTING SPACE UTILISATION
LUBOMÍR NĚMEC, #MARCELA JEBAVÁ, PETRA DYRČÍKOVÁ
Laboratory of Inorganic Materials, joint workplace of the Institute of Chemical Technology Prague and the Institute of Rock Structure and Mechanics of the ASCR, v.v.i.
V Holešovičkách 41, 18209 Prague, Czech Republic
#E-mail: [email protected]
Submitted June 15, 2013; accepted November 25, 2013
Keywords: Glass melting, Space utilization, Melt flow, Phenomena ordering, Melting performance
Four aspects of effective glass melting have been defined – namely the fast kinetics of partial melting phenomena, a con-sideration of the melting phenomena ordering, high utilisation of the melting space, and effective utilisation of the supplied energy. The relations were defined for the specific melting performance and specific energy consumption of the glass melting process which involve the four mentioned aspects of the process and indicate the potentials of effective melting. The quantity “space utilisation” has been treated in more detail as an aspect not considered in practice till this time. The space utilisation was quantitatively defined and its values have been determined for the industrial melting facility by mathematical modelling. The definitions of the specific melting performance and specific energy consumption have been used for assessment of the potential impact of a controlled melt flow and high space utilisation on the melting process efficiency on the industrial scale. The results have shown that even the partial control of the melt flow, leading to the partial increase of the space utilisation, may considerably increase the melting performance, whereas a decrease of the specific energy consumption was determined to be between 10 - 15 %.
INTRODUCTION
Phenomena of glass melting either cooperate to-wards homogeneous glass (inhomogeneity dissolution, fining, melt convection in melting space) or lower its quality (bubble nucleation, foaming). Different aspects of the process play a less or more important role here. The mutual effect and ordering of the glass melting phenomena, as well as the present significance of the melting aspects require the analysis and evaluation in the framework of the entire glass melting process. This paper will endeavour to provide that description.
THEORETICAL The principal aspects, phenomena
and quantities of glass melting
The effective glass melting process needs to be eva- luated with the assistance of its basic aspects and phe-nomena. The basic aspects may be considered to be [1]: - rapid kinetics of the single melting phenomena, - consideration of phenomena mutual ordering, - effective utilisation of the melting space, - effective utilisation of the supplied energy.
The basic homogenization phenomena of the mel-ting process are considered to be:
- the batch conversion (heat, mass transfer and chemical reactions),
- the removal of solid and liquid inhomogeneities (mass transfer),
- the bubble nucleation and removal (mass transfer and separation).
The industrial process is characterized by the tech- nological quantities which provide evidence about pro-cess efficiency. The specific energy consumption, specific melting performance and final glass quality are the most interesting issues of glass technology. The incorporation of the four process aspects into the mentioned quantities is therefore desirable. Such an incorporation can easily illustrate where the potentials are for an effective melting process.
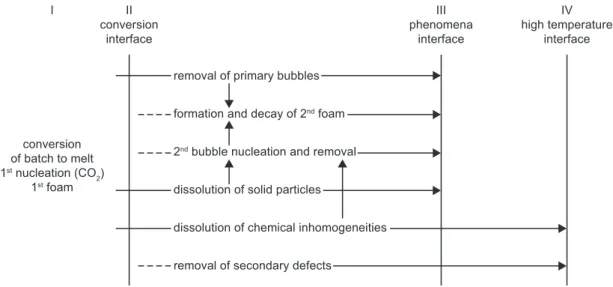
bubble nucleation and first foaming occur already in the batch region and the principal melting phenomena such as dissolution and removal of primary bubbles start here, as well. The particle dissolution, bubble removal and foaming should be terminated at the end of the principal phenomena region whereas the dissolution of chemical inhomogeneities is accomplished only at the end of the high temperature region. The glass defects that arise owing to different interactions remain up to the facility output; nevertheless, neither this issue nor chemical homogenization is within the scope of this work. Phenomena linking in the region of the principal melting phenomena, i.e. the serial ordering (sequencing) of bubble nucleation with the dissolution of inhomogeneities or foaming with bubble removal, is crucial. The phenomena ordering should be taken into account when estimating the duration, energy consumption and performance of the melting process.
The definition of the specific melting performance and specific energy consumption of an industrial melting space
If the process is generally implemented in m serial melting spaces and the performances of controlling phenomena in single spaces are balanced, the specific melting performance - expressed by the j-th phenomenon (or by the sum of phenomena in the series) controlling the process in the i-th space - is defined by:
(1)
where uij is the space utilisation of the j-th phenomenon (or sum of phenomena), controlling the process in the i-th melting space. The space utilisation quantitatively expresses a mapping of the course of the given homo-genization phenomenon at a given melt flow character.
Further, j is the index of the controlling phenomenon in the i-th melting space, τHRefij is the reference homoge-nization time of the j-th independent phenomenon in the i-th melting space, and the phenomenon may start either in the i-th or in one of previous melting spaces.
So, the specific melting performance involves three out of four melting aspects: the kinetics is represented either by the value of τHRefij in equation (1) or by the sum of serial phenomena when the value of τHRefij in equation (1) is replaced by Σn
j =1 τHRefij. The ordering aspect is
con-tained in the choice of the controlling phenomenon, in the reference homogenisation time τHRefij, or in the fact of the use of Σn
j =1 τHRefij. The glass quality as a
technologi-cal value is automatitechnologi-cally included in values of τHRefij because the reference times designate the full accomplish-ment of the phenomenon. The space utilisation aspect is given by the value of uij.
The specific energy consumption of a complex pro-cess space is defined in summary form as:
(2)
where HH M
i is the overall heat bound with chemical reactions in the batch and with heating of both the batch and glass in the i-th space. It involves both the theoretical heat and the heat of the departing combustion gases provided that process combustion is applied. m is the number of melting spaces, HL
M i is the overall heat bound with the maintenance of a constant temperature in the i-th melting space. It involves both heat losses through boundaries and the heat carried out by combustion gases if the combustion process is applied.
The overall heat bound with heating, HH
M i in a current one-space melting facility (i = 1) is predominantly con-centrated in the batch conversion region and in the
̟ = ρ uij (kg/m3) τHRefij
H
M = ∑ (HMi + HMi) (J/kg)
H L
m
i=1 0
Figure 1. The ordering of melting phenomena in the industrial melting space: I – the region of batch conversion, II – the region of principal melting phenomena, III – region of temperature and chemical stabilization, IV – the region of melt processing (── phenomenon starts in the batch conversion region I, ---- phenomenon starts inside of the region II, → the potential linking of phenomena or phenomena completion).
II conversion
interface
conversion of batch to melt 1st nucleation (CO
2) 1st foam
removal of primary bubbles
formation and decay of 2nd foam
2nd bubble nucleation and removal
dissolution of solid particles
dissolution of chemical inhomogeneities
removal of secondary defects
III phenomena
interface
IV high temperature
melting part of the facility. However, in the potentially considered advanced facilities composed of several spaces with a specialized melting function, the value of HH
M i can reach a non-zero value in any partial space where the glass is heated.
The specific energy consumption in the industrial melting furnace
For the purpose of the incorporation of melting aspects into the equation for the specific energy con-sumption, the overall specific energy consumption of the current industrial facility (i = 1, j = 2 - 3) was hypothetically classified into two quantities defined by equation (2), i.e. into the energy needed for the batch reactions, the heating of the batch, as well as glass, and into the energy needed to maintain melting temperatures. This hypothetical classification is significant when de-fining and judging the factors determining the energy savings of glass melting. Whereas the specific energy needed for reactions and heating, HH
M i , is practically in-dependent from the melting performance, the speci-fic energy consumed for maintaining the correct tem-peratures, HL
M i , decreases with increasing performance. Both types of energies can be separated by an energy analysis of the melting facility.
The typical glass melting furnace is a one-space facility with several regions; the time intervals of the sand dissolution and bubble removal overlap with the batch conversion (see Figure 1). The interfacial boun-dary melt-batch forms a performance constraint for the batch conversion (only the formed melt crosses the boundary). The batch conversion is thus in a series with the phenomena taking place in the melt and the slower phenomenon in the serial ordering controls the entire melting process. The phenomena in the melt are both parallel (sand dissolution and primary bubble removal) and in a series (liquid inhomeogeneity and sand particle dissolution with the removal of nucleated bubbles). The exit from the melting space forms a performance constraint for the phenomena in the melt (all the phenomena should be terminated before or at least at the exit). The slower phenomenon in the parallel ordering controls the process performance in the melt. The definition of the specific energy consumption should follow the presented phenomena ordering.
When deriving a more general formula for the specific energy consumption, the relation valid for the all-electric melting space [37-42] can be applied as the starting point:
(3)
where HT
M is the specific theoretical heat, ḢLI is the over-all heat flux through boundaries, ρ is the glass density, V is the space volume, and τ‾ BC is the average batch con-version time.
The value of HT
M in equation (3) represents the total energy for batch conversion and heating, HH
M, from equation (2) when no flue gases are present. Similarly, the second term in equation (3), bringing the heat losses through boundaries, represents the total heat for maintaining the temperature in the space, HL
M , from equation (2) when flue gases are absent. Now let us consider the space heated by both fuel combustion and Joule heat. For the sake of simplicity, the heat lost in electrode coolers will be neglected. If the batch and glass are heated by combustion gases, only a part of the heat is absorbed in the heated material owing to thermodynamic and kinetic constraints. The remaining heat content of the flue gases is transported out of the space.
The constant α can be introduced expressing the ratio between the heat absorbed by the batch and melt, and the heat transported away by flue gases. Thus, the value of α is the average efficiency of the heat utilisation. The lower α is, the lower the fraction of absorbed heat and the worse the heating efficiency. Consequently, each amount of energy H supplied by combusted fuel into the batch and melt should be accompanied by the amount of heat ((1 – α)/α)H transported by flue gases from the space. The total need for energy supplied by the combusted fuel is then H + ((1 – α)/α)H. If the value of HT
M then serves as the reference heat H, the energy balance of the HH
M provides:
(4)
where ε is the fraction of total heat supplied as Joule heat. If HBP
M
is the low temperature energy supplied to the batch by flue gases, equation (4) after rearrangement is:
(5)
When evaluating the value of the energy needed for maintaining the temperatures, HL
M , the second term on the right side of equation (3), here designated as HLI
M , will be taken as the reference heat. HLI
M
are the heat losses through boundaries with the exception of heat carried out by flue gases. The total heat consumption for maintaining the temperatures is then given by:
(6)
The heat carried out by flue gases is now given by the second term on the right side of equation (6). If the Joule heat is applied together with the combustion heat, the heat balance HL
M provides analogically with equations (4) and (5):
(7) H
M = εHM+ (1 – ε) HM + (1 – ε) HM
T T T
α (1 – α)
H
H
M = ε(HM – HM ) + (1 – ε)
T BP HM – HM
T BP
α H
H
M = HM + HM
LI 1 – α LI
α
L
HM = εHM + (1 – ε) H
M + (1 – ε) HM = ε
LI LI LI
α (1 – α)
L
M = εHM + (1 – ε) LI
LI
α H
M LI
HM = HM+ τ
BC + T
ρV ḢLI
0
u τHRef
As the value of H0
M is given by the sum of HHM and HL
M , after a substitution for H from equation (3), we MLI have:
(8)
Equation (8) is transformed at ε = 0 for the melting space heated only by combustion:
(9)
On the contrary, if the space is heated only by the Joule heat, ε and α = 1, HBP
M
= 0 and thus equation (3) emerges. In addition, if the batch conversion kinetics is fast or either sand dissolution or bubble removal phenomenon starts early in the batch conversion stage, τ‾ BC + τHRef /uH → τHRef /uH [2]:
(10)
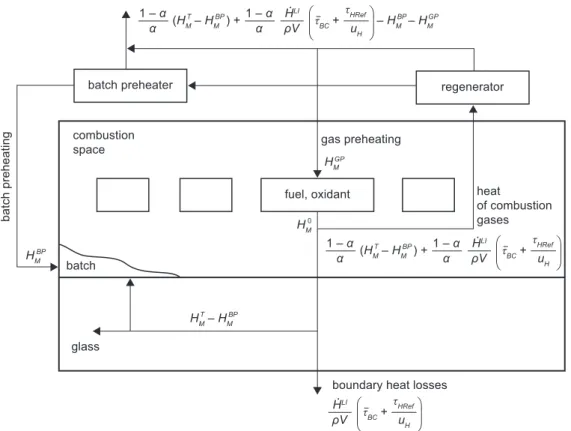
The diagram in Figure 2 shows how the individual items of the specific energy consumption are distributed in the glass melting furnace and its environment. The single terms according to heat balance in equation (9) are present. Both principal heats according to equation
(2) and represented by H0
M , branch into terms with the incorporated value of HT
M and terms containing the refe-rence time, τHRef, as well as the space utilisation, uH. The terms with incorporated HT
M relate to the energy needed for reactions and heating. They can be beneficially affected only by increasing the value of α. The terms with τHRef and uH represent the energy needed to maintain the temperatures and decrease with increasing melting performance. The total energy carried out by flue gases (the terms containing coefficient α) branches out into the heat definitively lost from the system, energy used for gasses preheating, HGP
M
, and energy used for batch preheating, HBP
M
. Both HBP M
and HGP M
are fixed values. If batch preheating is applied, the absorbed high tem-perature heat given by the value of HT
M is reduced by the recycled low temperature energy, i.e. by the term HBP
M . The four aspects of glass melting are thus involved in the equation for the specific energy consumption and can be read from equations (8, 9).
- τ‾ BC and τHRef represent the kinetics of the batch con-version and kinetics of the phenomena in the melt (sand dissolution or bubble removal).
- The sum in the parentheses of the second term, τ‾ BC + τHRef/uH, demonstrates the serial ordering of batch con-version and phenomena in the melt, the choice of τHRef designates the controlling phenomenon in the melt. The performance constraint of the batch-melt interface can be thus expressed by the value of τ‾ BC.
HM0 = ε(HMT – HMBP ) + ε τBC + + 1 T uH τHRef ρV ḢLI
+ (HMT – HMBP ) + τBC + α
1 – ε
ρV ḢLI uH τHRef
HM = (HMT – HMBP ) + τBC + α 1 0 uH τHRef ρV ḢLI
HM0 = HMT+
uH τHRef ρV ḢLI
Figure 2. The diagram showing how the single items of the specific energy consumption are distributed in the gas fired glass melting furnace and its environment. The small rectangles represent the burner inlets. H0
M is the specific energy consumption, HMT is the theoretical energy consumption, HBP
M
is the energy to preheat batch and HGP M
is the energy to preheat gases.
(HM – HM ) + τBC + – HM – HM
T BP
HM – HM
T BP
HMBP
GP
0
BP GP
α 1 – α
heat losses by waste gases
gas preheating
boundary heat losses combustion space glass batch heat of combustion gases HM HM α 1 – α
uH τHRef ρV ḢLI
τBC + uH τHRef ρV ḢLI
(HM – HM ) + τ
BC +
T BP
α 1 – α
α 1 – α
- uH represents the space utilisation for the controlling phenomenon in the melt, the sand dissolution, uD, or bubble removal, uF .
- α and ḢLI represent the average energetic efficiency of batch with glass heating and overall energy flux through space boundaries. Both can be understood as measures of energy utilisation.
The melting potentials resulting from the principal melting phenomena and melting aspects may be derived from the definition of in equations (8, 9). The following possibilities may arise:
Batch conversion is the controlling phenomenon: - the increase in α reflects more effective heat
absorp-tion by the batch and melt. The batch compacabsorp-tion is increasing the material heat conductivity, the increase of the radiation absorptivity of the batch and melt, as well as melt convection decreasing the level tem-perature represents some of potential beneficial steps. - decrease in τ‾ BC reflects the enhanced batch conversion
kinetics. The targeted raw material choice with its granulometry, batch compacting and preheating, and the prescribed thermodynamically and kinetically advantageous time-temperature regimes appear to be the areas for potential improvements.
Phenomena in the melt are controlling by:
- enhanced sand dissolution and bubble separation ki-netics,
- improved space utilisation for phenomena (not applied yet).
Whereas the enhanced kinetics of phenomena was continuously followed by both glass researchers and technologists [3-19] and was applied with the aid of mathematical modelling to the industrial glass melting spaces [20-33], the improvement of space utilisation in order to make the glass melting more effective has not yet
been systematically studied. Nevertheless, the specific performance of the melting space is directly proportional (equation (1)) and the heat lost by boundaries is inversely related (equations (8, 9)) to the space utilisation for the given phenomenon. It is therefore worth investigating utilisation.
All the fundamental processes in the melt become parallel:
- if the reacting batch can be mixed with the hot melt and no batch blanket were to form on the glass level or the batch conversion is realized out of the melt level, the melting performance bottleneck on the phase boundary between batch blanket and melt would be abolished. However, no technical solution is available up to now.
Space utilization as a quantity intensifying the phenomena in the melt – sand
dissolution and bubble removal
Space utilisation is a quantity which compares the duration of the given melting phenomenon in a quiescent melt, τHRef, with the necessary mean residence time of the melt in a continuous space, τG [2, 34–41]:
(11)
where V is the space volume and V· is the volume flow rate of the melt through the space.
The values of uH may also be expressed with the aid of a dead space, virtual dead space and a virtual height. These quantities relate to the given character of melt flow and express the potential of the given flow patterns to accomplish the given phenomenon inside of the space effectively [36-42]. The application of uD and uF(space utilisation for sand dissolution, uD, and for bubble re-moval, uF) in a simple melting space (melting channel) showed that high utilisation values can be achieved in
uH = τ , τG = , uH∈〈0; 1〉
G
τHRef
V· V
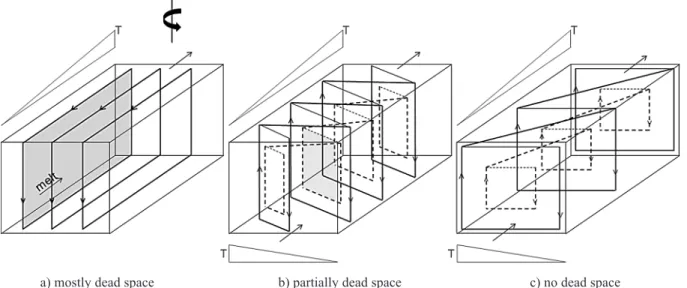
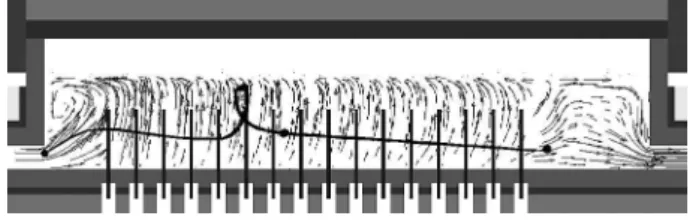
Figure 3. The schematic picture of the helical flow developing when applying the transversal temperature gradient in a horizontal channel with originally longitudinal circulations.
spaces with uniform flow where the uD = uF = 1 for plug flow and uD = 0.455, uF = 0.667 for the flow of isothermal melt [43], as well as in spaces with a helical flow. The modelling studies had shown that uD = uF = = 0.6 - 0.8 in optimal cases [40-41].
The helical flow seems to be more stable than the uniform flow and therefore preferentially applicable. Figure 3 shows how the longitudinal circulations in a horizontal channel turn gradually owing to the simul-taneously applied transversal temperature gradient and modify to transversal circulations, consequently, the original longitudinal flow character changes to the helical one. Under the conditions of only longitudinal circulations, only a small part of the channel volume forming the periphery of the longitudinal circulation body is available for through-flowing melt. The velocity of the through-flowing melt is consequently high and only a small part of the volume is usable for accomplishing the melting phenomena. When the transversal temperature gradient is applied and its value is gradually increased, the longitudinal circulations turn to transversal ones and the internal melt shells are opened for the through-flowing melt. The fraction of the space usable for the melting processes increases and this leads to an increase of the space utilization and consequently, to an increase of the melting performance and decrease of heat losses. Thus, the helical flow in the melting space can be set up by a proper temperature distribution in the melting space. The value of the space utilisation strongly depends on the ratio between the transversal and longitudinal temperature gradient [38, 41]. It is important that high values of the space utilisation for both sand dissolution and bubble removal can be obtained at comparable temperature conditions and character of glass flow. It provides the condition for the simultaneous operation of both phenomena in a common melting space under a unified melt flow character.
However, the optimal temperature distribution can-not be perfectly set up in real glass melting furnaces owing to the heat transfer constraints. Particularly the batch blanket on the glass level forces low temperatures under batch and supports the longitudinal circulations. The question arises therefore of which values of space utilisation can be acquired in present melting spaces with the batch blanket and classical longitudinal type of glass circulations.
In order to clarify this question, an end port re-generative furnace was mathematically modelled [1], showing a nominal pull rate of 240 t/day, (2.37 t/ /(day·m2)), and an average temperature in the melting
part of 1387oC. The space utilisation for both sand
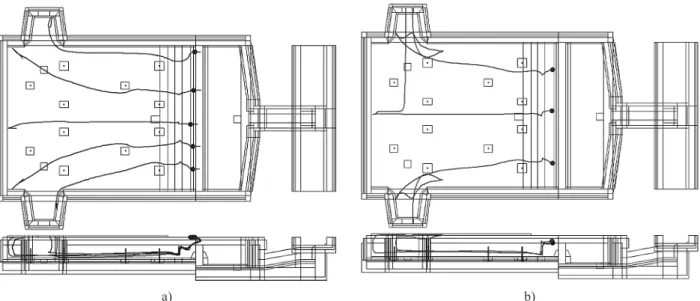
dissolution and bubble removal was calculated up to the barrier (designated in Figure 4) using the mathematical model and laboratory data of sand dissolution and bubble removal valid for float glass [43]. Figure 4a, b presents the critical and close-to critical trajectories of bubbles and sand particles in the XY projections. The parameters of the critical bubble and sand particle were used for the calculation of the space utilisation.
The values of some quantities necessary to calculate the space utilisation were: τG = (the mean residence time) 81944 s, τ‾ (the average residence time of the melt) = = 34 160 s, τ‾ D (the average sand dissolution time) = 6009 s, τF (the removal time of the critical bubble) = 5525 s, τFRef (the reference removal time of the critical bubble) = 4149 s, τ‾ /τmin = 5.48. The space utilisation of the bubble removal provided the value of uF = 0.051 and the space utilisation value for the sand dissolution, uD = 0.073.
Compared with the values of space utilisation for the isothermal flow or with the optimized (helical) flow in the model channel, the space utilisation of the industrial furnace appears to be very low. The great difference between the industrial and mentioned model spaces reveals a chance to attain a considerable increase
Figure 4. The XY projections of the critical trajectories of bubbles (a) and sand particles (b) in the regenerative end-port furnace, obtained by mathematical modelling.
of melting performance and decrease of heat losses in the industrial spaces where the condition of the helical flow would be fulfilled only partially. The industrial melting space without a batch blanket was therefore modelled, being 6.57 m long, 2.0 m wide and having a glass layer of 1 m to obtain the reference states at different characters of the melt flow. The average temperature 1425oC in the space was maintained by the electrodes.
In the reference case, the longitudinal melt circulations were set up by the transversal row of electrodes whereas the central longitudinal row of electrodes was used to set up the helical character of melt flow. The second case is presented in Figure 5 [43]. The following values were attained for both border cases:
- The reference case with the classical character of the melt flow provided a space utilisation: uD = 0.041, wall losses HLI
M
= 924 kJ/kg, a melting performance P = 44.0 t/day and a specific melting performance π = 2.8 t/(day·m2)).
- The case with a helical-like melt flow provided a space utilisation uD = 0.595, wall losses HLI
M
= 50 kJ/kg, a melting P = 880 t/day and a specific melting per-formance π = 55.8 t/(day·m2)).
The results show a drastic increase of the space utilization and a corresponding increase of the melting performance, as well as a decrease of heat losses, when setting up a helical-like character of the melt flow in the mentioned space without a batch blanket. The hypothetical values of the specific heat losses and space utilisations were then calculated for cases lying between the maximal and minimal (reference) melting performances under the assumption that the corresponding batch conversion was previously feasible. The similar temperature distribution at the same average temperature in the melt was anticipated and consequently, the constant values of heat flux through boundaries, ḢLI, and reference melting time were applied. The sand dissolution was considered the controlling phenomenon [43]. Equations that hold true for the heat losses and space utilization as functions of the melting performance P have then the simple forms:
(12)
(13)
Both dependences are obvious from Figure 6. The entire presented dependence has been calculated using the case with the helical-like flow which showed a maximal value of melting performance of 880 t/day. Nevertheless, the value of the specific heat losses obtained in the reference case at P = 44.1 t/day was also plotted on the graph to check the usability of Equations (12, 13). As Figure 6 shows, the value fits well with the dependence for helical flow and provides evidence of the very weak dependence of ḢLI and τ‾ D on the character of the melt flow. The results show that a decisive decrease of heat losses is attained already at a relatively small increase of melting performance values from the reference value 44.1 t/day which arises also from equation (12); the partial control of the melt flow therefore seems to be efficient.
The value of the specific theoretical heat, HT
M = 2635 kJ/kg was then applied to calculate the specific energy consumption H0
M as a function of melting performances in the interval lying between the reference case and the case characterized by the helical-like flow. The values of the specific heat losses come from Figure 6. Equation (9) was used where ((1 – α)/α)[ḢLI/ρV(τ‾ BC + τHRef/uH)] = 0 (heat losses by walls were covered by the electrical heating) and τ‾ BC + τHRef/uH = τ‾ D/uD:
(14)
The different values of a were applied for the calculation. The results of H0
M calculations as a function of the melting performance are presented in Figures 7 and 8. The conversion of the batch into glass is again assumed. The percentage of energy saved owing to the increase of melting performance is also plotted. The va- lues provide the impact of the controlled melt flow on the energy consumption and energy savings in the region between the two modelled cases. The maximal energy savings of up to about 25 % and the minimal value Figure 5. The model melting space with the central
longitudinal row of electrodes and with the critical and close-to critical trajectories of sand particles obtained by mathematical modelling [43]. The sand dissolution was the controlling phenomenon in the melt.
Figure 6. The dependence of the specific heat losses and the space utilisation on the melting performance of the model space according to the results of mathematical modelling and equations (12-13).
0 400
HM - calculated
HM - mathematical modeling
u
D - mathematical modeling
800
200 600 1000
P (t/d)
HM
(
k
J
/k
g
)
L
L
L
0 400 800
200 600 1000
uD
0.0 0.4 0.8
0.2 0.6 1.0
uD = P pV
τD
HM = HM + H
M +
T T
LI
α
1 – α
0
ρV ḢM τD
uD
1
HML =
of H0
M below 3000 kJ/kg are attained in the case of only electrical heating in Figure 7. The batch conversion by combustion heat α = 0.5 (50 % of supplied heat absorbed by the batch and 50 % by the melt) shows the maximal energy savings below 15 % and the relevant relatively high value of H0
M around 5500 kJ/kg in the same figure. Figure 8 shows the impact of a on both followed quantities at α = 0.55 and 0.60. However, the character of glass flow cannot influence substantially the value of α because the main impact on a is hidden in the batch properties and batch conversion rate, as well as in the efficiency of the combustion processes. In agreement with Figure 7, the decisive decrease of the specific energy consumption (and increase of energy savings) is obvious at a relatively small increase of the melting performance from the reference state, i.e. at only a partial transition of the glass flow character to the helical one.
Phenomena sequence and space utilisation – exploitation of process improvements
The consideration of the phenomena ordering si-multaneously with phenomena improvements leads to a more effective melting process. The serial ordering of the batch conversion with phenomena in the melt (particle dissolution or bubble removal) is the most significant phenomena sequence of industrial glass melting. In practice, the improvement of either batch conversion or phenomena in the melt can be attained and the increase of the pull rate is needed to exploit the improvement. However, the rate of both phenomena in series must be adequately increased in order to maintain a balance of the sequenced phenomena. The relevant procedure is schematically presented in Figure 9.
The initial state represents the balanced original state in which the batch conversion process is characterized by the standard covering of the glass level by the batch blanket and the controlling phenomenon in the melt is terminated at the output (critical state). When increasing the rate of the batch conversion (left side of the figure), the covering by the batch is reduced but the intensity of the phenomena in the melt remains unchanged. In the second step, the phenomena in the melt should be adequately accelerated or their space utilisation should be increased and the melting performance (pull rate) is increased to attain the original degree of glass covered by the batch as well as a new the critical state in the melt. The right side of Figure 8 shows the case in which the rate of the phenomena in the melt is initially accelerated or the space utilization is increased. A melting reserve arises in the melt. Subsequently, the conversion of the batch should be enhanced and the melting performance can be increased up to the point of reaching the critical state. According to current knowledge, the increase of the melting capacity of the melt region by higher space utilization is the promise now but augmenting the batch conversion rate or space capacity becomes the important task at hand.
Potentials resulting from phenomena ordering and space utilisation Increase in the melting capacity
of serial phenomena in the classical melting space
The modelling results indicate that energy savings caused by an optimized melt flow may reach around 10 - 15 %. However, the melting performance indicates even multiple increases under equivalent conditions. The small or medium sized melting furnaces could then replace the large ones. As is apparent from the text above, some problems arise; however, when setting up a controlled melt flow in the batch region characterized Figure 7. The specific energy consumption, H0
M , according to equations (10) and (14) and the percentage of saved energy as a function of the melting performance. The values of heat losses come from Figure 6. The average temperature is 1425°C, the float type of glass is used. (--- 50 % of supplied heat absorbed by the batch and glass, α = 0.5, (equation (14)); ─── the electrical heating only, α = 0, equation (10)).
Figure 8. The specific energy consumption, H0
M , according to equation (14) and the percentage of saved energy as a func-tion of the melting performance, the heat losses come from Figure 6. The average temperature is 1425°C, the float type of glass is used (─── 60 % of absorbed heat in the batch, α = 0.60; --- 55 % of absorbed heat in the batch, α = 0.55).
0 200 400 600 800 1000
P (t/d)
HM
(
k
J
/k
g
)
0
2000 4000 6000
3000 5000 7000
s
a
v
e
d
e
n
e
rg
y
(
%
)
0 10 20
5 15 25 saved energy
HM0
0 200 400 600 800 1000
P (t/d)
HM
(
k
J
/k
g
)
0
2000 4000 6000
3000 5000 7000
s
a
v
e
d
e
n
e
rg
y
(
%
)
0 10 20
5 15 25
saved energy H
by the fixed temperature distribution, a simultaneous increase of the batch conversion capacity is needed as an integral part of the intensification procedure.
Batch conversion as a phenomenon parallel with bubble removal
and sand dissolution
The capacity of batch conversion is restricted by the melt transfer from the batch blanket to the melt bath. The rapid transfer of the just forming glass or even the in-mixing of partially converted batch in the melt bath is desirable which makes the batch conversion partially or entirely parallel with the sand dissolution and bubble removal. The controlling function of batch conversion would thus be restricted or abolished and the only controlling phenomenon will be either sand dissolution or bubble removal. Unfortunately, there are no reliable tests of direct batch in-mixing available.
The batch conversion accomplishment in a separate pre-melting space
It is easier to set up an efficient helical flow and to achieve high values of space utilisation in a special melting space without a batch blanket. Consequently, a new space for rapid batch conversion has to be
incorporated into the melting facility but its precise function is not determined yet. It should be also taken into account that the new space will increase the total heat losses through boundaries.
CONCLUSION
Four aspects of the melting process were proposed and included in the equations for the specific energy consumption and melting performance of a continuous glass melting space. The proposed aspects are the kinetics of partial melting phenomena, the utilization of the melting space and the supplied energy, and the mutual ordering of principal melting phenomena, namely batch conversion, particle dissolution and bubble removal. Among the present prospective factors of effective glass melting, space utilization appears significant. The increase of the space utilization through melt flow control improves the efficiency of the processes in the melt and allows a decrease of heat losses, as well as a substantial increase of melting performance even under conditions of partial control of the melt flow. However, the serial ordering of batch conversion and phenomena in the melt requires an adequate increase of the batch conversion
Figure 9. The schematic demonstration of the necessary procedure leading to a more effective melting process in the glass melting space. Left side: the batch conversion is primarily enhanced. Right side: the bubble removal as a controlling phenomenon in the melt is primarily enhanced. Curves in the rectangles: the schematic critical trajectories of sand particles or bubbles. V̇ - the volume melting performance of the space.
critical bubble
critical sand particle smaller covering
by batch
V˙
V˙
critical bubble
critical sand particle improvement of phenomena in melt (τ, u)
enhancement of batch conversion and increase of performance (pull rate) enhancement of batch conversion
V˙
critical bubble
critical sand particle steady covering
by batch
Example: bubble removal control
original steady covering
critical bubble
critical sand particle
>
1 2
almost original covering by batch
almost original covering by batch
V˙
1
V˙ V˙2>V˙
critical bubble
critical sand particle
capacity of the space. The high degree of melt flow control and new principles of batch conversion process thus become the crucial factors for further development.
Acknowledgement
This work has been supported by the project of the Technology Agency of the Czech Republic, No. TA01010844, ‘New glasses and their technologies’.
REFERENCES
1. Němec L., Jebavá M., Kloužek J., Polák M.: Glasstrend Seminar, Eindhoven, April 10-12, 2013.
2. Němec L., Jebavá M., Cincibusová P.: Ceramics-Silikáty 50, 140 (2006).
3. Potts J.C., Brookover G., Burch O.G: J. Am. Ceram. Soc. 27, 1471 (1944).
4. Potts J.C.: J. Soc. Glass Technol. 23, 129 (1939). 5. Potts J.C.: J. Am. Ceram. Soc. 24, 43 (1941).
6. Lyle A.K.: In: Travaux IVe Congress International du Verre, Paris 1956, p. 93.
7. Pearce M. L.: J. Am. Ceram. Soc. 48, 611 (1965). 8. Cooper A.R.: Glass Technol. 21, 87 (1980). 9. Doremus R.H.: J. Am. Ceram. Soc. 43, 655 (1960). 10. Ready D.W., Cooper, A.R.: Chem. Eng. Sci. 21, 917 (1966). 11. Hrma P.: Silikáty 24, 7 (1980).
12. Cable M., Evans D.J.: J. Appl. Phys. 38, 2899 (1967). 13. Cable M.: Glass Technol. 1, 139, 144 (1960), ibid. 2, 151
(1961).
14. Mulfinger H.O.: Glastechn. Ber. 45, 238 (1972). 15. Němec L: Glass Technol. 15, 153 (1974). 16. Němec L.: J. Am. Ceram. Soc. 60, 436 (1977)
17. Hrma P.: Glastechn. Ber. Glass Sci. Technol. 55, 138 (1982).
18. Bodalbhai L., Hrma P.: Glass Technology 27, 72 (1986). 19. Němec L.: Glastechn. Ber. Glass Sci.Technol. 68, 1 (1995). 20. Simonis F., De Waal H., Beerkens R.C.G.: XIV Int. Congr.
on Glass - Collected Papers Part III (1986), p. 118. 21. ngan A. Viskanta R.: Glastech. Ber. 60, 71 (1987). 22. Ungan A., Viskanta R.: Glass Technol. 28, 252 (1987). 23. Ungan A.: Glastechn. Ber. 60, 115 (1987).
24. Choudhary M.K.: J. Non-Cryst. Sol. 101, 41 (1988). 25. Viskanta R.; J. Non-Cryst. Sol. 177, 347 (1994) . 26. Goldberg A.J.: Glastechn. Ber. 46, 67 (1973).
27. Simonis F.: Proceedings of the 2nd Int. Conf. “Advances in the Fusion and Processing of Glass”, Glastech. Ber. 63K, 1 (1990).
28. Ungan A., Turner W.H., Viskanta R.: Glastech. Ber. 56K, 125 (1983).
29. Mühlbauer M., Němec L.: Am. Ceram. Soc. Bull. 64, 1471 (1985).
30. Beerkens R., Muijsenberg H., van den Heiden T.: Glastechn. Ber. Glass Sci. Technol. 67, 179 (1994).
31. Ungan A: Glastechn. Ber. 63K, 19 (1990).
32. Matyáš J., Němec L.: Glass Sci. Technol. 76, 71 (2003). 33. Oda K, Kaminoyama M.: J. Cer. Soc. Japan 117, 736
(2009).
34. Němec L., Jebavá M.: Glass Technol.: Eur. J. Glass Sci. Technol. A 47, 68 (2006).
35. Němec L., Cincibusová P.: Ceramics-Silikáty 52, 240 (2008).
36. Němec L., Cincibusová P.: Ceramics-Silikáty 53, 145 (2009).
37. Polák M., Němec L.: Ceramics-Silikaty 54, 212 (2010). 38. Polák M., Němec L.: J. Non-Cryst. Sol. 357, 3108 (2011). 39. Jebavá M., Němec L.: Ceramics-Silikáty 55, 232 (2011). 40. Polák M., Němec L.: J. Non-Cryst. Sol. 358, 1210 (2012). 41. Cincibuová P., Němec L.: Glass Technol.: Eur. J. Glass Sci.
Technol. A 53, 150 (2012).
42. Němec L, Cincibusová P.: Glass Technol.: Eur. J. Glass Sci. Technol. A 53, 279 (2012).